Information


RCB Stake Sale Explained: Why United Spirits is Exiting & Who Benefits?
.webp)

Quick Summary
- United Spirits plans to sell its entire stake in Royal Challengers Sports for ₹16,660 crore
- The deal reflects rising IPL franchise valuations and strong investor interest
- Strategic shift by United Spirits towards core business focus
- New investors like Times Internet bring media and digital synergy
- Limited direct impact, but strong sentiment boost for sports business in India
A Big Ticket Deal in Indian Sports Business
The recent announcement that United Spirits will divest its stake in Royal Challengers Sports has caught the attention of both market participants and cricket fans.
The deal, valued at ₹16,660 crore, highlights how Indian Premier League franchises have evolved into high-value business assets rather than just sports teams.
For many investors, this raises two important questions. Why is United Spirits exiting now, and who stands to gain from this deal?
Understanding the RCB Stake Sale
Royal Challengers Sports is the entity that owns the popular IPL franchise Royal Challengers Bangalore. Over the years, the team has built a strong brand, massive fan following, and significant commercial value.
The entry of investors like Times Internet and Metropolitan Media Company signals a shift toward media-driven monetisation.
This is not just a stake sale. It is a reflection of how sports, media, and digital platforms are converging in India.
Why is United Spirits Exiting?
Strategic Business Focus
United Spirits is primarily a liquor company. Managing a sports franchise may not align with its long-term core strategy.
By exiting RCB, the company can focus on strengthening its main business segments and improving operational efficiency.
Unlocking Value
The IPL ecosystem has seen a massive jump in valuations over the past few years.
Selling the stake at ₹16,660 crore allows United Spirits to unlock significant value from a non-core asset. This capital can be redeployed into higher-return opportunities.
Regulatory and Governance Considerations
Companies often streamline their business structure to improve transparency and governance.
Exiting unrelated businesses can simplify financial reporting and align better with investor expectations.
Who Benefits from the Deal?
1. New Investors
Investors like Times Internet bring strong expertise in digital content, advertising, and audience engagement.
This opens up new monetisation channels such as:
- Digital streaming and content partnerships
- Fan engagement platforms
- Brand collaborations and sponsorships
2. IPL Ecosystem
The deal reinforces the growing commercial strength of the IPL.
Higher valuations create a positive ripple effect across:
- Media rights deals
- Sponsorship contracts
- Franchise expansions
3. United Spirits Shareholders
If the proceeds are used efficiently, shareholders could benefit through:
- Debt reduction
- Higher dividends
- Reinvestment in core growth areas
IPL Valuations: A Bigger Story
The Indian Premier League has transformed into one of the most valuable sports leagues globally.
For example, media rights deals have crossed billions of dollars in recent cycles.
Franchises are no longer dependent only on match revenues. Today, they generate income from:
- Sponsorships
- Merchandise sales
- Digital content
- Global fan base monetisation
This makes IPL teams attractive investment assets for institutional investors.
Impact on Indian Stock Market
While this deal may not have an immediate broad market impact, it sends strong signals.
Positive Sentiment for Sports and Media
Companies involved in sports management, media, and digital platforms may see increased investor interest.
Corporate Strategy Shift
Investors are increasingly rewarding companies that focus on core competencies and exit non-core businesses.
Capital Allocation Focus
This move highlights the importance of efficient capital allocation, a key factor in long-term wealth creation.
Real-World Context
Globally, sports franchises have seen rising valuations.
In leagues like the NBA and English Premier League, teams are often valued in billions of dollars due to media rights and global fan engagement.
India is now following a similar trend, with IPL leading the way.
What Should Investors Watch Next?
Investors should keep an eye on a few key developments:
- How United Spirits uses the proceeds from the sale
- Growth strategy of new investors in RCB
- Future IPL valuation trends
- Expansion of digital monetisation in sports
These factors will determine the long-term impact of this deal.
FAQs
1. Why is United Spirits selling its RCB stake?
The company is exiting to focus on its core liquor business and unlock value from a non-core asset.
2. Who are the new investors in RCB?
The investor consortium includes Times Internet and Metropolitan Media Company.
3. What is the value of the deal?
The stake sale is valued at approximately ₹16,660 crore.
4. How does this impact the IPL?
It highlights rising franchise valuations and growing investor interest in the league.
5. Should investors track United Spirits stock after this deal?
Yes, investors should monitor how the company utilizes the proceeds and its future growth strategy.
Conclusion
The RCB stake sale is more than just a corporate transaction. It reflects the rapid evolution of sports into a serious business opportunity in India.
For United Spirits, this is a strategic move toward sharper focus and better capital allocation. For new investors, it opens doors to leverage digital and media synergies in one of the world’s fastest-growing sports markets.
For investors, such developments underline the importance of tracking not just numbers, but also strategy.
If you want expert insights, research-backed recommendations, and a seamless investing experience, Swastika Investmart offers a strong platform backed by SEBI registration, advanced tools, and dedicated customer support.
%20(3).avif)
Market Closing Summary Today 25 March 2026: Nifty, Sensex, and Bank Nifty Surge Strongly & What’s Fueling the Market Momentum?
The Indian stock market witnessed a strong rally today, with the Nifty 50, Sensex, and Bank Nifty all closing higher. The Nifty 50 rally today reflects growing investor confidence, supported by sectoral strength and positive sentiment across global and domestic cues. But what exactly is driving this surge, and how should investors interpret it?
Let’s break it down in a simple and practical way.
Key Takeaways
- Nifty 50 and Sensex gained over 1.5 percent, showing strong bullish sentiment
- Banking and financial stocks led the rally, lifting Bank Nifty above 2 percent
- IT sector showed mild gains, indicating selective buying
- Positive global cues and domestic stability supported the uptrend
- Investors should focus on sector rotation and risk management
Market Overview: A Strong Bullish Day
The broader indices moved upward with notable strength. The Nifty 50 surged by over 1.7 percent, while the Sensex gained more than 1.6 percent. Bank Nifty outperformed the broader market, rising over 2 percent, signaling strong participation from financial stocks.
This kind of synchronized rally across indices typically indicates institutional buying, especially from domestic institutional investors and foreign portfolio investors.
What’s Driving the Nifty 50 Rally Today?
1. Banking Sector Strength
The biggest contributor to today’s rally was the banking sector. Large private banks and PSU banks saw strong buying interest. This is often a positive sign because banking stocks are considered a backbone of the Indian economy.
With stable interest rate expectations from the Reserve Bank of India and improving asset quality, banking stocks are attracting investor attention.
2. Positive Global Cues
Global markets played a supportive role. When international markets perform well, Indian markets often follow due to interconnected capital flows. Stability in crude oil prices and easing inflation concerns also boosted sentiment.
3. Domestic Economic Confidence
India’s macroeconomic indicators remain strong. GDP growth outlook, controlled inflation, and government spending continue to support the market. Regulatory bodies like SEBI ensure transparency and investor protection, which builds long-term confidence.
4. Sector Rotation Strategy
Investors are rotating their funds from overvalued sectors to undervalued ones. While IT stocks showed only marginal gains, banking and financial stocks took the lead. This rotation helps sustain the rally rather than creating a bubble.
Sector-Wise Performance
Banking and Financials
The clear winners of the day. Strong credit growth and improving balance sheets are key reasons behind the rally.
IT Sector
Nifty IT showed limited gains. This indicates cautious optimism due to global uncertainty in tech spending.
FMCG and Defensive Stocks
These sectors remained relatively stable, showing that investors are willing to take calculated risks rather than staying defensive.
What Should Investors Do Now?
Avoid Chasing the Rally
While the Nifty 50 rally today looks attractive, entering at peak levels without proper analysis can be risky. Markets often experience short-term corrections after sharp rallies.
Focus on Quality Stocks
Investors should look for fundamentally strong companies with consistent earnings growth. Banking, infrastructure, and capital goods sectors may offer opportunities.
Diversify Your Portfolio
Diversification helps reduce risk. Instead of putting all your funds into one sector, spread investments across multiple sectors.
Stay Updated with Regulations
Keep an eye on updates from SEBI and RBI. Policy changes can impact market direction significantly.
Real-World Insight
For example, during previous rallies, investors who focused only on trending stocks often faced losses when the market corrected. On the other hand, those who invested in fundamentally strong companies and stayed patient benefited in the long run.
How Swastika Investmart Can Help
Navigating such market movements requires the right tools and guidance. Swastika Investmart offers a reliable platform for investors looking to make informed decisions.
With SEBI-registered operations, advanced research tools, and a strong focus on investor education, it helps both beginners and experienced investors understand market trends better. The platform’s tech-driven approach ensures smooth and efficient trading.
Frequently Asked Questions
What is causing the Nifty 50 rally today?
The rally is driven by strong performance in banking stocks, positive global cues, and stable domestic economic conditions.
Is it a good time to invest in the stock market?
It depends on your investment strategy. Long-term investors can look for opportunities, but short-term traders should be cautious.
Why is Bank Nifty outperforming?
Banking stocks are benefiting from strong credit growth, improving asset quality, and stable interest rate expectations.
Should I invest in IT stocks now?
IT stocks may offer selective opportunities, but global uncertainties make them slightly volatile in the short term.
How can I manage risk during a market rally?
Diversify your portfolio, avoid over-investing in one sector, and focus on fundamentally strong companies.
Conclusion
The Nifty 50 rally today highlights the strength and resilience of the Indian stock market. With banking stocks leading the charge and supportive macroeconomic factors in place, the outlook remains positive. However, smart investing requires discipline, research, and patience.
If you want to make informed investment decisions and stay ahead of market trends, explore a reliable platform that combines technology with expert insights.

Why Did Gold Surge After a 9-Day Fall? Explained with Oil Shock & US-Iran War Impact
Quick Summary
- Gold rebounded near $4,550 after a sharp 9-day decline
- US-Iran war uncertainty triggered safe-haven demand
- Crude oil volatility and inflation fears drove sentiment
- Interest rate expectations and central bank actions added volatility
- Indian markets may see impact on inflation, rupee and gold demand
A Sudden Turn in Gold Prices
After a painful nine-day losing streak, gold prices made a strong comeback. The yellow metal climbed close to $4,550 per ounce, gaining around 1.5 percent in a single session.
This sharp reversal has left investors wondering: what changed so quickly?
The answer lies in a mix of geopolitical uncertainty, oil price volatility, and shifting global monetary expectations.
How the US-Iran War Changed the Narrative
The ongoing US-Iran conflict has been the biggest driver of recent market volatility.
On one hand, reports suggested a possible diplomatic breakthrough, with a 15-point peace proposal being discussed. On the other hand, there were reports of additional troop deployment in West Asia.
This contradiction created uncertainty rather than clarity.
Why does this matter for gold?
Gold is considered a safe-haven asset. When uncertainty rises, investors move money from risky assets like equities into gold.
Even a hint of escalation or instability can trigger demand.
The Oil Shock That Triggered the Fall First
Before the rebound, gold had actually fallen nearly 15 percent during the month.
The reason? A sharp spike in crude oil prices.
Oil surged to nearly $120 per barrel after attacks on energy infrastructure in key Gulf nations like Saudi Arabia, UAE and Qatar.
Impact of rising oil prices
- Higher inflation expectations
- Pressure on global economies
- Central banks delaying rate cuts
This created a negative environment for gold initially.
Why Gold Fell Despite Global Tensions
It may sound counterintuitive, but gold does not always rise during crises.
Here is what happened:
1. Rising Interest Rate Expectations
With inflation fears rising, central banks like the European Central Bank and Bank of England may keep interest rates higher for longer.
Higher rates reduce gold’s appeal because gold does not generate interest income.
2. Liquidity Pressure in Markets
Stock markets corrected sharply during the crisis. Investors sold gold to generate cash and cover losses elsewhere.
3. Central Bank Activity
Some central banks reportedly sold gold or explored gold swaps to support their currencies. This added selling pressure.
So, Why Did Gold Suddenly Surge Again?
After the sharp correction, three key factors triggered the rebound:
1. Safe-Haven Demand Returned
Conflicting war reports increased uncertainty again. Investors rushed back to gold for safety.
2. Bargain Buying at Lower Levels
After a 15 percent correction, gold became attractive for long-term investors and institutions.
3. Market Positioning Shift
Traders who had exited earlier re-entered positions, adding momentum to the rally.
Impact on Indian Markets
The gold price movement is not just a global story. It has direct implications for Indian investors.
1. Inflation Concerns
Higher oil prices can push inflation up in India, impacting consumption and interest rates.
2. Rupee Pressure
A rise in crude oil import bills can weaken the rupee, indirectly supporting gold prices in India.
3. Gold Demand in India
India is one of the largest gold consumers. Volatility may impact jewellery demand, but investment demand can increase.
4. Stock Market Sentiment
When gold rises due to fear, it often signals risk-off sentiment in equities.
Real-World Example
In early 2020 during global uncertainty, gold surged sharply while equity markets corrected.
A similar pattern is emerging now.
When uncertainty increases, gold acts as a hedge. But when interest rates rise sharply, gold can temporarily lose its shine.
What Should Investors Do Now?
Gold remains a strategic asset, not a trading instrument for most investors.
Smart approach
- Maintain 5 to 10 percent allocation in gold
- Avoid panic buying during spikes
- Use corrections to accumulate gradually
For Indian investors, options include:
- Gold ETFs
- Sovereign Gold Bonds regulated by RBI
- Digital gold platforms
FAQs
1. Why did gold rise after falling for 9 days?
Gold rebounded due to renewed geopolitical uncertainty, safe-haven demand, and bargain buying after a sharp correction.
2. How do oil prices affect gold?
Higher oil prices increase inflation, which impacts interest rates. This indirectly affects gold prices.
3. Is gold a good investment in 2026?
Gold remains a good hedge against inflation and uncertainty, but it should be part of a diversified portfolio.
4. Why do interest rates impact gold?
Gold does not offer interest income, so higher interest rates make other assets more attractive.
5. How can Indian investors invest in gold?
Investors can choose Gold ETFs, Sovereign Gold Bonds, or physical gold depending on their goals.
Conclusion
Gold’s recent surge after a sharp fall highlights one key truth: markets are driven by sentiment as much as fundamentals.
Geopolitical tensions, oil price shocks, and interest rate expectations are all interconnected. For investors, the focus should not be on timing gold perfectly, but on using it wisely as a hedge.
If you are looking to build a well-balanced portfolio with expert insights, Swastika Investmart offers strong research tools, SEBI-registered advisory support, and a tech-driven platform to help you make informed decisions.
.avif)
Petrol Scarcity and Fake News: Reality and Its Impact on Stock Prices in India
Petrol scarcity is a topic that instantly grabs attention in India. When combined with fake news, it can trigger panic, disrupt markets, and influence stock prices within hours. In today’s digital-first world, misinformation spreads faster than facts, often leading to irrational investor behavior and short-term volatility in the Indian stock market.
Understanding the real impact of petrol scarcity and fake news is crucial for investors who want to make informed decisions rather than react emotionally.
Key Takeaways
- Fake news around petrol scarcity can cause short-term market volatility
- Oil marketing companies and logistics stocks are most affected
- Regulatory bodies like SEBI monitor misinformation closely
- Long-term investors should focus on fundamentals, not rumors
- Media literacy is becoming a critical skill for modern investors
Understanding Petrol Scarcity in India
India depends heavily on crude oil imports, making fuel supply sensitive to global disruptions. However, actual petrol scarcity is rare and usually localized. It may occur due to:
- Supply chain disruptions
- Panic buying triggered by rumors
- Temporary logistical bottlenecks
Government agencies and oil companies usually act quickly to stabilize supply. The Reserve Bank of India also keeps a close watch on inflationary pressures caused by fuel price fluctuations.
The Role of Fake News in Fuel Panic
Fake news amplifies fear. A single viral message about petrol shortage can lead to long queues at fuel stations across cities. This artificial demand spike creates a temporary illusion of scarcity.
Common sources of misinformation include:
- Forwarded messages on messaging apps
- Edited or misleading videos
- Unverified social media posts
In many cases, these rumors have no factual basis but still manage to influence public behavior significantly.
How Petrol Scarcity Rumors Affect Stock Prices
1. Oil Marketing Companies See Volatility
Stocks of companies like IOC, BPCL, and HPCL often react immediately to petrol scarcity news. Investors anticipate higher demand but also fear supply disruptions and margin pressure.
Short-term traders may jump in, increasing volatility. However, fundamentals usually remain unchanged.
2. Logistics and Transport Stocks React
Fuel availability directly impacts transportation. Fake scarcity news can cause temporary declines in logistics stocks due to fears of operational disruptions.
For example, transport companies may see stock dips as investors worry about rising fuel costs or delivery delays.
3. FMCG and Manufacturing Stocks Get Indirectly Hit
Petrol is a key input in supply chains. Even rumors can trigger concerns about:
- Higher transportation costs
- Reduced consumption due to inflation fears
This can lead to mild corrections in FMCG and manufacturing stocks.
4. Broader Market Sentiment Turns Negative
Markets are driven by sentiment as much as fundamentals. Fake news can create uncertainty, leading to:
- Increased selling pressure
- Higher volatility in indices
- Risk-off behavior among investors
This is especially visible in retail-driven market phases.
Real Example: Panic Buying Episodes
India has witnessed several instances where rumors of petrol shortage led to panic buying. In such cases:
- Fuel stations run dry temporarily
- News channels amplify the situation
- Stock markets react sharply but briefly
Within days, clarity emerges, and markets stabilize. This pattern shows how misinformation creates noise rather than lasting impact.
Regulatory Oversight and Market Stability
Authorities play a crucial role in controlling misinformation.
- SEBI monitors unusual market movements and insider trading risks
- Government agencies issue clarifications to counter fake news
- Digital platforms are increasingly being regulated to curb misinformation
Despite these efforts, investors must remain cautious and verify information before acting.
Smart Investing During News-Driven Volatility
Focus on Fundamentals
Do not base investment decisions on unverified news. Evaluate:
- Company earnings
- Balance sheet strength
- Long-term growth potential
Avoid Panic Buying or Selling
Emotional decisions often lead to losses. Markets tend to correct themselves once the truth emerges.
Diversify Your Portfolio
A diversified portfolio reduces the impact of sector-specific volatility caused by events like fuel rumors.
Use Reliable Research Platforms
Platforms like Swastika Investmart provide:
- Strong research and advisory support
- SEBI-registered brokerage services
- Tech-driven tools for better decision-making
- Investor education to navigate market noise
This helps investors separate facts from speculation.
Why Fake News Has a Bigger Impact Today
The speed of information dissemination has increased dramatically. With smartphones and social media:
- News spreads instantly
- Verification takes time
- Emotional reactions dominate rational thinking
This makes markets more sensitive to rumors than ever before.
FAQs
Q1. Does petrol scarcity really affect stock markets in India?
Yes, but mostly in the short term. It impacts sentiment and causes temporary volatility, especially in oil and transport stocks.
Q2. How can investors identify fake news?
Always cross-check information with official sources, news portals, or company announcements before acting.
Q3. Which sectors are most affected by fuel-related news?
Oil marketing, logistics, aviation, and FMCG sectors are the most sensitive to fuel-related developments.
Q4. What role does SEBI play in such situations?
SEBI monitors market manipulation and ensures transparency to protect investors.
Q5. Should I sell stocks during such panic situations?
Not necessarily. If fundamentals remain strong, it is often better to stay invested and avoid emotional decisions.
Conclusion
Petrol scarcity combined with fake news creates a powerful mix that can temporarily shake the Indian stock market. However, these effects are usually short-lived and driven by sentiment rather than fundamentals.
For investors, the key is to stay informed, think rationally, and avoid reacting to unverified information. Building a disciplined approach and relying on credible research platforms can make a significant difference.
If you want to navigate such market situations with confidence, explore the tools and insights offered by Swastika Investmart.
Stock Market Midday Live Updates 25 March 2026: Indian Stock Market Rally Nifty, Sensex, and Bank Nifty and What's fueling the indian stock market momentum
The Indian stock market witnessed a strong upward move today, with the Nifty 50 and BSE Sensex closing firmly in the green. Positive global cues, sectoral strength, and renewed investor confidence have pushed benchmark indices higher, creating fresh opportunities for traders and long-term investors alike.
In this blog, we break down what’s driving the rally, which sectors are leading, and how you can position your portfolio wisely.
Key Highlights at a Glance
- Nifty 50 and Sensex gained over 1.5 percent in a single session
- Banking stocks led the rally with strong buying interest
- Positive global cues and easing inflation boosted sentiment
- Broader markets showed mixed but improving participation
What Is Driving the Nifty 50 Rally?
Strong Global Cues
Global markets have been relatively stable, with easing concerns around inflation and interest rates. When global risk sentiment improves, emerging markets like India often attract increased capital inflows.
Foreign Institutional Investors, who play a major role in market direction, have shown renewed buying interest. This has directly supported the upward move in indices like the Nifty 50.
Banking Sector Leading the Charge
The rally was largely driven by banking stocks, with the Nifty Bank outperforming broader indices. Strong credit growth, improving asset quality, and stable interest margins have kept investor confidence high in the banking space.
Large-cap private banks and select PSU banks contributed significantly to today’s gains.
Positive Domestic Macroeconomic Signals
India’s macroeconomic fundamentals remain strong. Controlled inflation, stable GDP growth, and proactive policies by the Reserve Bank of India have created a favorable environment for equity markets.
Additionally, regulatory oversight by Securities and Exchange Board of India ensures transparency and investor protection, further strengthening trust in the market.
Sectoral Rotation and IT Stability
While banking stocks surged, IT stocks showed moderate gains, indicating sectoral rotation. Investors are selectively moving capital across sectors based on valuations and earnings visibility.
This kind of rotation is a healthy sign, suggesting that the rally is not narrow but supported by multiple sectors.
What Should Investors Do in a Rising Market?
Avoid Chasing Momentum Blindly
A sharp rally often creates fear of missing out. However, entering stocks after a strong up move without proper analysis can be risky. Focus on fundamentally strong companies rather than short-term price action.
Stick to Asset Allocation
Maintain a balanced portfolio across equity, debt, and other asset classes. Even in a bullish market, diversification helps manage risk effectively.
Watch Key Levels
Technical levels in indices like Nifty 50 and Sensex are crucial. If the rally sustains above resistance levels, it could indicate further upside. However, profit booking at higher levels is also common.
Focus on Quality Stocks
Invest in companies with strong balance sheets, consistent earnings, and good management. Long-term wealth creation depends more on quality than timing.
Role of a Trusted Broker in Market Navigation
In volatile and fast-moving markets, having the right platform and research support makes a significant difference. Swastika Investmart stands out as a SEBI-registered broker offering:
- Advanced research and advisory tools
- Reliable customer support
- Tech-enabled trading platforms
- Strong focus on investor education
Such features help investors make informed decisions rather than emotional ones.
Real-World Insight: How Smart Investors React
Experienced investors typically use rallies to rebalance portfolios rather than aggressively buying. For instance, if banking stocks rally sharply, they may book partial profits and reallocate funds to undervalued sectors.
This disciplined approach helps in preserving gains while staying invested for long-term growth.
FAQs
What caused the Nifty 50 rally today?
The rally was driven by strong global cues, banking sector performance, and positive domestic economic indicators.
Is it a good time to invest in the stock market?
It depends on your investment horizon. Long-term investors can consider staggered investments rather than lump sum entries during rallies.
Which sectors are performing well right now?
Banking and financial services are leading, while IT and other sectors are showing steady participation.
How do RBI policies impact the stock market?
Interest rate decisions and liquidity measures by RBI directly influence market sentiment and sector performance, especially banking.
What should beginners do in a rallying market?
Start with fundamentally strong stocks, avoid overtrading, and consider using a trusted platform for research and execution.
Final Thoughts
The current rally in the Nifty 50 and Sensex reflects strong underlying confidence in the Indian economy. While the momentum is encouraging, disciplined investing remains the key to long-term success.
Instead of chasing short-term gains, focus on building a resilient portfolio backed by research and strategy. If you are looking for a reliable platform to begin or enhance your investing journey, you can explore opportunities with Swastika Investmart.
Market Opening Updates for Today 25 March 2026: Nifty 50, Sensex, Bank Nifty Strong Rally Driven
The Indian stock market opened on a positive note today, with the Nifty 50 and BSE Sensex extending gains. Banking stocks took center stage, pushing the Nifty Bank higher, while IT stocks showed mild weakness.
This mixed but optimistic trend reflects growing investor confidence supported by domestic cues and steady global sentiment.
Key Takeaways
- Nifty 50 and Sensex closed higher with strong buying momentum
- Banking sector outperformed, lifting overall market sentiment
- IT sector faced mild selling pressure
- Positive domestic factors continue to support the rally
Market Overview: What’s Driving Today’s Rally
The benchmark indices posted solid gains, with Nifty 50 rising around 0.66 percent and Sensex climbing nearly 0.79 percent. The key driver behind this upward movement was strong buying in banking stocks.
The Nifty Bank index gained close to 0.80 percent, reflecting renewed interest in financial stocks. This momentum is largely backed by improving asset quality, stable interest rate outlook, and strong credit growth projections.
Meanwhile, the Nifty IT slipped slightly by 0.33 percent. Weak global tech cues and cautious outlook from IT companies contributed to this decline.
Banking Stocks Lead the Charge
Banking stocks have been the backbone of this rally. Large-cap banks are witnessing consistent inflows from institutional investors.
Several factors are supporting this trend:
Strong Credit Growth
Indian banks continue to report steady loan growth, driven by retail and corporate demand. This indicates a healthy economic environment.
Stable Interest Rate Outlook
The Reserve Bank of India has maintained a balanced stance on interest rates. This stability supports banking margins and profitability.
Improved Asset Quality
Non-performing assets have declined significantly in recent quarters, boosting investor confidence in the sector.
Why IT Stocks Are Under Pressure
While the broader market is positive, IT stocks are facing headwinds.
Global Uncertainty
IT companies rely heavily on overseas markets, especially the US. Concerns about global economic slowdown are impacting demand visibility.
Currency Volatility
Fluctuations in the rupee-dollar exchange rate also affect earnings expectations.
Weak Guidance
Some IT firms have issued cautious outlooks, leading to profit booking by investors.
What This Means for Investors
The current market setup presents both opportunities and caution signals.
Opportunities in Banking and Financials
With strong fundamentals and improving macro conditions, banking stocks may continue to outperform in the near term.
Selective Approach in IT
Investors should remain selective in IT stocks and focus on companies with strong order books and diversified revenue streams.
Diversification Is Key
A balanced portfolio across sectors can help manage risk and capture growth opportunities.
Regulatory Perspective
The Securities and Exchange Board of India continues to emphasize transparency and investor protection. Recent regulatory measures have strengthened market stability and improved investor confidence.
Additionally, RBI’s monetary policy stance remains supportive of growth while keeping inflation in check. This balance is crucial for sustaining the current market momentum.
Role of Research and Advisory
In such dynamic market conditions, having access to reliable research and insights becomes essential. Platforms like Swastika Investmart offer:
- SEBI-registered brokerage services
- Strong research-backed recommendations
- Advanced trading platforms for seamless execution
- Dedicated customer support and investor education
These features can help investors make informed decisions in a volatile environment.
FAQs
What is driving the Nifty 50 rally today?
The rally is mainly driven by strong performance in banking stocks and positive domestic economic indicators.
Why are IT stocks falling despite a rising market?
IT stocks are under pressure due to global uncertainty, weak demand outlook, and cautious guidance from companies.
Is it a good time to invest in banking stocks?
Banking stocks currently show strong fundamentals, but investors should evaluate valuations and long-term prospects before investing.
How does RBI policy impact the stock market?
RBI’s interest rate decisions influence liquidity, borrowing costs, and overall market sentiment.
What should investors focus on in current market conditions?
Investors should focus on diversification, sectoral trends, and fundamentally strong companies.
Conclusion
The Indian stock market continues to show resilience, with banking stocks leading the current rally. While IT sector weakness adds a note of caution, the overall outlook remains positive due to strong domestic fundamentals and supportive policies.
For investors, this is a time to stay informed, remain selective, and focus on long-term wealth creation.
If you are looking to explore smarter investing opportunities with research-backed insights, consider starting your journey here
.avif)
Stocks in News Today 25 March 2026: United Spirits, Waaree Energies, BPCL, and Tata Steel Key Market Movers
Staying updated with stocks in news is essential for traders and long-term investors in the Indian stock market. Corporate developments, capex plans, and strategic deals often drive short-term price action and shape long-term fundamentals. On 25 March 2026, several major companies made headlines, signaling important trends across sectors like energy, metals, and consumer goods.
Let’s break down the key developments and what they mean for investors.
Key Takeaways
- United Spirits Limited plans a major stake sale worth Rs. 16,660 crore
- Waaree Energies Limited announces Rs. 3,900 crore capex for expansion
- Bharat Petroleum Corporation Limited secures green hydrogen supply deal
- Tata Steel Limited strengthens its portfolio with a strategic acquisition
United Spirits: Strategic Exit Unlocks Value
United Spirits Limited is set to sell its entire 100 percent stake in Royal Challengers Sports Pvt Ltd for Rs. 16,660 crore. The deal involves a consortium including major institutional players.
This move highlights a broader trend where companies are focusing on core operations and unlocking value from non-core assets. For United Spirits, the transaction could improve balance sheet strength and provide capital for reinvestment in its core liquor business.
From a market perspective, such large transactions often attract institutional interest and can lead to re-rating of the stock, depending on how efficiently the proceeds are deployed.
Waaree Energies: Big Bet on Renewable Manufacturing
Waaree Energies Limited has approved a capex plan of Rs. 3,900 crore to set up a glass manufacturing plant. This is a significant step toward backward integration in the solar value chain.
India’s renewable energy sector is witnessing strong policy support from the government, including Production Linked Incentive schemes and import substitution strategies. By investing in glass manufacturing, Waaree aims to reduce dependency on imports and improve margins.
For investors, this signals long-term growth potential. However, capex-heavy expansions may impact short-term profitability, making it important to track execution and demand visibility.
BPCL: Advancing in Green Hydrogen and Biofuel
Bharat Petroleum Corporation Limited continues to diversify into clean energy. Its joint venture with Sembcorp has secured a contract to supply 10 KTPA of green hydrogen to Numaligarh Refinery.
Additionally, the company has commissioned its second-generation bioethanol refinery at Bargarh. These initiatives align with India’s push toward energy transition and reduced carbon emissions.
Regulatory bodies like the Ministry of Petroleum and Natural Gas, along with policy frameworks influenced by institutions such as the Securities and Exchange Board of India, are encouraging transparency and sustainability disclosures. BPCL’s moves place it well within this evolving framework.
For investors, this strengthens BPCL’s long-term positioning, although traditional refining margins will still play a key role in near-term earnings.
Tata Steel: Strengthening Global Footprint
Tata Steel Limited has acquired a stake in T Steel Holdings for Rs. 1,680 crore. This move is part of its broader strategy to consolidate operations and enhance efficiency.
The steel sector remains cyclical, heavily influenced by global demand, commodity prices, and infrastructure spending. With India focusing on large-scale infrastructure development, companies like Tata Steel stand to benefit.
However, investors should remain cautious about global headwinds such as slowing demand in key markets and fluctuations in raw material costs.
What This Means for the Indian Stock Market
These developments reflect three major themes shaping the Indian market in 2026:
1. Capital Reallocation
Companies are divesting non-core assets to improve efficiency and shareholder returns.
2. Renewable Energy Push
Energy companies are aggressively investing in green technologies, aligning with India’s climate goals.
3. Strategic Expansion
Capex and acquisitions indicate confidence in long-term economic growth, especially in infrastructure and manufacturing.
For retail investors, tracking such stocks in news helps identify emerging opportunities and sectoral trends. It is also important to cross-check company announcements with official filings on exchanges regulated by SEBI to ensure accuracy.
The Role of Research-Driven Investing
Market-moving news can create both opportunities and risks. This is where a research-backed approach becomes crucial. Platforms like Swastika Investmart provide investors with:
- SEBI-registered brokerage services
- In-depth research and advisory tools
- Reliable customer support
- A tech-enabled investing platform
- Strong focus on investor education
Such features help investors interpret news events and make informed decisions rather than reacting emotionally to headlines.
Frequently Asked Questions
1. What are stocks in news?
Stocks in news refer to companies that have made significant announcements or developments that could impact their share price.
2. How should investors react to stock news?
Investors should analyze the long-term impact of the news rather than making impulsive decisions based on short-term market reactions.
3. Are capex announcements good for stocks?
Capex announcements signal growth but may affect short-term profits. The long-term impact depends on execution and demand.
4. Why is green hydrogen important for companies like BPCL?
Green hydrogen supports India’s clean energy goals and helps companies diversify beyond traditional fossil fuels.
5. Where can I verify company announcements?
You can check official disclosures on stock exchanges regulated by SEBI or company filings.
Conclusion
The stocks in news for 25 March 2026 highlight a market driven by transformation, innovation, and strategic decision-making. From United Spirits’ value unlocking move to Waaree’s expansion and BPCL’s green push, each development reflects broader economic trends.
For investors, the key lies in understanding the story behind the headlines. A disciplined, research-driven approach can turn market noise into meaningful opportunities.
If you want to stay ahead with expert insights and smart tools, explore Swastika Investmart’s platform here:
.avif)
Share Market Setup Today 25 March 2026: Nifty50, Sensex, BankNifty Eyes Recovery Amid Positive Global Cues
The Indian stock market setup for 25 March 2026 reflects a cautiously optimistic tone, supported by improving global signals and short-covering possibilities. While US markets ended slightly lower, positive movement in Dow futures and firm Asian markets are offering a supportive backdrop. Traders should closely monitor key resistance levels as both Nifty and Bank Nifty show early signs of recovery.
Key Takeaways
- Global cues are mildly positive with Dow futures and Asian markets supporting sentiment
- FIIs remain net sellers, while DIIs continue to provide stability
- Nifty faces immediate resistance at 23232, with upside potential toward 23633
- Bank Nifty shows reversal signs above 53500, targeting 54400–54900 zone
Global Market Overview
Global markets are setting a constructive tone for Indian equities. The US markets closed marginally lower, with the Dow Jones slipping by 84 points. However, the sentiment improved overnight as Dow futures gained over 300 points. Asian markets are trading in the green, indicating risk-on sentiment across global equities.
Adding to the positive setup, GIFT Nifty is up by 114 points, suggesting a gap-up opening for Indian indices. This aligns with a broader trend of recovery seen in global equities after recent volatility.
FII and DII Activity: Mixed Signals
Institutional activity continues to play a crucial role in market direction. Foreign Institutional Investors remained net sellers with outflows of ₹8010 crore. On the other hand, Domestic Institutional Investors provided strong support with inflows of ₹5867 crore.
Despite DII support, the net institutional flow stands negative at ₹2143 crore. This indicates that while domestic investors are cushioning the downside, sustained upside will require a shift in FII sentiment.
From a derivatives perspective, FIIs have created short positions in index futures. This could act as a trigger for short covering if key resistance levels are breached, potentially leading to sharp upside moves.
Derivatives Data and Market Positioning
Options data currently offers limited clarity due to weekly expiry dynamics. However, key observations include:
- Highest Open Interest at 24000 Call and 20000 Put
- Max Pain level at 23000
The positioning suggests a broad trading range, with 23000 acting as a pivotal level for the current expiry cycle. Traders should remain cautious as volatility, indicated by India VIX near 24.7, remains elevated.
Nifty Technical Outlook
Nifty is showing early signs of relief after recent declines. The immediate hurdle stands at 23232. A decisive move above this level could trigger short covering, pushing the index toward 23633.
On the downside, support levels are placed at 23000, followed by 22900 and 22640. These levels are crucial for maintaining the bullish bias in the near term.
Strategy for Traders
- Bullish above 23232 with targets near 23600+
- Watch for short covering momentum above resistance
- Use dips toward 23000 as potential buying opportunities with strict risk management
Bank Nifty Technical Outlook
Bank Nifty is also indicating signs of reversal. The index faces immediate resistance at 53500. A breakout above this level could lead to an extended rally toward the 54400–54900 zone.
Support levels are placed at 52500 and 52000. These levels are critical in case of profit booking after a gap-up opening.
Strategy for Traders
- Bullish bias above 53500
- Momentum likely to accelerate toward 54500 zone
- Support-based buying strategy remains favorable
Regulatory Context and Market Confidence
The Indian stock market continues to operate under strong regulatory oversight from the Securities and Exchange Board of India (SEBI). Measures such as improved transparency in derivatives data and tighter risk management norms help maintain investor confidence.
Additionally, macroeconomic stability supported by the Reserve Bank of India (RBI) policies ensures liquidity and market resilience, even during periods of global uncertainty.
Why Research Matters in Volatile Markets
In a market environment driven by global cues and institutional flows, having access to reliable research and timely insights becomes essential. This is where platforms like Swastika Investmart play a crucial role.
As a SEBI-registered broker, Swastika Investmart provides:
- In-depth market research and actionable insights
- Advanced trading platforms for seamless execution
- Dedicated customer support for investors
- A strong focus on financial education and informed investing
Such tools help traders navigate volatility with confidence and clarity.
Frequently Asked Questions
1. What is the outlook for Nifty on 25 March 2026?
Nifty shows signs of recovery. A move above 23232 can trigger short covering and push the index toward 23633.
2. Why are FIIs selling in the market?
FIIs often react to global cues, interest rate expectations, and currency movements. Current selling may be linked to global uncertainty.
3. What is the significance of Max Pain at 23000?
Max Pain indicates the level where option sellers incur the least loss. It often acts as a magnet for price movement near expiry.
4. Is Bank Nifty bullish right now?
Bank Nifty is showing reversal signs. A breakout above 53500 can lead to strong upward momentum.
5. How should traders approach today’s market?
Traders should focus on key resistance levels and look for short-covering opportunities while maintaining strict risk management.
Conclusion
The market setup for 25 March 2026 leans toward a positive opening, supported by global cues and potential short covering. However, resistance levels remain crucial, and sustained upside will depend on institutional participation, especially from FIIs.
For traders and investors, staying informed and disciplined is key. If you are looking to navigate the markets with expert insights and a reliable platform, consider exploring Swastika Investmart.
Stock Market Holiday Tomorrow 26 March 2026 due to Ram Navami: What Traders Must Know
The Indian stock market holiday on Ram Navami 2026 is an important event for traders and investors to track. On 26 March 2026, both the National Stock Exchange and Bombay Stock Exchange will remain closed, impacting trading strategies, expiry cycles, and short-term market movements.
If you actively trade or invest, understanding how this holiday affects the market can help you plan better and avoid unnecessary risks.
Key Highlights
- Indian stock markets will remain closed on 26 March 2026
- Weekly F&O expiry shifts to Wednesday, 25 March 2026
- Shortened trading week may increase volatility
- Commodity markets may reopen in the evening session
- Traders should adjust positions before expiry
Why the Stock Market is Closed on 26 March 2026
The market closure is due to Ram Navami, a widely celebrated festival in India. As per the official holiday calendar issued by Securities and Exchange Board of India and exchanges, trading is suspended across segments.
Segments Closed:
- Equity cash market
- Equity derivatives (F&O)
- Currency derivatives
This means no trading activity will take place on either National Stock Exchange or Bombay Stock Exchange during the day.
Impact on Weekly Expiry and Trading Strategy
One of the biggest implications of this holiday is the shift in weekly expiry.
Expiry Adjustment
Since Thursday is a market holiday, the weekly F&O expiry is moved to Wednesday, 25 March 2026.
This change has several implications:
1. Increased Volatility Before Expiry
Markets often see higher volatility a day before expiry. With one less trading session, traders rush to adjust positions, leading to sharp moves.
2. Position Squaring by Institutions
Foreign Institutional Investors and Domestic Institutional Investors may rebalance portfolios earlier than usual. This can cause sudden spikes in volume.
3. Option Premium Decay Happens Faster
With less time available, option premiums may decay rapidly. This can benefit option sellers but increase risk for buyers.
Shortened Trading Week: What It Means
A shorter trading week typically leads to compressed price action. Here is how it affects different market participants:
Retail Traders
Retail traders may face unpredictable price swings. It becomes important to avoid over-leveraging and maintain strict stop losses.
Swing Traders
Swing traders need to account for the missing trading session. Holding positions over a long weekend increases overnight risk.
Long-Term Investors
For long-term investors, such holidays do not significantly impact strategy. However, they can create short-term buying opportunities during volatility.
Commodity Market Timings
Unlike equity markets, the commodity market operates differently.
- Morning session remains closed
- Evening session may reopen depending on the exchange schedule
This is particularly relevant for traders dealing in metals and energy commodities.
Regulatory Perspective and Market Discipline
Market holidays are structured and pre-declared under guidelines from Securities and Exchange Board of India and monetary oversight by Reserve Bank of India.
These scheduled closures ensure:
- Smooth settlement cycles
- Operational efficiency
- Risk management across clearing corporations
Understanding these frameworks helps investors appreciate the discipline behind Indian financial markets.
Practical Tips for Traders Before the Holiday
To navigate the Ram Navami market holiday effectively, consider these actionable insights:
Plan Ahead
Avoid last-minute trades on expiry day. Prepare your strategy in advance.
Reduce Excess Exposure
High leverage can amplify losses during volatile sessions. Keep risk under control.
Monitor Global Cues
Even though Indian markets are closed, global markets remain active. This can lead to gap-up or gap-down openings later.
Focus on Quality Stocks
During uncertain periods, fundamentally strong stocks tend to perform better.
How Swastika Investmart Helps You Stay Ahead
In dynamic market conditions like holiday-adjusted weeks, having the right broker makes a difference. Swastika Investmart stands out with:
- SEBI-registered credibility and trust
- Strong in-house research and advisory support
- Advanced, tech-enabled trading platform
- Dedicated customer service for quick issue resolution
- Focus on investor education and awareness
These features help traders make informed decisions even during volatile periods.
Frequently Asked Questions
Is the stock market closed on 26 March 2026?
Yes, NSE and BSE are closed due to Ram Navami.
When is the weekly expiry for that week?
The expiry shifts to Wednesday, 25 March 2026.
Will commodity markets be open?
The morning session is closed, but the evening session may open.
Does a market holiday affect long-term investors?
Not significantly. It mainly impacts short-term traders and derivatives participants.
Why is expiry shifted before holidays?
To ensure smooth settlement and avoid disruptions in trading cycles.
Final Thoughts
The Ram Navami stock market holiday on 26 March 2026 is more than just a day off. It directly impacts expiry schedules, trading strategies, and short-term market behavior.
Being aware of such calendar events helps you stay prepared, reduce risks, and capitalize on opportunities. Whether you are a trader or investor, planning ahead is the key to success.
If you want a smarter way to navigate such market events, explore trading with Swastika Investmart and leverage expert-backed insights.
FII FPI & DII Trading Activity on 24 March 2026 : What ₹-2142 Cr Net Flow Signals for the Market
Understanding FII DII activity today is crucial for decoding short-term market direction, especially during volatile phases like expiry sessions. On 24 March 2026, the market saw mixed institutional participation, resulting in a net outflow of ₹2,142.41 crore, indicating continued caution among global investors.
Let’s break down what this data really means for traders and investors.
Quick Summary
- FIIs remained aggressive sellers with heavy outflows
- DIIs provided strong buying support, cushioning the fall
- Net institutional flow stood at ₹-2142.41 crore
- Market remains range-bound ahead of expiry
- Global cues continue to dominate sentiment
FII vs DII Activity Breakdown
NSE Capital Market Segment
- DII Net Buying: ₹5,485.91 crore
- FII Net Selling: ₹6,436.77 crore
Combined (NSE + BSE + MSEI)
- DII Net Buying: ₹5,867.15 crore
- FII Net Selling: ₹8,009.56 crore
Final Net Result
- Total Net Flow: ₹-2142.41 crore
This indicates that despite strong domestic buying, foreign selling pressure outweighed the support.
Why Are FIIs Selling?
Foreign Institutional Investors are highly sensitive to global macroeconomic factors. Current selling pressure can be attributed to:
1. Global Uncertainty
Rising geopolitical tensions and unclear global growth outlook often push FIIs toward safer assets like US bonds.
2. Dollar Strength
A stronger US dollar typically leads to capital outflows from emerging markets like India.
3. Profit Booking Before Expiry
With monthly expiry approaching, FIIs often unwind positions to manage risk.
Why DIIs Are Buying Aggressively
Domestic Institutional Investors have been consistently supporting the market. Here’s why:
Long-Term Confidence in India
DIIs, including mutual funds and insurance companies, are driven by long-term fundamentals rather than short-term volatility.
SIP Inflows
Steady inflows from retail investors via SIPs give DIIs liquidity to buy during dips.
Valuation Comfort
Certain sectors are now available at reasonable valuations after recent corrections.
What Does This Mean for the Market?
1. Market Still in a Range
The tug-of-war between FIIs and DIIs is keeping the market directionless.
2. Downside Is Limited
Strong DII buying is acting as a cushion, preventing sharp falls.
3. Volatility Likely to Continue
With expiry and global cues in play, expect high intraday swings.
Sectoral Impact to Watch
- Banking and IT: Most impacted by FII selling
- FMCG and Pharma: Defensive sectors seeing DII interest
- Midcaps: Showing resilience due to domestic flows
Regulatory Perspective
Market participation by FIIs and DIIs is regulated by the Securities and Exchange Board of India, ensuring transparency and fair practices. Additionally, liquidity and currency movements influenced by the Reserve Bank of India also play a critical role in institutional behavior.
How Should Traders React?
Short-Term Traders
- Stay cautious during expiry
- Focus on intraday opportunities rather than positional bets
Long-Term Investors
- Use dips as accumulation opportunities
- Follow DII-backed sectors for stability
Role of a Trusted Broker
In such uncertain conditions, having the right platform matters. Swastika Investmart stands out with:
- SEBI-registered credibility
- Strong research-backed insights
- Advanced trading tools
- Investor-first approach
This helps investors navigate volatile markets with confidence.
Frequently Asked Questions
What is FII DII activity?
It refers to buying and selling activity of Foreign Institutional Investors and Domestic Institutional Investors in the stock market.
Why is FII selling important?
FII selling can lead to market corrections as they control large volumes of capital.
Can DII buying stop market crashes?
Yes, to an extent. DIIs provide stability, especially during heavy FII selling.
Is negative net flow always bearish?
Not always. If DIIs are strong buyers, markets may consolidate instead of falling sharply.
How to track FII DII data daily?
You can track it via stock exchange data releases and broker platforms.
Final Thoughts
The ₹-2142.41 crore net outflow reflects a cautious undertone in the market rather than outright bearishness. While FIIs continue to exit, strong domestic participation is keeping the market stable.
For investors, this is a phase of patience, not panic. Focus on fundamentals, avoid overtrading, and let institutional trends guide your strategy.
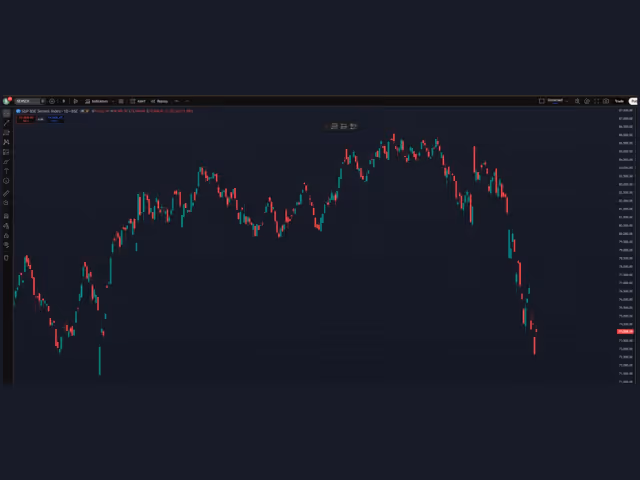
Sensex Expiry Tomorrow 25 March 2026: Range-Bound or Breakout Ahead?
As the monthly expiry approaches tomorrow, the Sensex continues to trade in a directionless zone, leaving traders uncertain about the next big move. While today’s recovery offers short-term relief, the broader structure still appears neutral. The big question remains: is this a market bottom or just a temporary pullback?
The answer largely depends on global cues, geopolitical developments, and institutional activity, all of which can shift sentiment quickly in the short term.
Key Takeaways
- Sensex remains range-bound ahead of tomorrow’s expiry
- 75,000 is a strong resistance while 72,500 is a crucial support
- Market structure remains neutral with high volatility expected
- Strategy favors sell on rise and buy on dips with strict risk control
Why the Market Feels Directionless
Markets often enter a consolidation phase before major events like monthly expiry. This is driven by position adjustments from institutional players, including Foreign Institutional Investors and Domestic Institutional Investors.
In India, derivatives trading is regulated by the Securities and Exchange Board of India, and expiry days often see heightened volatility due to options unwinding and rollover activity.
Global cues are also playing a major role. Factors like US bond yields, crude oil prices, and geopolitical tensions can quickly influence Indian equities. Since India is closely integrated with global markets, even minor international developments can trigger sharp moves.
Technical Levels to Watch Closely
At present, Sensex is trading near the 74,000 mark, which places it right in the middle of a crucial range.
Resistance Zone: 75,000
The 75,000 level is acting as a strong resistance. Unless the index manages to sustain above this level, upside momentum may remain limited. Traders can expect selling pressure to emerge on rallies toward this zone.
Support Levels: 73,000 and 72,500
On the downside, 73,000 serves as immediate support. A break below this level could push the index toward 72,500, which is a critical support zone. If this level fails, it may lead to accelerated selling and increased volatility.
Expiry Strategy for Traders
With expiry just around the corner, clarity in strategy becomes crucial.
Range-Bound Approach
As long as Sensex stays between 72,500 and 75,000, expect choppy and volatile movement. In such conditions, range trading strategies tend to work better than directional bets.
- Sell on rise near resistance
- Buy on dips near support
- Avoid aggressive leveraged positions
Breakout or Breakdown Scenario
A decisive move beyond these levels could define the next trend:
- Above 75,000: Potential bullish breakout with short covering
- Below 72,500: Bearish breakdown leading to fresh downside
In both cases, traders should wait for confirmation rather than anticipating the move prematurely.
Role of Regulations and Market Structure
Indian markets operate under strict regulatory oversight by SEBI, ensuring transparency and risk management in derivatives trading. Margin requirements, position limits, and surveillance mechanisms are designed to protect retail investors, especially during high-volatility events like expiry.
Understanding these frameworks helps traders navigate risk more effectively and avoid unnecessary exposure.
Practical Insights for Retail Traders
For retail participants, expiry trading can be tempting due to quick price movements, but it also carries higher risk.
- Stick to predefined stop losses
- Avoid overtrading during volatile swings
- Focus on capital preservation rather than chasing profits
Platforms like Swastika Investmart provide traders with research-backed insights, technical analysis tools, and a reliable trading infrastructure. Being a SEBI-registered broker, it emphasizes investor education and disciplined trading practices, which are essential during uncertain market phases.
FAQs
1. Why is Sensex moving in a range before expiry?
This usually happens due to position adjustments by institutional investors and lack of strong directional cues from global markets.
2. What is the most important level for tomorrow’s expiry?
75,000 on the upside and 72,500 on the downside are the key levels to watch.
3. Is it safe to trade on expiry day?
Expiry trading can be volatile. It is safer to trade with strict risk management and avoid high leverage.
4. What strategy works best in a range-bound market?
Sell on rise and buy on dips is generally effective when the market lacks clear direction.
5. How do global cues impact Sensex?
Global factors like US markets, crude oil prices, and geopolitical tensions directly influence investor sentiment in India.
Conclusion
As Sensex heads into tomorrow’s expiry, the market continues to trade within a well-defined range, reflecting indecision among participants. While short-term recovery offers some optimism, the overall structure remains neutral until a clear breakout or breakdown occurs.
For now, disciplined execution, risk management, and patience remain the keys to navigating this phase. Instead of chasing momentum, focusing on well-defined levels and strategies can help traders stay on the right side of the market.
If you are looking to trade smarter with expert insights and a reliable platform, explore Swastika Investmart.
Market Closing Summary Today 24 March 2026: Nifty, Sensex, and Bank Nifty Surge Strongly & Reasons & What Investors Should Do
The Indian stock market today witnessed a broad-based rally, with benchmark indices like the Nifty 50, Sensex, and Bank Nifty closing firmly in the green. Positive global cues, easing macro concerns, and strong sectoral participation pushed markets higher, boosting investor sentiment across segments.
What Happened in the Market Today
Indian equities ended the session on a strong note:
- Nifty 50 gained nearly 1.8 percent to close above 22,900
- Sensex surged close to 1.9 percent, crossing 74,000
- Bank Nifty outperformed with a sharp rise of over 2.2 percent
- Nifty IT also posted solid gains of around 1.7 percent
This upward momentum signals renewed confidence among institutional and retail investors.
Key Takeaways
- Broad-based buying seen across banking, IT, and large-cap stocks
- Bank Nifty leads rally, indicating strength in financial sector
- Positive global cues and easing volatility support sentiment
- Midcaps and large caps both participated in the uptrend
Why Did the Indian Stock Market Rise Today
1. Strong Global Cues
Global markets showed signs of stability after recent volatility. Easing geopolitical concerns and steady US economic indicators helped improve risk appetite, which reflected positively in Indian equities.
2. Banking Sector Momentum
Banking stocks played a crucial role in today’s rally. Strong credit growth outlook and stable asset quality expectations continue to attract institutional money into financial stocks.
3. IT Sector Recovery
The IT index saw buying interest after recent corrections. Investors are selectively accumulating quality IT stocks at lower levels, expecting demand recovery in global tech spending.
4. FII and DII Activity
Foreign Institutional Investors and Domestic Institutional Investors both showed buying interest, which provided stability and upward momentum to the markets.
5. Technical Breakout
From a technical perspective, Nifty moving above key resistance levels triggered fresh buying. Momentum traders and algorithmic systems added to the rally once breakout levels were sustained.
Sector-Wise Performance
Banking and Financials
The banking sector emerged as the top performer. PSU banks and private lenders both saw strong buying. This indicates confidence in India’s economic growth and credit cycle.
Information Technology
IT stocks showed a rebound after a phase of consolidation. Companies with strong deal pipelines and stable margins attracted investor interest.
FMCG and Defensive Stocks
Defensive sectors like FMCG remained stable but underperformed compared to high-beta sectors. Investors preferred growth-oriented segments today.
Midcap and Smallcap Stocks
Broader markets also participated, though gains were relatively moderate. Select midcap stocks continued to outperform based on strong earnings visibility.
What This Means for Investors
Short-Term Outlook
The market trend remains bullish in the short term. However, after a sharp rally, some consolidation or profit booking cannot be ruled out.
Long-Term Perspective
India’s long-term growth story remains intact. Factors such as strong GDP growth, policy stability under RBI and SEBI regulations, and increasing retail participation continue to support markets.
Risk Factors to Watch
- Global geopolitical tensions
- Crude oil price fluctuations
- Inflation and RBI policy stance
- Earnings season surprises
Investors should stay cautious and avoid chasing momentum blindly.
Smart Investment Strategy in Current Market
1. Focus on Quality Stocks
Invest in fundamentally strong companies with consistent earnings growth and strong balance sheets.
2. Diversify Your Portfolio
Spread investments across sectors like banking, IT, FMCG, and capital goods to reduce risk.
3. Use SIP Approach
Systematic Investment Plans help reduce volatility risk and ensure disciplined investing, especially in uncertain markets.
4. Follow Research-Based Investing
Rely on credible research and advisory platforms rather than market rumors.
Platforms like Swastika Investmart provide investors with SEBI-registered research, advanced tools, and reliable support to make informed decisions.
Role of Regulations in Market Stability
Regulatory bodies like SEBI and RBI play a crucial role in maintaining transparency and stability in financial markets. Recent reforms have improved investor protection, reduced systemic risks, and enhanced trust in the Indian equity ecosystem.
Frequently Asked Questions
Is the current market rally sustainable
The rally looks strong, but short-term corrections are possible. Long-term sustainability depends on earnings growth and macroeconomic stability.
Which sector is leading the market right now
Banking and financial stocks are currently leading the rally, followed by IT.
Should I invest now or wait
Instead of timing the market, consider staggered investments through SIPs or phased buying.
What are the biggest risks in the market currently
Global uncertainties, inflation trends, and interest rate decisions are key risks to monitor.
How can beginners start investing in stocks
Beginners should start with research-backed platforms, diversify investments, and focus on long-term goals.
Conclusion
Today’s strong rally in the Indian stock market highlights renewed optimism among investors. While the trend remains positive, disciplined investing and risk management are essential in volatile conditions.
If you are looking to take advantage of market opportunities with expert guidance and reliable tools, you can explore investing with Swastika Investmart.

GR Infra Bags ₹2,440 Cr NHAI Project: Order Book Growth & Future Outlook
Quick Summary
- G R Infraprojects wins a ₹2,440 crore project from National Highways Authority of India
- Order book strength improves, boosting revenue visibility
- Execution timelines and margins will be key for profitability
- Positive long-term outlook driven by India’s infra push
A Big Win for GR Infra: What This ₹2,440 Cr Order Means
India’s infrastructure story continues to gain momentum, and the latest development reinforces this trend. GR Infra has secured a ₹2,440 crore highway project from NHAI, one of the country’s largest infrastructure awarding bodies.
This order is not just another contract. It significantly strengthens the company’s order book and provides long-term revenue visibility.
For investors, this kind of development often acts as a confidence booster because infrastructure companies rely heavily on a strong pipeline of projects to sustain growth.
Understanding the Project Details
The project awarded by NHAI typically involves:
- Construction and development of national highways
- Engineering, procurement, and construction responsibilities
- Defined timelines with milestone-based payments
Such projects are usually executed under EPC or HAM models, both of which have different risk and return profiles.
Why NHAI Projects Matter
NHAI is backed by the Government of India, which reduces counterparty risk. Payments are relatively secure, making these contracts attractive for infrastructure companies.
Additionally, India’s focus on road development under programs like Bharatmala has increased project flow for companies like GR Infra.
Impact on Order Book: A Key Growth Indicator
What Is an Order Book?
An order book represents the total value of projects a company has secured but not yet executed.
For GR Infra, this ₹2,440 crore order adds significant visibility to future revenues.
Why It Matters
- Ensures steady revenue flow over the next few years
- Improves investor confidence
- Supports valuation multiples
For example, if a company has an order book of 3 to 4 times its annual revenue, it indicates strong growth visibility.
With this new order, GR Infra’s order book is expected to remain robust, supporting its medium-term growth trajectory.
Revenue and Margin Outlook
Revenue Growth Potential
Infrastructure projects are typically executed over 2 to 3 years. This means:
- Revenue will be recognized gradually
- Growth will depend on execution speed
If GR Infra maintains strong execution efficiency, this project can contribute significantly to its top line.
Margin Considerations
Margins in infrastructure projects depend on:
- Input costs such as cement and steel
- Execution efficiency
- Project complexity
In recent years, companies have faced margin pressure due to rising commodity prices. However, efficient project management can help maintain healthy margins.
Real-World Context: India’s Infrastructure Boom
India is currently in the middle of a massive infrastructure expansion phase.
Government initiatives include:
- Bharatmala Pariyojana for highways
- Increased budget allocation for capital expenditure
- Focus on logistics and connectivity
This creates a favorable environment for companies like GR Infra.
For instance, over the past decade, India’s highway construction pace has increased significantly, creating consistent opportunities for EPC players.
Stock Market Reaction: What Should Investors Expect?
Short-Term Impact
In the short term, such order wins usually lead to positive sentiment in the stock.
However, the actual price movement depends on:
- Market conditions
- Broader indices trend
- Investor expectations
Long-Term Perspective
For long-term investors, the focus should be on:
- Order book growth
- Execution track record
- Balance sheet strength
GR Infra has historically demonstrated strong execution capabilities, which is a positive sign.
Competitive Landscape
GR Infra competes with companies like:
- L&T
- KNR Constructions
- Dilip Buildcon
While each company has its strengths, GR Infra stands out due to:
- Strong execution track record
- Healthy order book
- Focus on operational efficiency
That said, competition remains intense, and bidding discipline will be crucial.
Risks to Watch
Every infrastructure project comes with its own set of risks:
- Delays in project execution
- Cost overruns
- Changes in government policies
- Rising input costs
Investors should keep a close eye on quarterly updates to track progress.
Regulatory Framework and Industry Support
Infrastructure projects in India are governed by multiple regulatory bodies and frameworks:
- Ministry of Road Transport and Highways
- NHAI guidelines
- Environmental and land acquisition norms
The government’s continued focus on infrastructure spending provides long-term visibility for the sector.
How Swastika Investmart Helps You Track Such Opportunities
Tracking infrastructure stocks requires understanding both macro trends and company fundamentals.
With Swastika Investmart, you get:
- SEBI-registered research insights
- Detailed company analysis
- Advanced trading platforms
- Strong customer support and investor education
Whether you are investing in infra stocks or diversifying your portfolio, expert guidance can help you make informed decisions.
FAQs
1. What is the value of GR Infra’s new NHAI project?
The project is worth approximately ₹2,440 crore.
2. How does this order impact GR Infra’s growth?
It strengthens the order book and provides long-term revenue visibility.
3. What is an order book in infrastructure companies?
It represents the total value of secured but unexecuted projects.
4. Is this news positive for GR Infra stock?
Yes, it is generally seen as positive, but execution will determine actual benefits.
5. What risks should investors consider?
Key risks include project delays, cost overruns, and changes in input prices.
Conclusion
GR Infra’s ₹2,440 crore NHAI project win is a strong positive development that highlights the ongoing momentum in India’s infrastructure sector. A robust order book, coupled with efficient execution, can drive sustained growth for the company.
For investors, the key lies in tracking execution and margin trends over the coming quarters. While short-term market movements may vary, the long-term outlook remains promising.
With the right research partner like Swastika Investmart, you can stay ahead of such opportunities and build a well-informed investment strategy.

Tata Power’s Mundra Deal Explained: How New PPAs Can Boost Future Revenues
Quick Summary
- Tata Power is restructuring its Mundra plant through new Power Purchase Agreements
- Long-term PPAs can ensure stable cash flows and reduce earnings volatility
- The deal may significantly improve plant utilization and profitability
- Positive for long-term investors, but execution remains key
Understanding Tata Power’s Mundra Deal
The Mundra Ultra Mega Power Project has been a challenging asset for Tata Power for years. Located in Gujarat, this coal-based power plant faced significant issues due to rising imported coal costs and rigid tariff agreements.
Now, the company is working on fresh Power Purchase Agreements, commonly known as PPAs, to revive the plant’s financial viability.
So what exactly is changing?
Earlier, Tata Power was locked into fixed tariffs that did not account for fluctuations in coal prices. This created a mismatch between costs and revenues. With new PPAs, the company aims to introduce more flexible pricing structures, allowing better cost recovery.
What Are PPAs and Why Do They Matter?
A Power Purchase Agreement is a long-term contract between a power producer and a buyer, usually a state distribution company.
Key Features of PPAs
- Fixed or variable tariff structures
- Long-term revenue visibility
- Reduced market risk
- Assured offtake of electricity
For a project like Mundra, PPAs are critical because they determine whether the plant operates profitably or at a loss.
Think of it like a rental agreement. If your rent is fixed but your expenses keep rising, your profitability suffers. But if your rent adjusts with inflation, your financial stability improves.
Why Mundra Was Struggling Earlier
The Mundra plant primarily uses imported coal. Over the years, global coal prices have been highly volatile.
Major Challenges
- Rising international coal prices
- Fixed tariff agreements with no pass-through mechanism
- Legal disputes with state utilities
- Underutilization of plant capacity
At one point, the plant was operating at very low capacity because generating power was simply not viable.
This had a direct impact on Tata Power’s consolidated financials, dragging down profitability.
How New PPAs Can Boost Future Revenues
1. Better Cost Pass-Through
The new agreements are expected to include provisions where fuel cost increases can be passed on to buyers.
This means:
- Reduced margin pressure
- Improved earnings predictability
- Lower financial stress
2. Higher Plant Utilization
Once the plant becomes economically viable, utilization levels are likely to increase.
Higher utilization leads to:
- Increased power generation
- Higher revenue
- Better absorption of fixed costs
3. Stable Cash Flows
Long-term PPAs provide revenue visibility, which is crucial for capital-intensive sectors like power.
This stability can also improve the company’s credit profile and reduce borrowing costs.
Real-World Context: Why This Matters for India
India’s power demand is growing rapidly due to:
- Industrial expansion
- Rising urbanization
- Increased electrification
Coal-based plants still play a critical role in ensuring base load power supply, despite the push towards renewable energy.
The revival of Mundra aligns with India’s broader energy security goals.
Additionally, regulatory bodies like the Central Electricity Regulatory Commission and state regulators have been supportive of resolving legacy issues in power projects.
Stock Market Impact: What Should Investors Expect?
Short-Term Reaction
Markets usually respond positively to clarity.
The Mundra deal reduces uncertainty around a loss-making asset, which is a key positive trigger.
However, investors should watch:
- Final terms of PPAs
- Approval timelines
- Execution risks
Long-Term Outlook
For long-term investors, this development strengthens Tata Power’s overall business profile.
The company is already transitioning towards renewable energy, with significant investments in solar and EV infrastructure.
With Mundra potentially turning around, Tata Power gets the best of both worlds:
- Stable thermal power cash flows
- High-growth renewable business
Competitive Landscape
Other power companies like NTPC and Adani Power also operate in the thermal segment.
While each company has its own challenges and strengths, Tata Power’s diversified portfolio gives it an edge.
The Mundra resolution could further strengthen its position in the sector.
Risks Investors Should Keep in Mind
No investment is risk-free. Here are some factors to watch:
- Delays in regulatory approvals
- Discom payment issues
- Coal price volatility
- Policy changes in the power sector
A delay or unfavorable terms in PPAs could limit the expected benefits.
How Swastika Investmart Adds Value for Investors
Understanding complex developments like the Mundra deal requires deep research.
With Swastika Investmart, investors benefit from:
- SEBI-registered research insights
- Detailed sectoral analysis
- User-friendly trading platforms
- Strong customer support and educational resources
Whether you are tracking power stocks or building a diversified portfolio, having expert guidance can make a real difference.
FAQs
1. What is Tata Power’s Mundra deal?
It refers to new Power Purchase Agreements aimed at making the Mundra plant financially viable.
2. How will new PPAs benefit Tata Power?
They allow better cost recovery, improve margins, and ensure stable revenues.
3. Why was the Mundra plant unprofitable earlier?
Due to high imported coal costs and fixed tariffs that did not allow cost pass-through.
4. Is this deal positive for Tata Power stock?
Yes, it reduces uncertainty and improves long-term earnings visibility.
5. What should investors track next?
Watch for regulatory approvals, PPA terms, and quarterly financial performance.
Conclusion
Tata Power’s Mundra deal marks an important step in resolving a long-standing challenge. By restructuring PPAs, the company is moving towards a more sustainable and predictable revenue model.
For investors, this is a classic example of how regulatory support and strategic decisions can revive stressed assets.
While short-term uncertainties remain, the long-term outlook appears promising. Keeping a close eye on execution will be crucial.
With the right research partner like Swastika Investmart, you can stay ahead of such opportunities and make informed investment decisions.
Asian Paints Price Hike 2026: Impact on Margins, Demand & Stock Outlook
Quick Summary
- Asian Paints has implemented a price hike to offset rising raw material costs.
- Margins may improve in the short term, but demand sensitivity remains a key risk.
- Rural demand recovery and festive season trends will be crucial triggers.
- Stock outlook remains stable with long-term growth intact but near-term volatility possible.
Why Did Asian Paints Announce a Price Hike in 2026?
The Indian paint industry has been facing persistent cost pressures, mainly due to fluctuations in crude oil prices. Since most paint inputs are crude derivatives, companies like Asian Paints often adjust prices to protect profitability.
In 2026, rising global crude prices and supply chain disruptions forced the company to take a calibrated price hike. This is not unusual. Historically, Asian Paints has demonstrated strong pricing power, allowing it to pass on costs without significantly hurting demand.
A similar situation was seen in 2021–22 when raw material inflation surged sharply. Back then, the company increased prices multiple times to maintain margins.
Impact on Margins: Can Profitability Improve?
Short-Term Margin Boost
Price hikes directly support operating margins. When input costs rise faster than revenue, margins shrink. By increasing prices, Asian Paints aims to restore its EBITDA margins.
For example
If raw material costs rise by 10 percent and prices increase by 6 to 7 percent, margin pressure reduces significantly.
In FY25, Asian Paints reported margin compression due to volatile crude prices. The 2026 price hike is expected to stabilize margins in the coming quarters.
Risks to Watch
- If crude prices remain elevated, further hikes may be needed
- Competitive intensity may limit pricing flexibility
- Demand slowdown could offset margin gains
Demand Outlook: Will Consumers Accept Higher Prices?
Demand elasticity is the biggest concern after any price hike.
Urban vs Rural Demand
- Urban demand tends to be more resilient due to higher disposable income
- Rural demand is more price-sensitive and may see temporary slowdown
For instance, during previous price hikes, premium product demand remained stable, while entry-level products saw slower growth.
Seasonal Impact
The timing of the price hike is crucial. If implemented before festive seasons like Diwali, demand may remain strong due to:
- Home renovation trends
- Increased discretionary spending
- Real estate activity
However, if the macro environment weakens, demand could soften.
Competitive Landscape: How Are Rivals Positioned?
Asian Paints operates in a highly competitive market with players like:
- Berger Paints
- Kansai Nerolac
- New entrants such as Grasim Industries
While competitors may also raise prices, Asian Paints has a clear edge:
- Strong brand recall
- Wide distribution network
- Premium product positioning
That said, aggressive pricing by competitors could impact market share in the mass segment.
Stock Market Impact: Should Investors Be Concerned?
Short-Term View
In the near term, the stock may remain volatile due to:
- Demand uncertainty
- Global crude price trends
- Broader market sentiment
Markets typically react cautiously to price hikes because they signal cost pressures.
Long-Term Investment Case
Despite short-term challenges, Asian Paints remains a strong compounder due to:
- Consistent earnings growth
- Industry leadership
- Strong return ratios
For long-term investors, temporary corrections may present buying opportunities.
Real Market Example: How Price Hikes Affect Stocks
A useful example is the FMCG sector. Companies like Hindustan Unilever have historically increased prices during inflationary periods.
Initially, stocks may react negatively due to demand concerns. However, once margins stabilize, stocks tend to recover.
Asian Paints follows a similar pattern.
Regulatory & Economic Context in India
While there is no direct price control on paints in India, companies operate under:
- Competition Commission of India guidelines
- Consumer protection norms
- GST framework
Additionally, macroeconomic factors such as inflation and interest rates influence demand in sectors like housing and construction, indirectly impacting paint companies.
What Should Investors Do Now?
Investors should focus on three key triggers:
- Crude oil trend
- Demand recovery in rural markets
- Quarterly margin improvement
If these factors remain favorable, the long-term story of Asian Paints remains intact.
How Swastika Investmart Helps You Make Better Decisions
Navigating such market developments requires the right research and tools.
With Swastika Investmart, you get:
- SEBI-registered advisory support
- In-depth equity research reports
- Advanced trading platforms
- Strong customer support and investor education
Whether you are a beginner or an experienced investor, having access to reliable insights can make a big difference.
FAQs
1. Why did Asian Paints increase prices in 2026?
The price hike was mainly due to rising raw material costs linked to crude oil prices.
2. Will the price hike affect demand?
Yes, especially in rural markets, but urban demand is expected to remain stable.
3. Is Asian Paints stock still a good investment?
For long-term investors, the company remains fundamentally strong despite short-term volatility.
4. How do price hikes impact margins?
They help offset cost pressures and improve profitability if demand remains stable.
5. What should investors track next?
Keep an eye on crude prices, demand trends, and upcoming quarterly results.
Conclusion
The Asian Paints price hike in 2026 is a strategic move to protect margins in a challenging cost environment. While short-term demand risks exist, the company’s strong brand and pricing power provide a solid cushion.
For investors, the key lies in balancing short-term volatility with long-term growth potential. Staying informed and making data-driven decisions is crucial in such scenarios.
With the right partner like Swastika Investmart, you can navigate these market moves with confidence and clarity.

Should You Apply for Sai Parenteral IPO? Full Analysis & Verdict
Quick Summary
- Sai Parenteral IPO shows strong growth potential but comes with execution risks
- Margins and profitability trends will be key for long-term investors
- Suitable for investors with moderate to high risk appetite
- Not ideal for pure listing gain seekers
- Apply with a balanced allocation strategy
Introduction
The Indian IPO market continues to remain active, especially in the pharma and CDMO space. The Sai Parenteral IPO has attracted attention due to its niche positioning and growth prospects.
But the real question investors are asking is simple: Should you apply for Sai Parenteral IPO or stay cautious?
In this blog, we break down the company’s business model, financial performance, strengths, risks, and valuation to help you make an informed decision.
About Sai Parenteral
Sai Parenteral operates in the pharmaceutical manufacturing space, focusing on injectable formulations and contract manufacturing. The company benefits from increasing demand for specialized pharma products, both in domestic and export markets.
India’s pharma sector has been growing steadily due to global outsourcing trends, making companies like Sai Parenteral part of a larger structural opportunity.
IPO Details at a Glance
- Issue Type: Book Building IPO
- Industry: Pharma Manufacturing
- Use of Funds: Capacity expansion, debt reduction, and general corporate purposes
- Listing: NSE and BSE
Investors should always refer to the Red Herring Prospectus before applying, as mandated by SEBI regulations.
Business Model & Growth Drivers
Strong Industry Tailwinds
India is becoming a global hub for pharmaceutical manufacturing. Increasing exports, cost advantages, and regulatory approvals are driving growth.
Sai Parenteral operates in a segment that benefits from:
- Rising demand for injectables
- Growth in contract manufacturing
- Export opportunities in regulated markets
Expansion Plans
The company plans to utilize IPO proceeds for capacity expansion. This can help in scaling operations and improving revenue visibility over the next few years.
Financial Performance Analysis
A company’s financial health is critical before investing in any IPO.
Revenue Growth
Sai Parenteral has shown consistent revenue growth, indicating strong demand for its products. However, investors should check whether this growth is sustainable.
Profitability
Margins are a key factor in pharma companies. While growth is important, stable margins reflect operational efficiency.
Key Insight
If revenue grows but profits do not improve proportionately, it may indicate rising costs or pricing pressure.
Strengths of Sai Parenteral IPO
1. Growing Pharma Sector
The company operates in a high-growth industry supported by global demand.
2. Export Opportunities
Export-driven growth can significantly boost revenues and margins.
3. Scalable Business Model
Capacity expansion plans can improve long-term earnings potential.
Risks You Should Not Ignore
1. Regulatory Risks
Pharma companies are highly regulated. Any compliance issue can impact operations.
2. Margin Pressure
Rising raw material costs or pricing pressure can affect profitability.
3. Competition
The pharma manufacturing space is competitive, with many established players.
4. Execution Risk
Expansion plans need to be executed efficiently to generate returns.
Valuation & Market Sentiment
Valuation plays a crucial role in IPO investment decisions. Even a good company can deliver poor returns if it is overpriced.
Investors should compare the company’s valuation with listed peers in the pharma and CDMO space.
Market sentiment, grey market premium trends, and overall IPO environment also influence listing performance.
Real-World Context
In recent years, several pharma IPOs have delivered mixed results. Some companies performed well due to strong fundamentals, while others struggled due to overvaluation or weak margins.
This highlights an important lesson: Not every IPO guarantees quick gains.
Final Verdict: Should You Apply?
Sai Parenteral IPO appears to be a decent long-term opportunity with moderate risk.
- Long-term investors may consider applying with a selective approach
- Short-term listing gain seekers should remain cautious
- Portfolio diversification is important before taking exposure
👉 Overall View: Apply with caution and limited allocation
FAQs
1. Is Sai Parenteral IPO good for listing gains?
Not necessarily. Listing gains depend on market sentiment and valuation.
2. Who should invest in this IPO?
Investors with moderate to high risk appetite and long-term horizon.
3. What are the key risks?
Regulatory issues, margin pressure, and execution risks.
4. Is the pharma sector a good investment theme?
Yes, India’s pharma sector has strong long-term growth potential.
Conclusion
Sai Parenteral IPO offers exposure to India’s growing pharmaceutical manufacturing sector. While the opportunity looks promising, investors should carefully evaluate risks and valuation before applying.
A disciplined approach with proper research is always better than blindly chasing IPO trends.
If you’re looking for expert-backed IPO insights, advanced research tools, and a seamless investing experience, Swastika Investmart can help you make smarter investment decisions.
Stock Market Midday Live Updates 24 March 2026: Indian Stock Market Rally Nifty, Sensex, and Bank Nifty Surge
The Indian stock market rally today has caught investor attention as benchmark indices like the Nifty 50 and BSE Sensex posted strong gains. With banking and IT stocks leading the momentum, the broader market sentiment appears bullish. But what is driving this surge, and how should investors approach it?
Key Takeaways
- Benchmark indices surged over 2 percent, signaling strong bullish sentiment
- Banking and IT sectors led the rally with robust gains
- Positive global cues and FII inflows supported the uptrend
- Investors should remain cautious of short-term volatility
What’s Driving the Indian Stock Market Rally?
Strong Performance Across Key Indices
The rally was broad-based, with all major indices closing in the green. The Nifty Bank outperformed with gains above 2.5 percent, reflecting strong buying in financial stocks. Similarly, the Nifty IT index also saw notable gains, supported by improved global tech sentiment.
This synchronized movement across sectors often indicates institutional participation, which tends to sustain market trends for longer periods.
Global Cues and Liquidity Boost
Global market stability has played a key role in boosting investor confidence. Positive signals from US and Asian markets have encouraged Foreign Institutional Investors to increase exposure to Indian equities.
Additionally, liquidity conditions remain favorable due to accommodative monetary policies. While the Reserve Bank of India has maintained a cautious stance on inflation, its policies continue to support market growth indirectly.
Sectoral Rotation and Banking Strength
The banking sector remains the backbone of the current rally. Large-cap banks are witnessing steady credit growth and improving asset quality. This aligns with regulatory oversight by the Securities and Exchange Board of India, which has strengthened investor confidence through improved transparency norms.
Sectoral rotation is also visible, with investors shifting from defensive stocks to growth-oriented sectors like IT and financials.
Should Investors Chase the Rally?
Short-Term Momentum vs Long-Term Strategy
While the current rally looks promising, chasing momentum blindly can be risky. Markets often experience pullbacks after sharp gains. A disciplined approach is essential.
Investors should focus on fundamentally strong stocks rather than short-term price movements. Diversification across sectors can help mitigate risks.
Importance of Risk Management
Risk management becomes crucial during such rallies. Setting stop-loss levels and avoiding over-leveraging are key practices. Retail investors should also avoid herd mentality and make decisions based on research.
Platforms like Swastika Investmart provide access to advanced research tools and insights, helping investors make informed decisions rather than emotional ones.
Role of Retail Investors
Retail participation has increased significantly in recent years. While this adds liquidity, it also increases volatility. Investor education is essential to navigate such market conditions effectively.
Swastika Investmart emphasizes investor awareness through educational resources, ensuring clients understand market dynamics before making investment choices.
Indian Market Outlook: What Lies Ahead?
Key Factors to Watch
- Inflation trends and RBI policy decisions
- Global economic indicators and interest rates
- Corporate earnings growth in upcoming quarters
- Continued FII and DII activity
If these factors remain favorable, the rally could sustain. However, any negative trigger may lead to short-term corrections.
Expert Insight
Historically, Indian markets have shown resilience during global uncertainties. Long-term investors who stay invested during volatility often benefit from compounding returns.
The current rally reflects strong economic fundamentals, but disciplined investing remains the key to success.
FAQs
1. Why is the Indian stock market rising today?
The rally is driven by strong global cues, FII inflows, and sectoral gains in banking and IT stocks.
2. Is it a good time to invest in the stock market?
It depends on your investment horizon. Long-term investors can consider staggered investments rather than lump sum entries.
3. Which sectors are leading the rally?
Banking and IT sectors are currently leading, supported by strong fundamentals and global demand.
4. What risks should investors consider?
Short-term volatility, global economic uncertainties, and interest rate changes are key risks to watch.
5. How can beginners start investing?
Beginners should start with research-backed platforms, diversify investments, and focus on long-term goals.
Conclusion
The Indian stock market rally today highlights strong investor confidence and favorable macroeconomic conditions. While the momentum is encouraging, a balanced approach with proper risk management is essential.
For those looking to navigate the markets with expert guidance and robust tools, exploring platforms like Swastika Investmart can be a smart step. Start your investing journey.
Market Opening Updates for Today 24 March 2026: Nifty 50, Sensex, Bank Nifty and IT Stocks Bulls Take Charge What Next
The Indian stock market kicked off the week on a strong note, with benchmark indices showing solid momentum. The market setup India 24 March 2026 reflects bullish sentiment backed by strong buying across sectors like banking, IT, and large caps. With indices gaining over 1 to 2 percent, traders and investors are now asking a key question: is this rally sustainable or just a short-term bounce?
Key Takeaways
- Strong bullish momentum across Nifty, Sensex, and Bank Nifty
- Banking and IT sectors leading the rally
- Positive global cues supporting domestic markets
- Key resistance levels approaching, caution near highs
- Stock-specific opportunities likely in the near term
Market Overview: Strong Start to the Week
The broader market sentiment remains upbeat. Nifty 50 closed near 22,878 levels with gains of over 1.6 percent, while Sensex surged more than 2 percent. Bank Nifty also saw sharp buying interest, rising close to 52,400 levels.
This rally is supported by a combination of domestic liquidity and positive global cues. Institutional participation, especially from DIIs, has remained strong, balancing intermittent FII outflows.
Sectoral Performance
Banking stocks led the rally, indicating confidence in economic growth and credit expansion. IT stocks also performed well, likely driven by expectations of stable global demand and easing recession fears in the US.
Other sectors like auto and FMCG showed steady performance, adding stability to the broader market.
Technical Outlook: Key Levels to Watch
Nifty 50 Outlook
Nifty has crossed important short-term resistance levels and is now heading towards the psychological mark of 23,000.
- Immediate Support: 22,600
- Strong Support: 22,300
- Immediate Resistance: 23,000
- Next Resistance: 23,200
A sustained move above 23,000 could trigger fresh buying, while any rejection may lead to profit booking.
Bank Nifty Outlook
Bank Nifty remains the strongest index in the current setup.
- Support Zone: 51,500
- Resistance Zone: 53,000
If Bank Nifty holds above 52,000, bullish momentum is likely to continue. However, traders should stay cautious near resistance levels.
What’s Driving the Market?
1. Global Market Stability
US and Asian markets have shown signs of stability, reducing volatility and supporting risk-on sentiment.
2. Domestic Liquidity
Strong participation from domestic institutional investors is acting as a cushion against global uncertainties.
3. Economic Indicators
India’s macroeconomic fundamentals remain strong, supported by steady GDP growth and controlled inflation under the watch of the RBI.
4. Regulatory Confidence
The presence of strict oversight by the Securities and Exchange Board of India ensures transparency and boosts investor confidence in the market.
Trading Strategy for 24 March 2026
For Intraday Traders
- Focus on momentum stocks in banking and IT
- Use tight stop losses as volatility may increase near resistance
- Avoid chasing stocks at higher levels
For Swing Traders
- Look for breakout confirmation above key resistance levels
- Accumulate quality stocks on dips
- Focus on sectors showing relative strength
For Long-Term Investors
- Continue systematic investments
- Focus on fundamentally strong companies
- Avoid reacting to short-term volatility
Practical Insight: How Smart Investors Are Positioning
Experienced investors are not blindly chasing rallies. Instead, they are:
- Booking partial profits near resistance
- Rotating capital into underperforming sectors
- Maintaining disciplined asset allocation
This approach helps in managing risk while still participating in market upside.
Role of Technology and Research in Trading
In today’s fast-moving markets, having access to reliable research and a robust trading platform is essential. Platforms like Swastika Investmart provide:
- SEBI-registered brokerage services ensuring compliance and trust
- Advanced research tools and insights for better decision-making
- A tech-enabled platform for seamless trading experience
- Strong customer support for investors at every stage
Their focus on investor education also helps traders understand market dynamics better, which is crucial in volatile conditions.
FAQs
What is the outlook for Nifty on 24 March 2026?
The outlook remains bullish with resistance near 23,000. A breakout above this level may lead to further upside.
Which sectors are leading the market currently?
Banking and IT sectors are leading, supported by strong buying interest and positive global cues.
Is it a good time to invest in the market?
Long-term investors can continue investing systematically, while short-term traders should wait for clear breakout confirmations.
What are the key risks in the current market setup?
Profit booking near resistance levels and global market volatility are the main risks.
How can beginners start trading safely?
Beginners should start with small capital, use stop losses, and rely on research-backed platforms for guidance.
Conclusion
The market setup India 24 March 2026 indicates strong bullish momentum, but caution is warranted near key resistance levels. While the trend remains positive, disciplined trading and smart risk management are essential.
For investors looking to navigate the market with confidence, having the right tools and guidance can make all the difference. You can explore a reliable and research-driven trading experience.
Stay informed, stay disciplined, and let the market work in your favor.
Stocks in News Today 24 March 2026: Motherson, Wipro, PVR INOX, GR Infra Ltd Key Market Movers
Staying updated with stocks in news is essential for every market participant, especially in a dynamic environment like India’s equity markets. On 24 March 2026, several companies made headlines with strategic expansions, project wins, and capacity additions. These developments can influence short-term price movements as well as long-term investor sentiment.
Let’s break down the key updates and what they could mean for investors.
Key Takeaways
- Motherson expands into renewable energy via a strategic stake acquisition
- Wipro strengthens global presence with South Korea expansion
- PVR INOX continues aggressive screen expansion in India
- GR Infra secures a major highway project from National Highways Authority of India
- Infrastructure and green energy themes remain strong in Indian markets
Motherson’s Strategic Move into Renewable Energy
Motherson announced that it, along with its subsidiaries, will acquire a 28.15 percent stake in HRDPL, a special purpose vehicle set up by Hinduja Renewables Energy.
Why This Matters
This move signals diversification beyond traditional auto components into renewable energy. As India pushes toward its net-zero targets, companies aligning with green energy could benefit from favorable government policies and long-term growth visibility.
Investor Insight
Investors often reward companies that proactively diversify into future-ready sectors. However, execution and returns on such investments remain key factors to monitor.
Wipro Expands Footprint in South Korea
Wipro has announced the expansion of its business operations in South Korea, reinforcing its global delivery capabilities.
Strategic Implications
South Korea is a technology-driven economy with strong demand for digital transformation services. This expansion could help Wipro tap into high-value enterprise clients and diversify its revenue base.
Market Perspective
In the IT sector, geographic expansion often translates into better deal pipelines. With global IT spending expected to remain resilient, such moves can strengthen long-term earnings visibility.
PVR INOX Strengthens Its Market Leadership
PVR INOX has opened a new 3-screen multiplex in New Delhi. With this addition, the company now operates 1,802 screens, making it the largest multiplex network in India.
Growth Strategy
The company continues to focus on expanding its footprint in urban and semi-urban areas. This aligns with rising disposable incomes and increasing demand for premium entertainment experiences.
What Investors Should Watch
- Occupancy rates post-expansion
- Content pipeline and box office performance
- Impact of OTT competition
Despite competition from streaming platforms, theatrical releases in India continue to draw strong footfall for major films.
GR Infra Wins Major Highway Project
GR Infra has received a Letter of Award worth ₹2,440.87 crore from the National Highways Authority of India for a highway project in Bihar.
Sector Outlook
Infrastructure remains a key focus area for the Indian government, supported by increased budget allocations and policy support from regulators like the RBI and execution frameworks under ministries.
Investment Angle
Order inflows are a critical metric for infrastructure companies. A strong order book ensures revenue visibility and improves investor confidence.
Broader Market Trends to Watch
The updates from today’s stocks in news highlight three major themes shaping Indian markets:
1. Green Energy Transition
Companies like Motherson entering renewables reflect a broader shift toward sustainability. Government incentives and ESG-focused investing are accelerating this trend.
2. Global Expansion by Indian Firms
Wipro’s move shows how Indian companies are strengthening their global presence, which can reduce dependence on domestic demand cycles.
3. Infrastructure Push
Large-scale projects awarded by NHAI indicate continued government spending, which can boost GDP growth and create multiplier effects across sectors.
How Investors Can Use Stocks in News
Tracking stocks in news is not just about reacting to headlines. It’s about understanding the bigger picture.
- Identify sectoral trends early
- Evaluate whether news is short-term or structural
- Avoid impulsive decisions based on headlines alone
- Cross-check company fundamentals and valuations
Regulatory bodies like SEBI emphasize informed investing, and staying updated with credible news sources plays a crucial role in that process.
The Role of a Reliable Investment Platform
Navigating daily market updates requires not just information but also the right tools. Platforms like Swastika Investmart offer:
- SEBI-registered brokerage services
- Research-backed insights and advisory tools
- A tech-enabled platform for seamless trading
- Strong focus on investor education and awareness
This combination helps investors make more informed decisions rather than reacting emotionally to market noise.
Frequently Asked Questions
What are stocks in news?
Stocks in news refer to companies that have recently made headlines due to announcements, deals, expansions, or regulatory developments that may impact their stock prices.
Should I buy stocks based on news updates?
Not necessarily. News should be a starting point for research. Always evaluate fundamentals, valuations, and long-term prospects before investing.
How does infrastructure news impact markets?
Infrastructure projects boost economic activity, create jobs, and improve corporate earnings visibility, which can positively impact related stocks.
Why is global expansion important for IT companies?
It helps diversify revenue streams, reduce risk from regional slowdowns, and tap into new growth opportunities.
Are renewable energy investments a good sign for companies?
Yes, in many cases. It shows alignment with future trends, but investors should assess execution capability and return on investment.
Final Thoughts
The stocks in news for 24 March 2026 highlight how Indian companies are evolving through diversification, expansion, and strategic wins. From renewable energy to infrastructure and global IT services, the market continues to offer diverse opportunities.
For investors, the key lies in filtering noise from meaningful signals and aligning investments with long-term goals.
If you want to stay ahead with actionable insights and a reliable trading experience, explore opportunities with Swastika Investmart.
Share Market Setup Today 24 March 2026: Nifty50, Sensex, BankNifty Key Support, Resistance, FII Data, Global Cues & Trading Strategy
Understanding the market setup today is crucial for traders and investors looking to stay ahead in the fast-moving Indian stock market. With mixed global cues, shifting FII activity, and key technical levels in focus, 24 March 2026 presents both opportunities and risks. Here’s a complete breakdown to help you trade smarter.
Quick Takeaways
- Global markets are mixed with US strength but weak Asian sentiment
- FIIs show mixed to negative positioning in derivatives
- Nifty faces resistance near 23000 while support lies around 22470
- Bank Nifty remains range-bound with key breakout above 53500
- Volatility remains elevated, demanding cautious trading
Global Market Overview
The global backdrop remains slightly uncertain. US markets closed strong, with the Dow Jones gaining over 600 points, reflecting optimism in the world’s largest economy. However, futures are indicating a mild pullback, suggesting profit booking.
Asian markets are trading on a weaker note, which often impacts early sentiment in Indian equities. Despite this, GIFT Nifty is indicating a positive opening, hinting at resilience in domestic markets.
For Indian traders, this mixed setup means intraday volatility could be high, especially during the opening session.
FII and DII Activity Analysis
Institutional flows continue to play a critical role in market direction.
- Foreign Institutional Investors showed a net buying figure but with mixed derivative positioning
- Domestic Institutional Investors remained strong buyers, providing stability
In the derivatives segment:
- Significant Call writing indicates resistance zones ahead
- Put additions suggest some downside protection but not aggressive bullishness
The PCR ratio stands below 1, indicating cautious sentiment among traders. Additionally, India VIX has surged over 17 percent, reflecting rising volatility expectations.
As per SEBI-regulated market structure, such derivative positioning often signals consolidation rather than a strong directional move.
Understanding F&O Data Signals
A deeper look at futures and options data reveals:
- Increase in Call short positions suggests resistance overhead
- Strong Put writing at lower levels indicates support zones
- Mixed futures positioning reflects indecision among institutional traders
This kind of setup usually results in range-bound markets unless a strong trigger emerges, such as macroeconomic data or global cues.
Nifty Technical Outlook
The Nifty index is currently trading in a critical zone after a recent gap-up move.
Key Levels to Watch
- Resistance zone: 22800 to 23000
- Immediate support: 22650
- Strong support: 22470
A decisive move above 23000 could trigger short covering, pushing the index higher. However, failure to sustain above resistance may lead to sideways or corrective movement.
For traders, this means waiting for confirmation before taking aggressive positions. Risk management is essential in such setups.
Bank Nifty Technical Outlook
Bank Nifty continues to show relative strength but remains within a defined range.
Key Levels to Watch
- Resistance zone: 52500 to 53500
- Immediate support: 52000
- Strong support: 51000
A breakout above 53500 could lead to a sharp rally driven by short covering. On the downside, a breach below 52000 may increase selling pressure.
Banking stocks often react to RBI policy expectations and liquidity trends, making them sensitive to macroeconomic signals.
What This Means for Traders
Given the current market setup today, traders should focus on:
- Range trading strategies unless a breakout occurs
- Monitoring global cues closely during market hours
- Keeping an eye on volatility levels through India VIX
- Avoiding over-leveraging in uncertain conditions
Investors should remain selective and focus on fundamentally strong stocks rather than chasing momentum.
How Smart Platforms Add an Edge
In such complex market conditions, having access to reliable research and tools makes a big difference. Platforms like Swastika Investmart offer:
- SEBI-registered credibility ensuring compliance and trust
- Advanced research insights for informed decision-making
- User-friendly trading platforms with real-time data
- Strong focus on investor education
This combination helps both beginners and experienced traders navigate volatile markets more effectively.
FAQs
What is the market setup today for Nifty?
Nifty is facing resistance near 23000 with support around 22470, indicating a range-bound outlook unless a breakout occurs.
Why is India VIX rising?
India VIX rises when traders expect higher volatility, often due to global uncertainty or major upcoming events.
What does PCR below 1 indicate?
A PCR below 1 suggests bearish or cautious sentiment, as more Call options are being written compared to Put options.
Is it a good time to trade Bank Nifty?
Yes, but with caution. Bank Nifty is range-bound, so traders should focus on breakout or support-based strategies.
How do FIIs impact the market?
FIIs influence market direction through large capital flows. Their buying supports markets, while selling creates pressure.
Final Thoughts
The market setup today reflects a cautious yet opportunity-filled environment. With mixed global signals, rising volatility, and key resistance levels ahead, traders need to stay disciplined and data-driven.
Instead of chasing quick gains, focus on structured strategies, proper risk management, and reliable insights. If you are looking to enhance your trading experience with expert research and a robust platform, explore what Swastika Investmart has to offer.

.avif)
.avif)

.avif)