
Learning


Why traders trust Algo Trading?
.webp)

Introduction
In today's fast-paced financial markets, traders rely on algo trading to gain a competitive edge. But why do traders trust so much? The answer lies in its accuracy, speed, and data-driven approach. Let's explore the key reasons why professional and retail traders prefer automated trading systems over manual trading.
1. Speed and Efficiency
Markets move in milliseconds, and human traders can't react as fast as computers. Algo trading software executes trades in microseconds, ensuring traders never miss profitable opportunities. Whether it's high-frequency trading (HFT) or scalping strategies, automation gives traders a distinct advantage.
2. Eliminates Emotional Trading
One of the biggest reasons traders lose money is due to fear and greed. Algorithmic trading bots remove emotions from the equation, following predefined trading strategies without hesitation. This results in disciplined and consistent execution, reducing impulsive decisions.
3. Backtesting for Better Strategies
Traders trust algo trading systems because they can test strategies on historical stock market data before deploying them live. Backtesting in algo trading helps identify profitable patterns, refine entry/exit points, and optimize risk management.
4. Higher Accuracy and Precision
Manual trading is prone to human errors, such as incorrect order placement or mistimed entries. Automated trading systems ensure high accuracy in trade execution, reducing costly mistakes. Precision matters, especially in options trading, forex trading, and intraday trading.
5. Ability to Handle Large Trade Volumes
Institutional investors, hedge funds, and even retail traders trust algorithmic trading software because it can process massive trade volumes seamlessly. Unlike manual traders, who might struggle with multiple trades, algo trading bots can manage thousands of orders at once.
6. Customization and Scalability
Another reason traders trust automated trading platforms is their ability to be customized. Traders can code their trading strategies using Python for algo trading, adjust risk parameters, and scale their operations based on market conditions.
7. Regulatory Support and Transparency
In India, SEBI regulates algorithmic trading, ensuring fair practices. Many stock brokers offer algo trading APIs, allowing traders to build their custom trading algorithms while staying compliant with regulations.
8. 24/7 Market Monitoring
Unlike human traders, who need rest, algo trading systems can monitor global markets 24/7. This is especially useful in cryptocurrency trading, where markets never close.
9. Cost-Effective Trading
Though setting up algorithmic trading software requires an initial investment, it eventually reduces transaction costs by executing orders at optimal prices. Low-latency trading algorithms ensure minimal slippage and better returns.
Conclusion
Traders trust algo trading because it offers speed, precision, automation, and efficiency—all crucial for success in today’s markets. Whether you're a retail trader, institutional investor, or day trader, embracing automated trading strategies can significantly enhance your trading performance. If you haven’t explored algorithmic trading yet, now is the perfect time to start!
Start Algo Trading Now!

SEBI Banning Algo Trading? Everything You Need to Know
Algo trading in India has been a topic of intense discussion among traders and investors. Recently, there have been rumors about the SEBI ban on algo trading, causing confusion and concern. But is SEBI banning algo trading completely? Let’s dive into the details and clear up the misconceptions.
SEBI’s New Regulatory Framework for Algo Trading
SEBI has introduced a comprehensive regulatory framework for algorithmic trading (algo trading) in India, allowing retail investors to participate, but with enhanced oversight and stricter rules for brokers and algo trading providers. The framework includes unique identifiers for orders and registration requirements to ensure transparency and fair market practices.
Key Measures Introduced by SEBI:
1. Retail Investor Participation
SEBI has now opened the doors for retail investors in algo trading, a space previously dominated by institutional investors. However, retail participants must adhere to SEBI’s compliance requirements and execute trades through registered stockbrokers offering algo trading.
2. Unique Identifiers for Algo Orders
To enhance transparency, SEBI has mandated unique identification numbers for all algo trade orders. This helps track the origin of each trade and prevents market manipulation through automated strategies.
3. Stricter Broker Compliance
Stock brokers offering algo trading services must now register and get approval for their algorithmic trading strategies. Additionally, brokers must ensure that their clients are aware of the risks associated with high-frequency trading (HFT).
4. Approval for Third-Party Algo Platforms
Third-party algo trading platforms in India must now comply with SEBI’s strict regulations. Platforms providing algorithmic trading software need to register with the regulator and ensure their strategies are pre-approved before execution.
Why is SEBI Introducing These Regulations?
SEBI has raised concerns about unregulated algo trading due to the following reasons:
Market Volatility – Unchecked algo trading can trigger large fluctuations in stock prices.
Unfair Advantage – Traders with access to sophisticated algo trading software can gain an unfair edge over manual traders.
Flash Crashes – High-frequency trading (HFT) has been linked to sudden market crashes due to automated sell-offs.
How Will These Regulations Affect Traders?
If you are using algo trading software in India, here’s how these regulations might impact you:
- Retail traders can now participate in SEBI-compliant algo trading, but they need broker approval.
- Brokers offering algo trading services must ensure regulatory compliance.
- Third-party algo providers need SEBI approval before offering their services.
What Should Algo Traders Do Now?
If you are engaged in algo trading in NSE and BSE, here are some steps you should take:
- Stay updated on SEBI’s latest algo trading guidelines.
- Use SEBI-approved algorithmic trading strategies.
- Choose a registered broker with SEBI-compliant algo trading services.
Conclusion
While SEBI is not imposing a complete ban on algo trading in India, it is making efforts to regulate automated trading and ensure fair market participation. Traders should be aware of the new guidelines and adapt accordingly to continue using algorithmic trading in India without any legal issues.
Happy Trading!
.avif)
Delisting of Shares and Its Impact on Shareholders
Introduction
Delisting occurs when a company's shares are removed from a stock exchange and are no longer traded publicly. This can be a significant event for investors and can happen for various reasons, such as regulatory issues, financial troubles, or strategic decisions by the company.
What is Delisting?
·Delisting refers to the removal of a company's shares from a stock exchange. Once delisted, the shares are no longer available for trading on that exchange. Delisting can be categorized into two types:
· Voluntary Delisting: The Company chooses to delist its shares, often to go private or restructure. For example, a company might opt to delist to focus on its core operations or restructure its business model.
·Involuntary Delisting: The Company is removed from the exchange due to failure to meet listing requirements, such as financial standards or regulatory compliance. This can happen if a company consistently fails to meet the exchange's criteria for listing.
Reasons for Delisting
·Financial Troubles: Companies facing severe financial difficulties may be delisted if they cannot meet exchange requirements. For instance, if a company consistently reports losses and fails to turn around its financial situation, it may face delisting.
·Regulatory Issues: Non-compliance with exchange rules or regulations can lead to involuntary delisting. If a company does not adhere to regulatory requirements, it risks being removed from the exchange.
·Strategic Decisions: Companies may choose to delist to restructure or go private for strategic reasons. This might involve a strategic overhaul or a shift in focus away from public markets.
·Mergers and Acquisitions: A company may be delisted following a merger or acquisition if it is absorbed into another entity. For example, if Company A acquires Company B, Company B’s shares might be delisted as they are absorbed into Company A.
Impact on Shareholders
·The impact of delisting on shareholders can vary based on whether the delisting is voluntary or involuntary:
·Liquidity: Shareholders may find it challenging to sell their shares as they are no longer traded on the exchange. For example, if a stock like Jet Airways is delisted, finding buyers for its shares can become difficult.
·Value of Shares: The value of delisted shares may drop, especially if the delisting is due to financial issues. This can result in significant losses for shareholders.
·Alternative Trading Venues: After delisting, shares may trade on over-the-counter (OTC) markets, which often have lower liquidity and might not reflect the true value of the shares.
·Compensation: In voluntary delisting, companies may offer compensation or buyback options for their shares. Shareholders might receive a buyout offer, providing them with an option to sell their shares at a predetermined price.
·Investment Strategy: Shareholders need to adjust their investment strategy and may consider seeking legal or financial advice to navigate the changes and mitigate losses.
Let us understand this with an example Suppose a company like Sahara India is delisted due to financial troubles. Shareholders might experience a sharp decline in share value and face difficulties finding buyers. If Sahara India had planned a voluntary delisting to go private, shareholders might receive a buyout offer, providing them with an option to sell their shares at a predetermined price.
Did you know that Suzlon Energy, a major player in the renewable energy sector, was delisted from the Bombay Stock Exchange (BSE) in 2021 due to non-compliance with financial requirements? This delisting was a significant event, impacting many investors and highlighting the importance of financial health in maintaining a public listing.
Conclusion
Delisting of shares can have significant consequences for shareholders, ranging from reduced liquidity to potential loss in value. It's essential for investors to stay informed about the reasons behind the delisting and how it may affect their investments.
Learn more about stock market and its terminologies with Swastika!
.avif)
Understanding Bond ETFs
Introduction
Welcome! Today, we’ll explore Bond ETFs—an investment option that combines the stability of bonds with the flexibility of exchange-traded funds (ETFs). Bond ETFs are increasingly popular among investors looking for a blend of steady income and trading flexibility. Let’s break down what Bond ETFs are, how they work, and why they might be a good fit for your investment strategy.
What are Bond ETFs?
Bond ETFs are exchange-traded funds that invest primarily in bonds. These funds are traded on stock exchanges just like individual stocks and hold a diversified portfolio of bonds. Bond ETFs offer exposure to fixed income securities while providing the benefits of trading flexibility and diversification.
Why Invest in Bond ETFs?
- Diversification: Bond ETFs usually hold a variety of bonds from different issuers and sectors. This diversification helps spread risk and reduces the impact of any single bond defaulting.
- Liquidity: Unlike individual bonds, which might be difficult to buy or sell in large quantities, Bond ETFs can be traded on stock exchanges throughout the trading day. This liquidity provides investors with greater flexibility.
- Cost-Effective: Bond ETFs often have lower expense ratios compared to actively managed bond funds, making them a cost-effective choice for fixed-income investors.
- Transparency: Bond ETFs regularly disclose their holdings, allowing investors to see exactly which bonds are in the portfolio and assess their risk.
How Do Bond ETFs Work?
- Portfolio Composition: A Bond ETF holds a collection of bonds, which might include government bonds, corporate bonds, municipal bonds, or a mix. The ETF manager selects these bonds based on the fund’s investment strategy.
- Trading: Bond ETFs are traded on stock exchanges, so you can buy or sell shares of the ETF just like stocks. The price of the ETF fluctuates throughout the day based on the value of its underlying bonds.
- Distributions: Bond ETFs pay out income from the bonds they hold to investors in the form of dividends, typically on a monthly or quarterly basis.
Benefits of Bond ETFs
- Diversification: By holding a variety of bonds, Bond ETFs help diversify your fixed-income investments and reduce individual bond risk.
- Accessibility: Bond ETFs provide easy access to a broad range of bonds without needing to buy individual bonds directly.
- Flexibility: The ability to trade Bond ETFs throughout the day offers greater flexibility compared to traditional bond investments.
- Transparency and Low Costs: Regular disclosure of holdings and typically lower expense ratios make Bond ETFs an attractive option for cost-conscious investors.
Examples of Bond ETFs in India
- Nippon India ETF – Nifty 10 Year Gilt: This ETF invests in Indian government securities with a maturity of around 10 years. It provides exposure to long-term Indian government bonds, offering stability and low risk.
- ICICI Prudential Corporate Bond Fund – Direct Plan – Growth: This fund focuses on high-quality corporate bonds. It provides exposure to a diversified portfolio of corporate debt, which can offer higher yields compared to government bonds.
- HDFC Bond Fund: A well-known Bond ETF in India, it invests in a mix of government and corporate bonds. This fund offers diversified fixed-income exposure and aims to provide steady returns.
Risks and Considerations
- Interest Rate Risk: Bond ETFs are sensitive to interest rate changes. When interest rates rise, the value of the bonds in the ETF may fall.
- Credit Risk: If a bond issuer within the ETF defaults, it can impact the ETF’s performance. While diversification helps mitigate this risk, it doesn’t eliminate it entirely.
- Market Risk: The price of Bond ETFs can fluctuate based on market conditions and may not always trade at their net asset value (NAV).
Conclusion
Bond ETFs offer a convenient and cost-effective way to invest in bonds while benefiting from the liquidity and flexibility of the stock market. They provide diversification, transparency, and regular income, making them an appealing choice for many investors. However, it’s essential to be aware of the risks, such as interest rate and credit risk, and consider how they fit into your overall investment strategy.
Learn More about stock exchanges and its terminologies with Swastika
.avif)
Understanding Value Stocks
Introduction
Today, we’re diving into the world of value stocks—a fascinating area of investing that can offer great opportunities. But what exactly are value stocks? Simply put, value stocks are shares of companies that appear to be undervalued relative to their true worth. This means they might be trading at a lower price compared to their intrinsic value, presenting a potential investment opportunity.
Characteristics of Value Stocks
- Low Price-to-Earnings (P/E) Ratio: One key characteristic of value stocks is their lower P/E ratio. This ratio compares a company’s current share price to its earnings per share (EPS). A lower P/E ratio often suggests that the stock is undervalued compared to its industry peers.
- High Dividend Yields: Value stocks often offer higher dividend yields. This means that in addition to potential capital gains, investors receive regular income from dividends.
- Strong Fundamentals: These stocks are typically from companies with solid financials. This includes strong earnings, good revenue growth, and a healthy balance sheet.
How to Identify Value Stocks
- Financial Metrics: When looking for value stocks, pay attention to key metrics such as a low P/E ratio, low price-to-book (P/B) ratio, and high dividend yield. These indicators can help you identify stocks that might be undervalued.
- Company Analysis: It’s essential to analyze the company’s overall financial health. This involves looking at earnings reports, understanding management quality, and evaluating the company’s position in its industry.
Benefits of Investing in Value Stocks
- Potential for Capital Appreciation: If the market eventually recognizes the true value of these stocks, there could be significant price increases, leading to potential capital gains for investors.
- Income Generation: High dividend yields provide a steady income stream, which can be particularly appealing for income-focused investors.
Risks Involved
- Market Timing: Value stocks might remain undervalued for extended periods. Patience is crucial, as the market may take time to realize the stock’s true value.
- Company-Specific Risks: There might be underlying issues with the company’s business model or market position that can affect its performance. Always perform thorough research to understand these risks.
Examples of Value Stocks in India
- Tata Steel: Tata Steel is often considered a value stock due to its low P/E ratio compared to industry peers. Despite market fluctuations, it has a strong financial base and offers attractive dividend yields.
- ITC Limited: ITC is another example of a value stock. It has a consistent track record of profitability and offers high dividend yields. Its diversified business model helps it maintain strong fundamentals.
Conclusion
In summary, value stocks are shares of companies that are potentially undervalued compared to their true worth. They often have low P/E ratios, high dividend yields, and strong financial fundamentals. While investing in value stocks can offer benefits such as capital appreciation and income generation, it also comes with risks like market timing and company-specific issues. Always conduct thorough research before investing and consider consulting with a financial advisor to ensure that your investment choices align with your financial goals.
Understand key market terms to make smarter investment decisions. Start Now!
.avif)
Understanding the Quick Ratio
When you're looking at a company's finances, one important measure to check is the quick ratio. It helps you understand how well a company can pay its short-term bills with the money it can quickly turn into cash. Let's break down what the quick ratio is, why it's important, and how you calculate it.
Understanding the Quick Ratio
The quick ratio, also called the acid-test ratio, measures a company's ability to cover its short-term liabilities with its most liquid assets. Liquid assets are those that can be quickly converted into cash, like cash itself, accounts receivable, and marketable securities.
Why is the Quick Ratio Important?
The quick ratio is important for several reasons:
- Liquidity Check: It shows if a company can pay off its immediate debts without having to sell inventory.
- Financial Health: A higher quick ratio means the company is in better financial shape.
- Creditworthiness: Lenders and creditors look at the quick ratio to decide if they should lend money to the company.
How to Calculate the Quick Ratio
The quick ratio is calculated with this formula:
Quick Ratio=Current Assets−InventoryCurrent Liabilities\text{Quick Ratio} = \frac{\text{Current Assets} - \text{Inventory}}{\text{Current Liabilities}}Quick Ratio=Current LiabilitiesCurrent Assets−Inventory
Here’s what each term means:
- Current Assets: Assets that can be turned into cash within a year, like cash, accounts receivable, and marketable securities.
- Inventory: Goods available for sale. Inventory is excluded because it might take longer to sell and convert into cash.
- Current Liabilities: Debts or obligations that need to be paid within a year, like accounts payable and short-term loans.
Example of Quick Ratio Calculation
Imagine a company has:
- Current Assets: $100,000
- Inventory: $30,000
- Current Liabilities: $50,000
The quick ratio would be:
Quick Ratio=100,000−30,00050,000=70,00050,000=1.4\text{Quick Ratio} = \frac{100,000 - 30,000}{50,000} = \frac{70,000}{50,000} = 1.4Quick Ratio=50,000100,000−30,000=50,00070,000=1.4
This means the company has $1.40 in liquid assets for every $1 of short-term liabilities.
What Does the Quick Ratio Mean?
Here’s how to interpret the quick ratio:
- Quick Ratio > 1: More than 1 means the company has more liquid assets than current liabilities, indicating good short-term financial health.
- Quick Ratio = 1: Exactly 1 means the company has just enough liquid assets to cover its short-term liabilities.
- Quick Ratio < 1: Less than 1 means the company might struggle to pay its short-term debts, which could be a red flag.
Limitations of the Quick Ratio
While the quick ratio is helpful, it has some limits:
- Doesn’t Include Inventory: The quick ratio assumes inventory can’t be quickly sold, which might not be true for all businesses.
- Snapshot in Time: It shows the financial situation at a specific moment, not necessarily the future.
- Industry Differences: Different industries have different standards for a healthy quick ratio, so it’s important to compare with industry norms.
Conclusion
The quick ratio is a handy tool for checking a company’s short-term financial health. By understanding and calculating the quick ratio, you can see if a company can meet its immediate obligations. However, remember to consider the quick ratio alongside other financial measures for a complete picture.
The stock market doesn't have to be intimidating—Start Learning Today!
.avif)
What Is Value Investing?
Value investing involves picking stocks that appear to be trading for less than their intrinsic or book value. Value investors actively search for stocks they believe the market is underestimating. They hold the conviction that the market often overreacts to good and bad news, resulting in stock price movements that do not align with a company's long-term fundamentals. This overreaction creates opportunities to purchase stocks at discounted prices.
How Does Value Investing Work?
The main objective of value investing is to purchase stocks when they are on sale and sell them when they reach or exceed their intrinsic value. Value investors look for companies with long-term potential that are experiencing temporary price downturns. They follow a few key steps:
- Identify Undervalued Stocks: Look for stocks trading below their intrinsic value.
- Conduct Fundamental Analysis: Examine financial metrics such as earnings, dividends, management quality, and debt levels.
- Apply a Margin of Safety: Allow a buffer by purchasing stocks at a discount to their intrinsic value to mitigate risk.
- Patience: Wait for the market to recognize the true value of the stocks.
The Margin of Safety:
Value investors use the margin of safety to reduce risk. This means purchasing stocks at a price significantly lower than their intrinsic value. Even if their assessment is slightly off, the lower purchase price minimizes potential losses..
Is value investing right for you?
Value investing can be a great way to build wealth over the long term. However, it requires patience, discipline, and a willingness to do your research. Consider your investment goals and risk tolerance before deciding if value investing is the right approach for you.
Benefits of value investing:
- Lower risk: Because you're buying stocks for less than they're worth, you have a bit of a safety net. Even if the company doesn't grow as fast as expected, you're less likely to lose money.
- Potentially higher returns: When the market corrects the undervaluation, you can earn significant profits.
Things to consider before becoming a value investor:
- Patience: Value investing is a long-term game. It may take time for the market to recognize a company's true value.
- Research: You'll need to do your homework to identify undervalued companies. This involves analyzing financial statements and understanding the company's business.
- Discipline: It's important to stick to your investment strategy and not get swayed by market emotions.
Conclusion
Value investing is an investment strategy where investors seek to buy shares, bonds, real estate, or other assets for less than their intrinsic value. It requires uncovering the true worth of assets and developing the patience to purchase them at prices lower than their intrinsic value. This approach offers a way to profit from market inefficiencies and overreactions, providing substantial returns over the long term.
The stock market doesn't have to be intimidating—Start Learning Today!
.avif)
Over-the-Counter Options: Overview, Types, and Benefits
Options trading is a popular strategy in finance for managing risks and making potential profits. While many people know about options traded on exchanges, there's another flexible option: Over-the-Counter (OTC) options. Let’s break down what OTC options are, the different types, and their benefits.
What Are Over-the-Counter Options?
OTC options are agreements made directly between two parties rather than on a public exchange. These deals are customized to fit the needs of both parties. Unlike exchange-traded options, OTC options come with a risk that one party might not fulfill their part of the deal (known as counterparty risk).
Types of Over-the-Counter Options
OTC options can be simple or quite complex. Here are the main types:
- Vanilla Options: These are straightforward and similar to exchange-traded options. They include:
- Call Options: The buyer has the right to buy an asset at a set price before a certain date.
- Put Options: The buyer has the right to sell an asset at a set price before a certain date.
- Exotic Options: These have unique features and can be more complex:
- Barrier Options: They become active or inactive when the asset price hits a certain level.
- Asian Options: The payout is based on the average price of the asset over a period.
- Binary Options: They provide a fixed payout if certain conditions are met at expiration.
- Swaptions: These give the right to enter into an interest rate swap agreement. They’re often used to manage interest rate risks.
- Structured Options: Highly customized to meet specific needs, these can combine different option features and other financial tools.
Benefits of Over-the-Counter Options
OTC options have several advantages:
- Customization: The biggest benefit is flexibility. Parties can customize terms like the price, expiration date, and underlying asset to suit their needs.
- Unique Assets: They can be written on a wide range of assets, even those not available on exchanges. This allows for hedging or speculating on less common assets.
- Privacy: OTC transactions are private, offering more confidentiality compared to exchange-traded options. This is useful for keeping trading strategies secret.
- Cost Efficiency: For large investors, OTC options can be cheaper since there are no exchange fees and terms are negotiated directly.
- Complex Strategies: Investors can create complex strategies using exotic and structured options that aren’t possible with standard options. This can lead to better risk management and higher potential returns.
Conclusion
Over-the-Counter options are a versatile tool for managing financial strategies. Despite the risk of one party not fulfilling the deal, the benefits of customization, privacy, and cost savings make OTC options valuable. Whether for hedging, speculating, or complex strategies, OTC options offer flexibility and innovation in the financial world.
Learn More about stock market trading with Swastika Investmart.
.avif)
What Is A Fixed Deposit Receipt?
When you invest your money, it’s important to have proof of where it’s going and what it’s earning. A Fixed Deposit Receipt (FDR) is exactly that proof for a fixed deposit. Let’s break down what a Fixed Deposit Receipt is, why it matters, and what you need to know about it.
What Is a Fixed Deposit?
A fixed deposit is a type of savings account where you deposit a lump sum of money for a specific period at a fixed interest rate. At the end of this period, you get back your initial amount plus the interest earned.
What Is a Fixed Deposit Receipt?
A Fixed Deposit Receipt is a document given to you by the bank or financial institution when you open a fixed deposit account. This receipt confirms that you have made the deposit and outlines the details of your investment.
Key Information on a Fixed Deposit Receipt
A Fixed Deposit Receipt usually includes the following details:
- Your Details: Your name and address.
- Amount Deposited: How much money you have put into the fixed deposit.
- Duration: How long the money will stay in the deposit.
- Interest Rate: The rate at which your money will earn interest.
- Maturity Date: The date when your deposit will end, and you can get your money back with interest.
- Deposit Number: A unique number identifying your fixed deposit.
- Bank Details: The name and branch of the bank where you made the deposit.
- Nominee: The person who will receive the money if something happens to you.
Why Is a Fixed Deposit Receipt Important?
A Fixed Deposit Receipt is important for several reasons:
- Proof of Investment: It shows that you have invested your money in a fixed deposit.
- Details of Investment: It provides all the important details about your investment, such as the interest rate and maturity date.
- Withdrawal: You need the receipt to withdraw your money when the deposit matures.
- Loans: Some banks allow you to use your Fixed Deposit Receipt as collateral for a loan.
- Tax Benefits: If your fixed deposit offers tax benefits, the receipt is necessary for claiming deductions.
How to Keep Your Fixed Deposit Receipt Safe
Since the Fixed Deposit Receipt is an important document, it’s crucial to keep it safe. Here are some tips:
- Store Securely: Keep the receipt in a safe place, like a locked drawer or safe.
- Make Copies: Take a digital copy and store it securely on your computer or in cloud storage.
- Inform Family: Let a trusted family member know where you’ve stored the receipt.
- Update Records: If you renew your fixed deposit, make sure to update your records with the new receipt.
Conclusion
A Fixed Deposit Receipt is an essential document that provides proof and details of your fixed deposit investment. Understanding its importance and keeping it safe ensures that you can manage your investments effectively. Whether you’re an experienced investor or new to fixed deposits, taking care of your Fixed Deposit Receipt is crucial for your financial security and peace of mind.
Learn the language of investing and achieve your financial goals with Swastika Investmart!
.avif)
Fundamental vs. Technical Analysis: What's the Difference?
When it comes to investing in stocks, there are two main ways people analyze which stocks to buy or sell: fundamental analysis and technical analysis. These methods help investors make decisions based on different aspects of a company's performance and market behavior. Here’s a simple breakdown of how they work and what sets them apart.
Fundamental Analysis
Fundamental analysis is like looking under the hood of a car to see how it works. It involves:
- Financial Health: Checking a company’s financial statements (like profits and debts) to see if it’s making money and managing its finances well.
- Business Outlook: Looking at things like the industry it’s in and how the economy might affect its profits.
- Management: Understanding how the company is run and if its leaders are making good decisions.
Goals of Fundamental Analysis:
- Finding Value: Identifying stocks that are priced lower than they should be based on how well the company is doing.
- Long-term Growth: Investing in companies that have potential to grow over time based on solid financial health and good management.
Example:
If you hear a company has been making a lot of profit and has a strong business plan, a fundamental analyst might think it’s a good investment for the future.
Technical Analysis
Technical analysis is more about looking at how a stock has performed in the past to predict its future. It involves:
- Price Patterns: Studying charts and patterns in stock prices to predict where they might go next.
- Indicators: Using tools like moving averages or graphs that show how fast a stock’s price is changing.
- Volume: Looking at how many shares are being bought and sold to understand if a price change is strong or weak.
Goals of Technical Analysis:
- Timing Trades: Deciding when to buy or sell a stock based on its recent price movements.
- Short-term Gains: Trying to make money quickly by taking advantage of price changes that happen often.
Example:
A technical analyst might look at a chart showing a stock’s price over the last few months to see if it’s going up or down, then decide to buy or sell based on that pattern.
Key Differences
- Focus: Fundamental analysis looks at how well a company is doing financially and its potential for growth. Technical analysis focuses on predicting price movements based on historical data and market trends.
- Data Used: Fundamental analysis uses financial statements and economic factors. Technical analysis uses charts, graphs, and historical price and volume data.
- Time Horizon: Fundamental analysis is for long-term investments. Technical analysis is often used for short-term trading.
- Approach to Risk: Fundamental analysis assesses risks based on financial health and economic conditions. Technical analysis manages risks by predicting price changes and market trends.
Choosing Your Approach
- Use Fundamental Analysis if you want to invest in companies with strong financials and growth potential for the long term.
- Use Technical Analysis if you’re interested in short-term trading and making decisions based on recent price trends.
Conclusion
Both fundamental and technical analysis are valuable tools for investors, offering different perspectives on how to choose stocks. Whether you’re looking to grow your money over time or make quick gains, understanding these methods can help you make smarter investment decisions that fit your goals and risk tolerance. Integrating both approaches or focusing on one that matches your investing style can improve your chances of success in the dynamic world of stock markets.
Learn the language of investing and achieve your financial goals with Swastika Investmart!
.avif)
What is a Demat Account?
A Demat or Dematerialized Account is like a digital locker for your stocks and investments. You don't need to worry about keeping track of physical certificates anymore. Instead, everything is stored electronically with a Depository Participant (DP), showing that you own those investments. This means you can trade or transfer them smoothly whenever you want, without dealing with paper documents.
A Demat Account provides strong security measures, reduces paperwork, makes transactions smoother, and improves how you keep track of your investments. But that's not all! By opening a Demat Account, you open the door to many opportunities. You can trade not just in stocks but also in other areas like derivatives, commodities, and currency. Plus, you get access to extra services like voting online for company decisions, bidding for new stocks, and enjoying perks from the companies you invest in. Overall, it makes your investment journey easier and more rewarding.
Factors to consider when opening a demat account
- Seamless Trading Experience: When your Demat and trading accounts are with the same broker, it simplifies the process of buying and selling stocks. You can easily manage your transactions without worrying about different accounts or paperwork.
- Robust Technology Platform: Look for a Demat account provider with a reliable technology platform. This ensures smooth functioning of your account, from fund transfers to tracking your investments, all in one place.
- Transparent Charges: Understand the charges related with your Demat account, including opening fees, annual maintenance charges, and transaction fees.
- Efficient Banking, Broking, and Custody: A seamless integration of banking, broking, and custody services enhances your overall experience. Ensure your broker offers hassle-free fund transfers and efficient management of your securities.
- Quality Support Services: Check out for aspects such as customer service, technical support, and problem resolution. Know whether they provide customer service representatives, offer multiple channels for support (such as phone, email, or live chat), and resolve issues in a timely manner.
Demat Account Opening Procedure- Step-by-Step Guide
Opening an online trading account is the first step towards becoming a successful investor. Before we begin, decide whether you want to open an account with Swastika through their website or with Justrade2.0 via their mobile app. Both options offer user-friendly interfaces and convenient features to make the account opening process seamless.
Via Website (Swastika):
- Visit Swastika's website & click “Open an Account”: Go to Swastika's website and find the option to open an account. It's usually a button or link that says something like "Open an Account."
- Enter mobile no. & email: Fill in your mobile number and email address. This is so they can contact you about your account.
- Enter Aadhaar no. & PAN: Enter your Aadhaar number and PAN card details.
- Fill in basic details: Provide basic information like your name, address, and date of birth. This helps Swastika create your account.
- Select segment: Choose the investment segment you're interested in, like stocks or mutual funds.
- Upload required documents: Scan or take pictures of the documents Swastika asks for, like your Signature, Income Proof, bank Proof. Upload these documents to their website.
- In Person Verification (IPV): Swastika may require In Person Verification (IPV) as part of their account opening process. This involves a physical verification of your identity and documents by a representative of Swastika. Arrange a suitable time and location for the IPV process as instructed by Swastika.
- Provide Nominee Details:Provide details about your nominee. This includes their name, relationship to you, contact information, and any other relevant details. Nominee details are important for certain financial transactions and account management purposes.
- E-sign: Use your Aadhaar number to electronically sign the documents. This is like signing your name on paper but done digitally.
- Account opened: Once you've completed all the steps and everything is verified, your account is officially opened! You'll receive confirmation and can start using your Swastika account to trade.
Via Mobile App (Justrade2.0):
- Download Justrade2.0: Find and download the Justrade2.0 app from the app store on your mobile phone.
- Enter mobile no. & email: Just like on the website, you'll need to provide your mobile number and email address.
- Enter Aadhaar no. & PIN into Digilocker to fetch PAN: Use your Aadhaar number and PIN to access your PAN card details from Digilocker.
- Fill in basic details: Enter your personal information, like your name, address, and date of birth.
- Select plan & segment: Choose the type of account and investment segment you're interested in.
- Upload required documents: Take photos of your documents using your phone's camera and upload them directly to the app.
- E-sign: Use your Aadhaar number to electronically sign the necessary documents.
- Account opened: Once everything is submitted and verified, your account is ready to use! You can start trading using the Justrade2.0 app on your phone.
That's it! Following these steps will help you open an account with Swastika via their website or with Justrade2.0 via their mobile app
Documents Required for Opening Demat and Trading Accounts
To open a demat & share trading account you need the following documents
For Indian resident individuals
- Your PAN Card
- Your valid Government approved address proof (any one of the following)-
- Aadhar Card
- Driver's Licence
- Passport
- Voter's ID
- Ration Card
- Registered lease or sale agreement of residence
- Insurance copy
- Utility bills like telephone, electricity or gas (less than 3 months old
- Your bank proof mentioning your name, account number and IFSC code clearly (any one of the following)-
- Cancelled cheque
- Bank statement/Passbook (last 6 months)
Futures and Options
For Equity and Currency Derivatives you would require an income proof along with the above-mentioned documents. Income proof can be any one of the following -
- Bank account statement/Passbook (last 6 months)
- Income tax returns (last 1 year)
- Salary slips (last 6 month)
Benefits of Demat Accounts:
- Reduced Risk: Demat accounts eliminate the risk of losing or damaging paper certificates. Electronic securities stored in these accounts cannot be lost or damaged over time, providing greater security for your investments.
- Effortless Trading: Linking your Demat account with a trading account allows for quick and convenient trading. You can buy or sell shares with just a click, without the need to visit company offices or stock exchanges personally. Look for brokers offering a 2-in-1 (Demat cum trading) account for seamless trading experience
- Easy Portfolio Tracking: Demat accounts offer portfolio tracking capabilities, providing easy access to your holdings. You can monitor your entire portfolio using various devices such as smartphones or laptops.
- IPO Investments: Demat accounts are essential for investing in Initial Public Offerings (IPOs) in India. Companies issuing IPOs require your Demat account details for share allotment. Having a Demat account also grants access to various other investment schemes and holdings, making IPO investments hassle-free.
- Diversification: Besides stocks, you can hold a variety of securities such as mutual funds, bonds, exchange-traded funds (ETFs), and government securities in your Demat account, enabling portfolio diversification.
- Participation in Corporate Actions: Demat accounts are essential for receiving dividends, bonus shares, or other corporate actions seamlessly.
- Cost-Effective: Compared to traditional paper-based transactions, Demat accounts reduce paperwork and associated costs, making investing more cost-effective in the long run.
- Loan Against Securities: Some financial institutions offer loans against securities held in Demat accounts, providing liquidity without the need to sell your investments.
Demat Account Charges Simplified:
- Maintenance Fees: These are annual charges for keeping your Demat account active, regardless of how often you trade. Look for the most cost-effective option when choosing your account.
- Account Opening Charges: Some DPs charge a fee to open a Demat account, while others don't. Choose the option that suits you best.
- Custodian Fees: These fees are monthly charges based on the number of securities you hold. If your DP has already paid one-time charges, you might not face custodian fees. Individuals usually pay these one-time charges, so brokers often don't charge custodian fees on Demat accounts.
- Transaction Fees: These fees are incurred each time you buy or sell securities through your Demat account. DPs may charge a flat fee per transaction or a percentage based on the transaction value. Be aware of these charges when making transactions.
Open Demat Account FAQs:
What is a trading account?
A trading account is a type of investment account that allows you to buy and sell financial securities, such as stocks, bonds, options, and commodities, through a brokerage firm or financial institution. It acts as a gateway to the stock market, enabling you to execute trades and participate in various investment opportunities.
When you open a trading account, you are provided with a unique account number and login credentials that grant you access to the trading platform offered by your broker. Through this platform, you can place buy and sell orders, monitor your portfolio, view market data and charts, and manage your investments.
Trading accounts come in different types, such as cash accounts and margin accounts. In a cash account, you can only trade with the funds you have deposited, while a margin account allows you to borrow money from the broker to increase your buying power, subject to certain conditions and margin requirements.
Overall, a trading account is essential for individuals looking to actively participate in the financial markets and build their investment portfolios.
Who's a Depository Participant?
A Depository Participant is like a middleman between you and the stock market. They can be a bank or a brokerage firm registered with either CDSL or NSDL. You can find a list of these participants online and pick the ones with the best services.
There are two main types of brokerage firms: discount and service. Discount brokers mainly focus on trading stocks and derivatives according to your instructions. Service brokers offer a wider range of services, like advice on investments, mutual funds, insurance, and IPOs. Before you open an online demat account, decide which type of brokerage services you need.
Can I hold different types of securities in a Demat account?
Yes, you can hold various types of securities such as equities, bonds, mutual funds, ETFs, government securities, and derivatives in a Demat account.
What is Dematerialisation and Rematerialisation Services?
Demat accounts automate the dematerialisation of securities linked to the trading account. If you have physical securities from previous trades, they can be dematerialised by paying a fee. Additionally, Demat accounts offer rematerialisation services, allowing you to convert dematerialised securities back into their physical form when needed.
Is it safe to open a Demat account online?
Opening a Demat account online can be safe if you choose a reputable brokerage firm, verify security measures, use secure devices and networks, keep login credentials secure, monitor account activity, beware of phishing attempts, and keep software updated. By following these precautions, you can securely manage your investments and enjoy the convenience of online trading without compromising your financial security.
Conclusion
A Demat account offers a secure, paperless way to manage investments like stocks, bonds, and mutual funds. It simplifies trading, reduces paperwork, and provides access to a variety of investment opportunities. By opening a Demat account with a reliable broker, you can trade efficiently and benefit from added services like online voting and bidding for new stocks. With proper security measures, online trading becomes safe and convenient, making investing more accessible and rewarding.
Stay updated with Swastika Investmart for more financial insights. JOIN NOW

10 Proven Trading Strategies to Maximize Profits and Reduce Losses
Stock trading can be very profitable, especially if you stick with it for a long time. To be successful, it's important to understand things like a company's financial health and its real value.
Trading has been around for a long time, starting with the barter system where people traded goods directly with each other. This old form of trading laid the groundwork for the modern stock market.
The stock market is a place where people buy and sell shares of companies. These shares represent part ownership in the business. The first modern stock exchange started in Amsterdam in 1602, where people traded shares of the Dutch East India Company.
Derivatives, which are contracts based on the value of an asset, were first traded in 1607 by a single company. Dividends, or profits shared with stockholders, were given out a few years later. Amsterdam was also the birthplace of futures and options trading.
Today, more and more people are getting interested in the stock market, even those who don’t have much experience. Many see trading as a good way to grow their wealth.
Staying consistently profitable in trading is the goal of every trader, but the journey isn’t always smooth. However, by following some proven strategies, you can increase your chances of staying in the green. Here are ten tried and tested trading strategies to help you stay in profit, explained in simple language.
1. Set Clear Goals and Stick to a Plan
The foundation of successful trading is having a clear goal and a solid plan. Before you even make your first trade, know what you want to achieve.
- Define your trading objectives: Are you looking for short-term gains, or is long-term growth your goal?
- Create a plan: Outline your entry and exit points, how much you’re willing to risk, and how you’ll respond to market changes.
- Stick to the plan: It’s easy to get swayed by emotions, but staying disciplined is key to long-term profitability.
2. Use Stop-Loss Orders
A stop-loss order is a tool that automatically sells your stock if it drops to a certain price, preventing further losses.
- Set your stop-loss: Determine the maximum loss you’re willing to take on a trade and set your stop-loss accordingly.
- Protect your capital: By using stop-loss orders, you can prevent a small loss from turning into a big one.
3. Diversify Your Portfolio
Diversification means spreading your investments across different assets or sectors to reduce risk.
- Avoid putting all your eggs in one basket: Invest in various sectors like technology, healthcare, and consumer goods. If one sector performs poorly, others might do well, balancing your overall returns.
- Include different asset types: Consider adding bonds, ETFs, or mutual funds to your portfolio for added stability.
4. Follow Market Trends
Trend trading is a strategy where you make decisions based on the direction of the market.
- Identify the trend: Use technical analysis tools like moving averages to determine whether the market is trending up, down, or sideways.
- Trade with the trend: If the market is going up, focus on buying (going long). If it’s going down, you might consider selling (going short).
5. Practice Risk Management
Risk management involves controlling the amount of money you expose to potential loss on any given trade.
- Use the 1% rule: Don’t risk more than 1% of your trading capital on a single trade. This way, even if a trade doesn’t go as planned, it won’t significantly impact your overall portfolio.
- Balance risk and reward: Always aim for a higher potential reward compared to the risk. For example, risking ₹10,000 to make ₹30,000 ensures that even if you lose occasionally, you’ll still come out ahead.
6. Keep Emotions in Check
Emotions like fear and greed can cloud your judgment and lead to poor trading decisions.
- Stay calm: Don’t let short-term market fluctuations affect your trading decisions. Stick to your plan and avoid making impulsive trades.
- Avoid emotional trading: If you feel overly stressed or emotional, it might be best to take a break from trading until you can approach it with a clear mind.
7. Regularly Review and Adjust Your Strategy
Markets are constantly changing, so it’s important to review your trading strategy regularly.
- Analyze past trades: Look at what worked and what didn’t. Learn from your mistakes and successes.
- Adjust your strategy: If market conditions change or you notice a pattern in your trading performance, don’t hesitate to tweak your strategy to better align with your goals.
8. Learn to Identify and Trade Support and Resistance Levels
Support and resistance levels are key concepts in technical analysis that can help you make better trading decisions.
- Support level: This is the price level where a stock tends to find support as it falls. Think of it as a floor that the price has trouble falling below.
- Resistance level: This is the price level where a stock often faces selling pressure as it rises, acting like a ceiling.
- Trade near these levels: Buy near support and sell near resistance for better profit potential.
9. Use Technical Indicators
Technical indicators like moving averages, Relative Strength Index (RSI), and MACD can provide insights into market trends and potential entry and exit points.
- Moving Averages: These smooth out price data to create a trend-following indicator.
- RSI: Helps identify whether a stock is overbought or oversold, which can indicate a potential reversal.
- MACD: Shows the relationship between two moving averages and can help signal buying or selling opportunities.
10. Stay Informed and Adapt to Market Conditions
The financial markets are influenced by various factors, including economic data, geopolitical events, and market sentiment. Staying informed helps you anticipate potential changes.
- Follow market news: Keep up with the latest financial news, earnings reports, and economic data releases.
- Be adaptable: Markets can change quickly. Be ready to adjust your strategy or portfolio if necessary to align with new market conditions.
Conclusion
Trading for profit requires discipline, knowledge, and the right strategies. By setting clear goals, managing risk, following trends, and staying updated, you can increase your chances of consistent profitability. Remember, no strategy guarantees success, but these ten tried and tested methods can significantly enhance your trading outcomes.

What are Price Patterns?
Price Patterns are shapes or formations on charts that can be categorized and used to predict future price movements.
These patterns have been seen repeatedly across different charts and times, proving their reliability.
- Duration: Price patterns can last from a few days to several months or even years. Longer patterns usually lead to more significant price moves.
- Price Targets: The targets from these patterns estimate how far the price might move, but they are approximate.
- Interpretation: Analysing patterns involves both skill and flexibility. Patterns may not match the textbook description perfectly but can still be valid.
- Considerations: Always look at the price behaviour and the time it takes for the pattern to form to get a complete picture.
Classification of Patterns
Reversal patterns are important signals in trading that suggest a current trend (whether it's going up or down) might soon change direction. They usually appear after a long period of a particular trend. These patterns help traders predict when a trend might be ending and a new one might start.
Common examples of reversal patterns include:
- Head & Shoulders
- Double Top/Double Bottom
- Triple Top/Triple Bottom
- Broadening Formations
- Rounding Bottom/Rounding Top or Cup & Handle Pattern
Continuation patterns are signals in trading that suggest a brief pause in the current trend, but the trend is likely to continue in the same direction after the pause. In other words, the trend takes a short break and then keeps going.
Common examples of continuation patterns include:
- Flags
- Pennants
- Triangles: Ascending Triangle/Descending Triangle
- Rectangles:
Both Continuous and Reversal Patterns

Rising/Falling Wedges
In this blog, we will have a brief look at how these patterns look.
Double Top : A Double Top is a bearish reversal pattern that signals a potential end to an uptrend. It forms when the price creates two high points (highs) at nearly the same level, separated by a period of time.
- Prior Trend: There must be a strong upward trend.
- First High: The price reaches a high point and then pulls back slightly.
- Second High: The price rises again to a similar level as the first high but on lower trading volume.
- Pattern Completion: The pattern is completed when the price drops below the lowest point between the two highs, confirming a trend reversal. This drop should happen with an increase in trading volume.
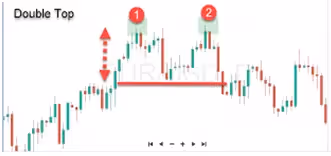
Tip: One will find double top developing often in stocks but one must look at the prior trend and volume to rely on the formation.
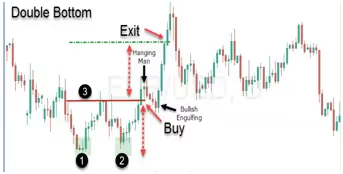
Double Bottom
A Double Bottom pattern is a bullish reversal pattern signalling a potential end to a downtrend.
- Prior Trend: There must be a strong downward trend
- First Low: The price hits a low point (low) and then starts to rise.
- High: After the first low, the price climbs and forms a high point (high), which may look slightly rounded.
- Second Low: The price drops again, creating a second low at a similar level to the first, but with lower trading volume.
- Pattern Completion: The pattern is completed when the price rises above the highest point between the two lows, indicating a reversal of the downtrend. This breakout should occur with increased trading volume.
Triple Top
A Triple Top is a bearish reversal pattern that indicates the potential end of an uptrend. It features three distinct high points at roughly the same price level. Here’s a simplified explanation:
- Prior Trend: There must be a strong upward trend before the Triple Top forms.
- Three Highs: The price reaches three highs, each at a similar level, and these highs are well-spaced, marking turning points where the price starts to drop after each high.
- Volume: During the formation of the Triple Top, trading volume usually decreases, with the highest volume at the first high and lower volume on the following highs. However, when the price finally breaks below the support level (the lowest point between the highs), volume should increase, confirming the pattern.

Tip: Pattern is complete when the both lows have been broken on heavier volume.
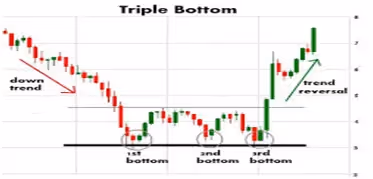
Triple Bottom
A Triple Bottom is a bullish reversal pattern that signals the potential end of a downtrend. It features three distinct low points at roughly the same price level.
- Prior Trend: There must be a strong downward trend before the Triple Bottom forms.
- Three Lows: The price hits three low points, each at a similar level, and these lows are well-spaced, marking turning points where the price starts to rise after each low.
- Volume: During the formation of the Triple Bottom, trading volume usually decreases, with the highest volume at the first low and lower volume on the following lows. However, when the price finally breaks above the resistance level (the highest point between the lows), volume should increase, confirming the pattern.
Head & Shoulders
- Prior Trend: For a Head & Shoulders pattern to be a reversal signal, there must be a clear uptrend before it forms. Without this uptrend, the pattern can't signal a reversal.
- Left Shoulder: During an uptrend, the price hits a high point (left shoulder) and then drops a bit. This drop usually stays above the trend line, so the uptrend continues.
- Head: After the drop from the left shoulder, the price rises again, reaching a new high (the head). After this high, the price drops again, creating a low point that helps form the neckline.
- Right Shoulder: From the low of the head, the price rises again but doesn’t reach the height of the head. This high (right shoulder) is usually around the same level as the left shoulder. The final decline should break the neckline, completing the pattern.

Inverse Head and Shoulders
The Inverse Head and Shoulders, signals a potential change from a downtrend to an uptrend. Here’s how it forms:
- Prior Trend: There must be a clear downtrend before this pattern can signal a reversal. Without a downtrend, the pattern doesn’t work.
- Left Shoulder: During the downtrend, the price drops to a low point (left shoulder) and then starts to rise.
- Head: After the rise from the left shoulder, the price drops again to a lower point (the head), then rises again, creating a high point that helps form the neckline.
- Right Shoulder: The price drops from the high of the head to form another low (right shoulder). This low should be higher than the head and usually around the same level as the left shoulder. The final rise should break above the neckline, completing the pattern.

When the price breaks above the neckline, it suggests the downtrend may be ending, and the price could start rising.
Broadening Formations
Broadening Formations are patterns where the price creates an expanding triangle. Unlike regular triangles, where the trend lines come together, broadening formations have trend lines that spread out, making the shape of an expanding triangle.
In simple terms, as the price moves, the highs and lows get further apart, creating a pattern that looks like an expanding triangle.
Broadening Bottoms
A Broadening bottom looks like a megaphone and appears during a downtrend. It features:
- Higher Highs and Lower Lows: The price makes progressively higher highs and lower lows, creating a wide, expanding shape over time.
This pattern is a bullish reversal signal, meaning that after it forms, the price trend is likely to shift from down to up.
Volume: Trading volume is often uneven but tends to rise when the price goes up and fall when the price goes down.
Broadening Wedges Ascending
A Broadening Wedges Ascending is a bearish reversal pattern where:
- Trend Lines: Two trend lines slope upwards and get wider apart over time.
- Volume: Trading volume usually increases as the pattern develops.
This pattern indicates that the current uptrend might be ending and a downtrend could begin

Broadening Wedges Descending
A Broadening Wedges Descending is a bullish reversal pattern where:
- Trend Lines: Two trend lines slope downwards and get wider apart over time.
- Volume: Trading volume typically increases as the pattern forms.
This pattern suggests that the downtrend might be ending and a new uptrend could start.

RISING WEDGE
A Rising Wedge is a bearish pattern that forms when prices start wide at the bottom and gradually narrow as they move higher. This pattern slopes upward and signals a potential drop in prices. Here's a simple breakdown:
- Bearish Bias: A rising wedge generally indicates that prices are likely to fall, even though the pattern slopes upward.
- Continuation Pattern: If the wedge forms during a downtrend, it suggests the price might continue to fall after a brief upward movement.
- Reversal Pattern: If the wedge forms during an uptrend, it signals that the upward trend may be ending, and a downward trend could begin.
Regardless of whether it's a continuation or a reversal, a rising wedge usually predicts a drop in prices.
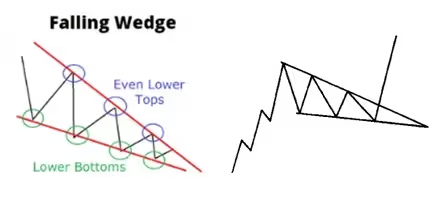
Falling Wedge Pattern
A falling wedge is a chart pattern that looks like a downward-sloping cone. It starts wide at the top and gets narrower as the price moves lower.
- Bullish Signal: It’s considered a bullish pattern, meaning it suggests the price might go up after the pattern forms.
- Continuation Pattern: If the price was going up before the falling wedge, it means the wedge is just a pause, and the uptrend is likely to continue after the pattern completes.
- Reversal Pattern: If the price was going down before the falling wedge, it indicates that the downtrend might end, and the price could start going up.
Overall, whether it’s a continuation or a reversal, a falling wedge generally suggests that prices are likely to rise after the pattern finishes.
Rounding Top
- The price trend slowly curves downward over time, creating a rounded shape.
- Bullish Signal: This pattern is known as a bullish consolidation pattern, which means it suggests that after this gradual downward curve, the price is likely to start moving up

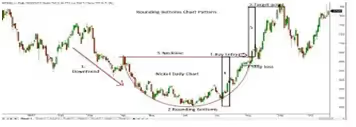
Rounding Bottom
A rounding bottom pattern is a bullish consolidation pattern where the price trend gradually curves upward over time, resembling the shape of a cup. This pattern suggests that the market is slowly gaining strength and is likely to continue rising after the consolidation period.
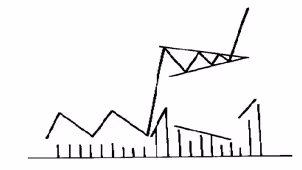
FLAGS & PENNANTS
Flags and Pennants are short-term continuation patterns that show a brief pause in a strong price move before the trend continues in the same direction. These patterns appear after a sharp rise or fall in price with high trading volume.
Flags look like small rectangles that slope against the trend. This pattern looks like a small rectangle that slopes against the main trend. Volume usually decreases during the formation, then picks up again when the price breaks out of the flag.

Pennants have a triangular shape. This pattern looks like a small triangle with converging trend lines and resembles a short symmetrical triangle. Like flags, volume typically decreases during the pattern and increases when the price breaks out.
Both patterns indicate a short break before the price resumes its previous direction, whether up or down.
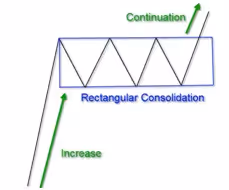
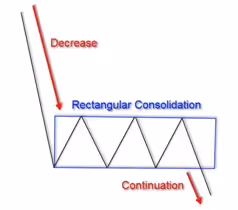
Rectangle
A Rectangle is a continuation pattern that forms when the price moves within a set range during a break in the trend. It looks like a rectangle because the price has two highs and two lows that create parallel lines at the top and bottom.
- Highs and Lows: The price hits similar high points and low points, creating a trading range.
- Other Names: Rectangles are also called trading ranges, consolidation zones, or congestion areas.
This pattern shows that the price is pausing and is likely to continue in the same direction once it breaks out of the range.
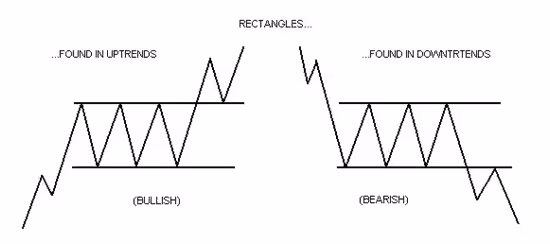
Rectangle Top
Bullish Rectangle Pattern: This is a bullish reversal pattern where the price also moves within a horizontal range, with two horizontal trend lines. When the price breaks above this range, it usually indicates an upward move.
Rectangle Bottom
Bearish Rectangle Pattern: This is a bearish reversal pattern where the price moves within a horizontal range, forming two horizontal trend lines. When the price breaks below this range, it often signals a downward move.
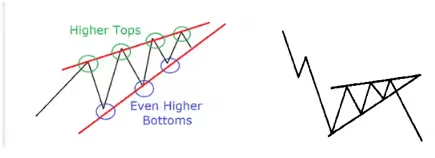
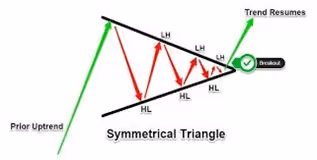
Symmetrical Triangle
A Symmetrical Triangle pattern forms when two trend lines come together and create a triangle shape.
- Upper Trend Line: Slopes downward, connecting lower highs.
- Lower Trend Line: Slopes upward, connecting higher lows.
- Apex: The point (intersection) where the two trend lines meet.
As the triangle forms, trading volume usually decreases. The pattern indicates that the price could break out in either direction when it reaches the apex.
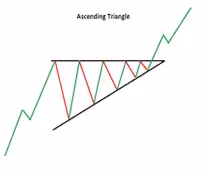
Ascending Triangle
An Ascending Triangle is a bullish pattern that generally forms during an uptrend. It features:
- Horizontal Top Line: A flat line at the top, showing consistent resistance.
- Rising Bottom Line: An upward-sloping line connecting higher lows.
This pattern often signals that the price will keep rising after the triangle forms. It can also appear at the end of a downtrend as a reversal pattern, but it's usually a continuation pattern that shows the price is likely to keep going up.
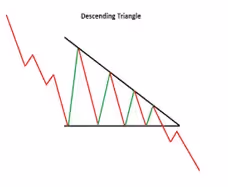
A Descending Triangle is a bearish pattern that usually forms during a downtrend. It has:
- Horizontal Bottom Line: A flat line at the bottom, showing consistent support.
- Downward-Sloping Top Line: A line sloping downwards, connecting lower highs.
This pattern often signals that the price will continue to fall after the triangle forms. It can also appear at the end of an uptrend as a reversal pattern, but it typically indicates the price is likely to keep going down.
Conclusion
Price patterns on charts, whether reversal or continuation, play a vital role in predicting future price movements in the market. Reversal patterns like Double Top, Double Bottom, and Head & Shoulders signal changes in the direction of the current trend, while continuation patterns like Flags, Pennants, and Triangles indicate a brief pause before the trend resumes. Understanding these patterns helps traders make informed decisions about when to enter or exit trades, maximizing potential profits. By analyzing the shape and volume accompanying these patterns, traders can gain insights into market sentiment and anticipate price shifts.
Stay updated with Swastika and learn more about stock market and its terminologies!

National Pension System (NPS): A Comprehensive Guide
The National Pension System (NPS) is a government-sponsored retirement savings scheme in India, introduced in 2004. It has gained popularity among investors seeking a low-cost, long-term savings option for their retirement. This blog post will discuss the basics of NPS, its features, tax benefits, rules, and the types of NPS accounts, along with the advantages and disadvantages of investing in it.
Basics of NPS
The National Pension System is a voluntary, defined-contribution retirement savings scheme that allows subscribers to accumulate savings for their retirement. Under this scheme, subscribers can regularly contribute to their NPS account, and the funds are invested in a mix of equity, debt, and government securities, based on their investment preferences. Upon retirement, subscribers can withdraw a portion of their savings as a lump sum, and the remaining amount is paid out as a monthly pension.
Types of NPS Accounts
1. Tier-I Account
- Purpose: This is the primary retirement account and is mandatory for all NPS subscribers.
- Withdrawals: Limited withdrawals allowed before retirement. Upon retirement, 60% of the corpus can be withdrawn tax-free, while the remaining 40% must be used to purchase an annuity.
- Tax Benefits: Contributions are eligible for tax deductions under Section 80C and Section 80CCD(1B).
2. Tier-II Account
- Purpose: This is a voluntary savings account, which provides liquidity and flexibility.
- Withdrawals: Unlimited withdrawals are allowed.
- Tax Benefits: No tax benefits are available for contributions to this account.
NPS Login
To open an NPS account, subscribers can visit the NPS Trust website and register by providing personal and bank details. They can also choose a fund manager and select their investment preferences. Subscribers are given a Permanent Retirement Account Number (PRAN) to manage their account and make contributions. Subscribers can log in to their NPS account to check their balance, view transactions, and make contributions.
Rules of NPS
The NPS has certain rules and regulations that subscribers must follow:
- Regular Contributions: Subscribers must contribute regularly to their NPS account to avoid penalties.
- Updated Information: Subscribers must keep their contact details and bank account information up to date to ensure timely pension payments.
Advantages of NPS
- Long-term Savings: The NPS encourages long-term savings for retirement, which is crucial for a secure financial future.
- Tax Benefits: Contributions to the NPS offer tax benefits, making it an attractive option for tax-efficient savings.
- Low Cost: The NPS has a low annual maintenance charge, ensuring more of the investor's money is invested in underlying assets.
- Flexibility: Subscribers can choose their fund manager, investment preferences, and contribution amounts to meet their unique requirements.
- Portability: NPS accounts are easily transferable between fund managers and sectors, providing flexibility in managing investments.
Disadvantages of NPS
- Compulsory Annuity: Subscribers must use at least 40% of the accumulated corpus to purchase an annuity upon retirement, limiting control over retirement income.
- Taxation of Withdrawals: While contributions are eligible for tax benefits, withdrawals from the NPS are taxable, reducing overall returns.
- Market Risk: NPS investments are subject to market risk, as funds are invested in a mix of equity, debt, and government securities.
- Limited Liquidity: The NPS is a long-term investment option, with limited withdrawal options before the age of 60, except in certain emergencies.
Conclusion
The National Pension System is a popular retirement savings option in India, offering a low-cost, flexible, and tax-efficient way to build a retirement fund. While there are certain disadvantages, such as compulsory annuity and market risk, the advantages of the scheme make it a good option for long-term retirement planning. As always, investors should carefully consider their investment goals and risk tolerance before investing in any financial instrument, including the National Pension System.
Learn more about financial insights with Swastika Investmart. JOIN NOW!
.avif)
Types of Derivatives
Introduction to Derivatives
Derivatives are financial instruments whose value is derived from the performance of an underlying asset, index, or rate. These instruments are essential in financial markets for purposes such as hedging risk, speculating on future price movements, and arbitraging price discrepancies. In India, the derivatives market has seen substantial growth, with the National Stock Exchange (NSE) reporting an average daily turnover of ₹52.8 trillion in FY2022-23. Derivatives can be broadly categorized into two types based on their payoff structure: linear and non-linear derivatives. Let's explore these in simple terms.
Linear Derivatives
Linear derivatives have a straightforward, direct relationship with the price of the underlying asset. Their value changes proportionally with the changes in the underlying asset's price. The two main types of linear derivatives are futures and forwards.
Forward Contracts
What Are Forward Contracts?
Forward contracts are customized agreements between two parties to buy or sell an asset at a specified future date for a price agreed upon today. These contracts are traded over-the-counter (OTC), meaning they are negotiated directly between the parties involved and not on an exchange.
Key Characteristics of Forward Contracts
- Customization: Forward contracts can be tailored to fit the specific needs of the parties involved, including the quantity of the asset, the price, and the delivery date.
- OTC Trading: These contracts are not standardized and are traded OTC, which can introduce counterparty risk.
- Settlement: Forward contracts can be settled either by physical delivery of the asset or by cash settlement.
How They Work: Imagine you and a farmer agree that you will buy 1,000 kg of wheat at ₹25 per kg in six months. This contract is tailor-made to your needs.
Example: If the market price of wheat rises to ₹28 per kg, your forward contract has increased in value because you can buy at the lower price of ₹25.
Use Cases: Forwards are used for the same reasons as futures but offer more flexibility in terms of contract size and settlement dates.
Benefits of Forward Contracts
- Customization: Forward contracts can be tailored to the exact specifications of the buyer and seller.
- Hedging: They are often used to hedge against the risk of price fluctuations in the underlying asset.
- Simplicity: Forward contracts are straightforward agreements without the need for an intermediary.
Risks of Forward Contracts
- Counterparty Risk: There is a risk that one party may default on the agreement.
- Liquidity Risk: Forward contracts are less liquid because they are not traded on an exchange.
- Market Risk: Changes in the market value of the underlying asset can lead to significant losses.
Futures Contracts
What Are Futures Contracts?
Futures contracts are standardized agreements to buy or sell a specific quantity of an asset at a predetermined price on a specified future date. Unlike forward contracts, futures are traded on organized exchanges.
Key Characteristics of Futures Contracts
- Standardization: Futures contracts are standardized in terms of quantity, quality (if applicable), and delivery date.
- Exchange-Traded: Futures are traded on exchanges, such as the National Stock Exchange (NSE) and the Bombay Stock Exchange (BSE), providing liquidity and transparency.
- Margin Requirements: Traders are required to post an initial margin to enter a futures contract and maintain a maintenance margin. If the account falls below this level, a margin call is issued.
- Mark-to-Market: Futures contracts are marked to market daily, meaning gains and losses are settled at the end of each trading day based on the current market price.
Types of Futures Contracts
Equity Futures
Equity futures involve buying or selling individual stocks at a future date and at a predetermined price. These contracts are used for speculation and hedging purposes. India's equity futures market is one of the largest in the world, with the NSE's Nifty 50 index futures being highly popular among traders.
- Example: If an investor expects the price of Infosys stock to increase, they might buy Infosys futures contracts. If the price rises as anticipated, they can profit by buying the stock at the lower futures price and selling it at the higher market price.
Currency Futures
Currency futures are contracts that involve the exchange rate of currency pairs such as USD/INR, EUR/INR, and GBP/INR. These contracts help manage currency risk for businesses and enable currency speculation. The USD/INR futures are among the most traded currency futures in the Indian market.
- Example: A company importing goods from the US might use USD/INR futures to lock in a favourable exchange rate, protecting against adverse currency movements.
Commodity Futures
Commodity futures involve contracts for physical goods such as agricultural products (wheat, sugar), metals (gold, silver), and energy products (crude oil, natural gas). India has a robust commodity futures market, with gold and crude oil futures being particularly active.
- Example: A farmer might use wheat futures to lock in a price for their upcoming harvest, ensuring stability amidst price fluctuations.
How They Work: Suppose you agree to buy 100 shares of Reliance Industries in three months at ₹2,000 per share. Regardless of the market price at that time, you will buy them at ₹2,000 per share.
- Example: If the price of Reliance Industries rises to ₹2,200 per share, your futures contract has increased in value because you can buy at the lower, agreed-upon price of ₹2,000.
- Use Cases: Futures are used by investors to lock in prices and avoid market volatility and by traders to speculate on the direction of market prices.
Benefits of Trading Futures
- Leverage: Futures contracts allow traders to control large positions with a relatively small amount of capital.
- Liquidity: Many futures markets are highly liquid, facilitating easy entry and exit from positions.
- Price Discovery: Futures markets contribute to the efficient determination of the price of the underlying asset.
- Hedging: Futures provide a mechanism for hedging risk against adverse price movements in the underlying asset.
Risks of Trading Futures
- Leverage Risk: While leverage can boost gains, it can also magnify losses.
- Market Risk: Unfavorable price movements can lead to significant losses.
- Margin Risk: If the market moves against a position, traders may be required to deposit additional margin.
- Liquidity Risk: In less liquid markets, it may be difficult to enter or exit positions without affecting the market price.
Options Contracts
What Are Options Contracts?
Options are contracts that provide the buyer the right, but not the obligation, to buy or sell an underlying asset at a predetermined price before or at the contract's expiration. There are two main types of options: call options and put options.
Key Characteristics of Options Contracts
- Premium: The price paid by the buyer to the seller for the option contract.
- Strike Price: The predetermined price at which the underlying asset can be bought (call) or sold (put).
- Expiration Date: The date by which the option must be exercised or it becomes worthless.
- Intrinsic Value: The difference between the underlying asset's price and the strike price, if favorable to the option holder.
Types of Options and Positions
Options are versatile financial instruments that give traders and investors the right, but not the obligation, to buy or sell an asset at a predetermined price (strike price) within a specified time frame (expiry date). They are widely used in the Indian stock market for various trading and hedging strategies. Let's explore the main types of options and positions available:
Types of Options
- Call Options
Call options give the holder the right to buy an underlying asset at a specified price (strike price) on or before the expiration date.
- Buyer's Position: The buyer of a call option pays a premium to acquire the right to buy the underlying asset. They profit if the price of the asset rises above the strike price plus the premium paid.
- Seller's Position (Writer): The seller (writer) of a call option receives the premium but takes on the obligation to sell the underlying asset if the buyer exercises the option. They profit if the asset price remains below the strike price.
2. Put Options
Put options give the holder the right to sell an underlying asset at a specified price (strike price) on or before the expiration date.
- Buyer's Position: The buyer of a put option pays a premium to acquire the right to sell the underlying asset. They profit if the price of the asset falls below the strike price minus the premium paid.
- Seller's Position (Writer): The seller (writer) of a put option receives the premium but takes on the obligation to buy the underlying asset if the buyer exercises the option. They profit if the asset price remains above the strike price.
Types of Positions
- Long Position
Traders hold a long position when they purchase a call or put option.
- Long Call: Profits if the price of the underlying asset rises above the strike price plus the premium paid.
- Long Put: Profits if the price of the underlying asset falls below the strike price minus the premium paid.
2. Short Position
A trader holds a short position when they sell (write) a call or put option.
- Short Call: Profits if the price of the underlying asset remains below the strike price, resulting in the option expiring worthless.
- Short Put: Profits if the price of the underlying asset remains above the strike price, resulting in the option expiring worthless.
Benefits of Trading Options
- Flexibility: Options can be used for various strategies, including hedging, speculation, and income generation.
- Limited Risk for Buyers: The maximum loss for an option buyer is limited to the premium paid.
- Leverage: Options allow traders to control a large position with a relatively small amount of capital.
Risks of Trading Options
- Complexity: Options trading requires a deep understanding of various strategies and their implications.
- Time Decay: The value of options erodes as they approach expiration, impacting long positions.
- Unlimited Risk for Sellers: Sellers (writers) of options face potentially unlimited losses, especially for uncovered (naked) positions.
Non-linear Derivatives
Non-linear derivatives refer to financial instruments whose value does not move in a straightforward linear manner with changes in the price of the underlying asset. Unlike linear derivatives such as forwards or futures, where the payoff is directly proportional to the price movement of the underlying asset, non-linear derivatives exhibit more complex payoffs that may include options, swaps, and more specialized structures. Here are some common types of non-linear derivatives:
Swap Contracts
What Are Swap Contracts?
Swaps are contracts in which two parties agree to exchange cash flows or other financial instruments over a specified period. The most common types of swaps are interest rate swaps, currency swaps, and commodity swaps. India's swap market, though not as large as its Western counterparts, has been growing steadily, with interest rate swaps being particularly prevalent among financial institutions.
Key Characteristics of Swap Contracts
- Customization: Swaps are usually customized contracts tailored to the specific needs of the parties involved.
- Over-the-Counter (OTC): Swaps are typically traded OTC, meaning they are negotiated directly between parties rather than on an exchange.
- Counterparty Risk: The risk that the other party in the swap agreement will default on their obligations.
Types of Swaps
- Interest Rate Swaps: This involves exchanging fixed interest rate payments for floating rate payments (or vice versa).
- Currency Swaps: Involves exchanging principal and interest payments in one currency for principal and interest payments in another currency.
- Commodity Swaps: Involves exchanging cash flows related to commodity prices, such as oil or gold.
Benefits of Trading Swaps
- Customization: Swaps can be tailored to meet the specific needs of the parties involved.
- Hedging: Swaps provide an effective way to hedge against interest rate risk, currency risk, and commodity price risk.
- Flexibility: Swaps offer a wide range of structures and terms to suit different financial strategies.
Risks of Trading Swaps
- Counterparty Risk: The risk that the other party will default on their obligations.
- Complexity: Swaps can be complex and require careful management and understanding.
- Market Risk: Changes in market conditions can impact the value of swap positions.
Conclusion
Derivatives, including forward contracts, futures contracts, options contracts, and swap contracts, play a crucial role in modern financial markets. They provide tools for hedging risk, speculating on future price movements, and capitalizing on hedging opportunities. Understanding the mechanics, benefits, and risks associated with each type of derivative is essential for anyone looking to engage in derivative trading. In India, the National Stock Exchange (NSE) and the Bombay Stock Exchange (BSE) are key players in the derivatives market, offering a wide range of derivative products. As with any financial instrument, thorough research, risk management, and a deep understanding of the underlying asset and market conditions are vital to successful trading in derivatives markets.

What are Derivatives
Within the financial sector, derivatives trading plays an important role in enabling investors to manage risk, speculate on market movements, and potentially enhance returns. While the term "derivatives" might sound complex, their underlying concepts are crucial for anyone looking to delve into financial markets. This guide aims to explain derivatives trading, explaining its basics, types, strategies, and significance in a simple and engaging manner.
What are Derivatives?
Derivatives are financial contracts whose value is derived from the performance of an underlying asset, index, or interest rate. They serve as instruments for investors to either hedge against risks or speculate on future price movements. Unlike stocks or bonds, which represent ownership or debt, derivatives offer a way to bet on or protect against price fluctuations without owning the underlying asset itself.
Types of Derivatives
- Futures Contracts: These agreements obligate the buyer to purchase and the seller to deliver a specific asset at a predetermined future date and price. Futures are commonly used for commodities like oil, gold, or agricultural products.
Example: Crude Oil Futures
- Contract Specifications: 1,000 barrels of crude oil
- Current Price: ₹5,000 per barrel
- Contract Expiry: 3 months from today
Scenario:
- A trader takes a long futures position by agreeing to buy 1,000 barrels of crude oil at ₹5,000 per barrel in 3 months.
- If the price of crude oil rises to ₹6,000 per barrel at expiry, the trader can buy at ₹5,000 and sell at ₹6,000.
- Profit: (₹6,000 - ₹5,000) × 1,000 = ₹1,000,000
- Options Contracts: Options give the buyer the right (but not the obligation) to buy (call option) or sell (put option) an asset at a specified price within a predetermined time frame. They are versatile tools used for hedging or speculating on price movements.
Example: Nifty 50 Call Option
- Underlying Asset: Nifty 50 Index
- Current Nifty 50 Level: 15,000 points
- Strike Price: 16,000 points
- Premium: ₹200 per contract
- Expiry: 1 month from today
Scenario:
- A trader buys a call option with a strike price of 16,000 points.
- If the Nifty 50 index rises to 17,000 points by expiry, the trader can exercise the option to buy at 16,000 and sell at 17,000.
- Profit: (17,000 - 16,000 - 200) = 800 points per contract. If each point is worth ₹100, the profit is 800 × ₹100 = ₹80,000 per contract.
- Swaps: Swaps involve exchanging cash flows or other financial instruments with another party over a set period. Common types include interest rate swaps and currency swaps, used to manage risks associated with fluctuations in interest rates or exchange rates.

Example: Interest Rate Swap
- Party A: Pays fixed interest rate of 5% per annum
- Party B: Pays floating interest rate (LIBOR + 2%) per annum
- Principal Amount: ₹10,000,000
- Duration: 5 years
Scenario:
- Party A and Party B agree to swap interest payments annually for 5 years.
- If the LIBOR rate is 3% at the end of the first year, Party B will pay (3% + 2%) = 5% interest.
- In the first year, both parties pay the same amount (5% of ₹10,000,000), so no net payment is made.
- If LIBOR rises to 4% in the second year, Party B will pay (4% + 2%) = 6% interest.
- Net Payment in Year 2: Party B pays an additional (6% - 5%) of ₹10,000,000 = ₹100,000 to Party A.
- Forwards: Similar to futures contracts but traded over-the-counter (OTC), forwards are customized agreements between two parties to buy or sell an asset at a future date at an agreed-upon price.
Example: Currency Forward
- Agreement: To buy $100,000 in 6 months
- Current Spot Rate: ₹75 per USD
- Forward Rate: ₹77 per USD
Scenario:
- A company enters into a forward contract to buy $100,000 at ₹77 per USD in 6 months.
- If the spot rate at expiry is ₹80 per USD, the company saves money by buying at the forward rate.
- Savings:
- (₹80 - ₹77) × $100,000 = ₹300,000
Why Trade Derivatives?
- Risk Management: Derivatives allow businesses and investors to hedge against adverse price movements in commodities, currencies, interest rates, and more. For instance, a wheat farmer might use futures contracts to lock in a price for their harvest, minimizing the impact of price fluctuations.
- Speculation: Investors can use derivatives to speculate on the direction of asset prices without owning the underlying asset. This ability to leverage positions can amplify potential returns but also increases risks.
- Enhanced Market Efficiency: By enabling participants to manage risks more effectively, derivatives contribute to market liquidity and price discovery, fostering overall market efficiency.
Basic Strategies in Derivatives Trading
- Hedging: This strategy involves taking an offsetting position in a derivative to minimize the impact of adverse price movements in the underlying asset. For example, an airline might hedge against rising fuel costs by buying futures contracts for oil.
- Speculation: Traders use derivatives to capitalize on anticipated price movements. For instance, a trader might buy call options on a stock if they expect its price to rise, potentially yielding significant profits if the prediction is correct.
- Arbitrage: Arbitrageurs exploit price differentials between related assets or markets to make risk-free profits. This strategy relies on quick execution and market inefficiencies.
Risks Associated with Derivatives Trading
While derivatives offer opportunities for profit and risk management, they also carry inherent risks:
- Leverage Risk: Derivatives often involve trading on margin, which amplifies both potential gains and losses.
- Market Risk: Prices of underlying assets can fluctuate unexpectedly, affecting the value of derivatives positions.
- Counterparty Risk: OTC derivatives expose parties to the risk of default by their counterparties, necessitating careful credit assessment.
Conclusion
Derivatives trading is a powerful tool in the financial markets, providing avenues for risk management, speculation, and market efficiency. Understanding the basics of futures, options, swaps, and forwards equips investors with the knowledge to navigate these instruments effectively. Whether you're a seasoned investor or a newcomer to finance, grasping the fundamentals of derivatives trading is essential for smart decision-making in today's interconnected global economy.
In essence, derivatives are not just financial instruments but essential components of modern market dynamics, shaping how risks are managed and opportunities are seized in the ever-evolving landscape of global finance.
Unlock trading potential with swastika!

What is Nifty and Sensex?
Introduction
Nifty and Sensex are India's primary stock market indices, representing the performance of the National Stock Exchange (NSE) and the Bombay Stock Exchange (BSE) respectively. They are crucial for investors to measure the health and trends of the stock market.
What is Nifty?
Nifty, also known as the Nifty 50, is India's leading index of the National Stock Exchange (NSE). Launched in 1996, it represents the weighted average of the 50 largest and most liquid stocks traded on the NSE, making it a crucial barometer of the Indian capital markets and a reflection of the overall market performance. The Nifty 50 includes companies across various sectors, ensuring a comprehensive view of the market.
In addition to the Nifty 50, the NSE offers several other indices to provide a broader and more detailed understanding of market dynamics:
- Nifty 100: This index includes the top 100 companies listed on the NSE in terms of market capitalization and liquidity. It encompasses all the companies in the Nifty 50 as well as 50 additional companies, providing a wider perspective on the large-cap segment of the market.
- Nifty 500: As the name suggests, the Nifty 500 index includes the top 500 companies listed on the NSE, covering approximately 96% of the market capitalization of all the companies listed on the exchange. This index offers a comprehensive overview of the Indian equity market, including large, mid, and small-cap companies.
- Nifty Next 50: This index represents the performance of the 50 companies that rank just below the Nifty 50 in terms of market capitalization and liquidity. It serves as a benchmark for mid-cap stocks and provides insights into the potential candidates for inclusion in the Nifty 50.
- Nifty Midcap 100: This index captures the performance of the top 100 mid-cap companies listed on the NSE, offering insights into the mid-cap segment, which often includes companies with significant growth potential.
- Nifty Smallcap 100: This index comprises the top 100 small-cap companies listed on the NSE, focusing on the smaller and emerging companies in the market.
Key Features:
- Representation: Tracks 50 large-cap companies across various sectors.
- Market Capitalization: Based on free-float market capitalization.
- Sectoral Diversity: Includes sectors like IT, finance, energy, etc.
Recent Developments
The NSE has recently introduced a new index focused on the electric vehicle (EV) sector, reflecting this industry's growing importance and potential. This index aims to capture the performance of companies involved in the manufacturing, development, and supply chain of electric vehicles, highlighting the shift towards sustainable and eco-friendly transportation solutions.

Sectoral Weights in the Nifty 50
The Nifty 50 index is diversified across various sectors, with the top five sectors contributing significantly to its overall performance. As of the latest data, the sectoral weightage in the Nifty 50 is as follows:
- Financial Services: This sector has the highest weightage in the Nifty 50, reflecting the dominance of banks, non-banking financial companies (NBFCs), and insurance companies in the Indian market.
- Information Technology (IT): The IT sector, comprising major software services and technology companies, holds a significant portion of the index, underscoring India's strength in the global IT landscape.
- Consumer Goods: This sector includes companies involved in producing and distributing consumer products, both durable and non-durable, highlighting the importance of consumer demand in driving economic growth.
- Oil & Gas: The presence of leading oil and gas companies in the index signifies the critical role of energy resources in the Indian economy.
- Pharmaceuticals: The pharmaceutical sector's weightage reflects India's position as a major player in the global pharmaceuticals and healthcare industry.

Source - https://scripbox.com/pf/what-is-nifty/
What is Sensex?
Sensex or Sensitive Index, is India's benchmark index of the Bombay Stock Exchange (BSE). Launched in 1986, it is one of the oldest stock market indices in the country. Sensex comprises 30 well-established and financially sound companies across various sectors. These companies are selected based on their market capitalization and liquidity, representing the overall performance and health of the stock market.
Key Features:
- Historical Significance: Established in 1986, it's one of India’s oldest indices.
- Market Capitalization: Based on free-float market capitalization.
- Sectoral Coverage: Represents various key sectors of the economy.
Differences Between Nifty and Sensex
- Number of Stocks: Nifty has 50 stocks; Sensex has 30.
- Stock Exchange: Nifty is from NSE; Sensex is from BSE.
- Calculation Method: Both use free-float market capitalization but have different compositions.
Importance of Nifty and Sensex
- Market Barometer: Reflect overall market trends and investor sentiment.
- Benchmark: Used for comparing portfolio and mutual fund performances.
- Economic Indicator: Measure economic health and sectoral performance.
How Are They Calculated?
Both indices use free-float market capitalization, considering only the shares available for public trading. The formula involves stock prices and the number of publicly traded shares.
Why Follow Nifty and Sensex?
- Investment Decisions: Make better investment choices based on market trends.
- Market Trends: Provide insights into economic health and sector performance.
- Risk Management: Help in assessing market volatility and managing risk.
Detailed Aspects
- Sector Representation
Both indices cover diverse sectors. Nifty includes companies from sectors such as IT, finance, consumer goods, and energy. Sensex also represents a wide array of sectors, providing a holistic view of the market.
- Market Capitalization and Free-Float Methodology
Market capitalization is the total market value of a company's outstanding shares. The free-float methodology calculates market cap by excluding promoter and insider holdings, focusing only on shares available for public trading.
The formula for calculating the free float market capitalization is:
Free-Float Market Capitalization = Share Price × Number of Free-Float Shares
To determine the number of free-float shares:
Free-Float Shares = Total Outstanding Shares − Restricted Shares
Restricted shares include those held by promoters, insiders, and other strategic investors that are not available for public trading.
- Historical Performance
Nifty and Sensex have shown significant growth over the years, reflecting the overall economic development of India. Historical performance data can help investors identify long-term trends and investment opportunities.
- Economic Indicators
These indices are not only indicators of stock market performance but also reflect the economic conditions of the country. They are influenced by various factors, including economic policies, geopolitical events, and global market trends.
Practical Tips for Investors
- Regular Monitoring: Keep an eye on the daily movements of Nifty and Sensex.
- Diversification: Use these indices to diversify your investment portfolio.
- Long-Term Trends: Focus on long-term trends rather than short-term fluctuations.
- Better Decisions: Make investment decisions based on comprehensive market research and analysis.
Conclusion
Nifty and Sensex are essential tools for anyone involved in the Indian stock market. They provide a snapshot of market trends, economic health, and sectoral performances, helping investors make informed decisions. Understanding these indices can enhance your investment strategies and lead to better financial outcomes.

Understanding Ex Dividends in the Indian Share Market
Dividends are a way for companies to share their profits with people who own their stock. But to receive a dividend pay-out, timing is key. Let’s break down what dividends are and the important dates you need to know if you're investing in the Indian stock market.
What is a Dividend?
A dividend is a payment made by a company to its shareholders from its profits. When a company grows and decides to go public, it allows people to buy its shares through an Initial Public Offering (IPO). Once people buy shares, they become shareholders and can receive dividends from the company’s profits. These payments are often made regularly, such as every three months or once a year.
What is the Ex-Dividend Date?
The ex-dividend date is an important date for anyone buying stocks. It’s the deadline by which you must own the stock to get the next dividend payment. If you buy the stock on or after this date, you won't get the upcoming dividend; the previous owner will.
- Understanding the Ex-Dividend Date: This is the first business day after which new stock buyers become ineligible for the upcoming dividend pay-out.
- The Deadline: If you purchase a stock before the ex-dividend date, you'll be included in the company's record of shareholders who receive the dividend.
- Buying After the Ex-Dividend Date? No Dividend for You: Purchasing shares on or after the ex-dividend date means you won't be eligible for the upcoming pay-out. The seller in this case will receive the dividend.
So in simple words, If you purchase a stock before the ex-dividend date, you're considered a shareholder of record. This means you'll be entitled to receive the next dividend pay-out.
If you buy the stock on or after the ex-dividend date, you won't be eligible for the upcoming dividend. The seller in this case will receive the pay-out.
How it Affects Share Prices
When a stock goes ex-dividend, its price usually drops by the amount of the dividend. For example, if a company pays a ₹10 dividend and the stock price was ₹1000, it might drop to ₹990 on the ex-dividend date. This drop happens because the dividend is no longer included in the stock price.
Difference between the Ex-Dividend Date and the Record Date
- Ex-Dividend Date: The last day you can buy the stock to be eligible for the next dividend. If you buy the stock on or after this date, you won’t get the next dividend.
- Record Date: The date the company checks its records to see who owns the stock and is eligible for the dividend. To be on this list, you need to have bought the stock before the ex-dividend date due to the two-day settlement period (T+2).
Key Dates for Dividends
There are three key dates to remember when it comes to dividends:
- Ex-Dividend Date: The last day to buy the stock to get the next dividend.
- Record Date: The day the company looks at its records to see who gets the dividend.
- Payment Date: The day the company actually pays out the dividend to shareholders.
Conclusion
Knowing about dividends and the important dates can help you make better decisions when investing in stocks. The date is especially important because it determines whether you get the next dividend payment. By keeping track of these dates, you can manage your investments more effectively.

Understanding Dividends in the Indian Share Market
Dividends are a way for companies to share their profits with people who own their stock. But to receive a dividend pay-out, timing is key. Let’s break down what dividends are and the important dates you need to know if you're investing in the Indian stock market.
What is a Dividend?
A dividend is a payment made by a company to its shareholders from its profits. When a company grows and decides to go public, it allows people to buy its shares through an Initial Public Offering (IPO). Once people buy shares, they become shareholders and can receive dividends from the company’s profits. These payments are often made regularly, such as every three months or once a year.
What is the Ex-Dividend Date?
The ex-dividend date is an important date for anyone buying stocks. It’s the deadline by which you must own the stock to get the next dividend payment. If you buy the stock on or after this date, you won't get the upcoming dividend; the previous owner will.
- Understanding the Ex-Dividend Date: This is the first business day after which new stock buyers become ineligible for the upcoming dividend pay-out.
- The Deadline: If you purchase a stock before the ex-dividend date, you'll be included in the company's record of shareholders who receive the dividend.
- Buying After the Ex-Dividend Date? No Dividend for You: Purchasing shares on or after the ex-dividend date means you won't be eligible for the upcoming pay-out. The seller in this case will receive the dividend.
So in simple words, If you purchase a stock before the ex-dividend date, you're considered a shareholder of record. This means you'll be entitled to receive the next dividend pay-out.
If you buy the stock on or after the ex-dividend date, you won't be eligible for the upcoming dividend. The seller in this case will receive the pay-out.
How it Affects Share Prices
As an example, a company that is trading at 60 per share declares a 2 dividend on the announcement date. As the news becomes public, the share price may increase by 2 and hit 62.
If the stock trades at 63 one business day before the ex-dividend date. On the ex-dividend date, it's adjusted by 2 and begins trading at 61 at the start of the trading session on the ex-dividend date, because anyone buying on the ex-dividend date will not receive the dividend.
Difference between the Ex-Dividend Date and the Record Date
- Ex-Dividend Date: The last day you can buy the stock to be eligible for the next dividend. If you buy the stock on or after this date, you won’t get the next dividend.
- Record Date: The date the company checks its records to see who owns the stock and is eligible for the dividend. To be on this list, you need to have bought the stock before the ex-dividend date due to the two-day settlement period (T+2).
Key Dates for Dividends
There are three key dates to remember when it comes to dividends:
- Ex-Dividend Date: The last day to buy the stock to get the next dividend.
- Record Date: The day the company looks at its records to see who gets the dividend.
- Payment Date: The day the company actually pays out the dividend to shareholders.
Conclusion
Knowing about dividends and the important dates can help you make better decisions when investing in stocks. The date is especially important because it determines whether you get the next dividend payment. By keeping track of these dates, you can manage your investments more effectively.
.avif)
Types of Orders
What Is an Order?
An order is an instruction given to a broker or brokerage firm to buy or sell a security for an investor. It's the basic way to trade in the stock market. Orders can be placed by phone, online, or through automated systems and algorithms. Once an order is placed, it goes through a process to be completed.
There are different types of orders, allowing investors to set conditions like the price at which they want the trade to happen or how long the order should stay active. These conditions can also determine whether an order is triggered or cancelled based on another order.
Types of Orders
Market Order
A market order is an instruction to buy or sell a stock at the current price available in the market. With a market order, the investor doesn't control the exact price they pay or receive—the market decides the price. In a fast-moving market, the price can change quickly, so you might end up paying more or receiving less than expected.
For example, if an investor wants to buy 100 shares of a stock, they will get those 100 shares at whatever the current asking price is at that moment. If the price is ₹500 per share, they’ll buy 100 shares for ₹500 each. However, if the price changes before the order is executed, they might pay a different amount.
Limit Order
A limit order is an instruction to buy or sell a stock at a specific price or better. This allows investors to avoid buying or selling at a price they don't want. If the market price doesn't match the price set in the limit order, the trade won't happen. There are two types of limit orders: a buy limit order and a sell limit order.
Buy Limit Order:
A buy limit order is placed by a buyer, specifying the maximum price they are willing to pay. For example, if a stock is currently priced at ₹900, and an investor sets a buy limit order for ₹850, the order will only go through if the stock price drops to ₹850 or low
Sell Limit Order:
A sell limit order is placed by a seller, specifying the minimum price they are willing to accept. For example, if a stock is currently priced at ₹900, and an investor sets a sell limit order for ₹950, the order will only go through if the stock price rises to ₹950 or higher.
Stop Order
A stop order, also known as a stop-loss order, is a trade order that helps protect an investor from losing too much money on a stock. It automatically sells the stock when its price drops to a certain level. While stop orders are commonly used to protect a long position (where the investor owns the stock), they can also be used with a short position (where the investor has sold a stock they don't own yet). In that case, the stock would be bought if its price rises above a certain level.
Example for a Long Position:
Imagine an investor owns a stock currently priced at ₹1,000. They're worried the price might drop, so they place a stop order at ₹800. If the stock price falls to ₹800, the stop order will trigger, and the stock will be sold. However, the stock might not sell exactly at ₹800—it could be sold for less if the price is dropping quickly.
Example for a Short Position:
If an investor has shorted a stock at ₹1,000 and doesn't want to lose too much if the price rises, they might set a stop order at ₹1,200. If the price goes up to ₹1,200, the stop order will trigger, and the investor will buy the stock at that price (or higher if the price is rising quickly) to cover their short position.
To avoid selling at a much lower price than expected, investors can use a stop-limit order, which sets both a stop price and a minimum price at which the order can be executed.
Stop-limit order
A stop-limit order is a trade order that combines features of both a stop order and a limit order. It involves setting two prices: the stop price and the limit price. When the stock reaches the stop price, the order becomes a limit order. This means the stock will only be sold if it can meet or exceed the limit price, giving the investor more control over the selling price.
Example:
Let's say an investor owns a stock currently priced at ₹2,500. They want to sell the stock if the price drops below ₹2,000, but they don't want to sell it for less than ₹1,900. To do this, the investor sets a stop-limit order with a stop price of ₹2,000 and a limit price of ₹1,900.
If the stock price falls to ₹2,000, the stop order triggers, but the stock will only be sold if it can get at least ₹1,900 per share. If the price drops too quickly and falls below ₹1,900 before the order can be executed, the stock won’t be sold until it reaches ₹1,900 or higher.
In contrast, a regular stop order would sell the stock as soon as it hits ₹2,000, even if the price continues to fall rapidly and ends up selling for less. The stop-limit order gives the investor more control over the price, but there’s a chance the stock won’t sell if the limit price isn’t met.
Trailing stop order
A trailing stop order is a type of stop order that adjusts automatically based on the stock's price movement. Instead of setting a specific price, the trailing stop is based on a percentage change from the stock's highest price. This helps protect profits while allowing the stock to rise in value. If the stock's price falls by the set percentage, the order is triggered and the stock is sold.
Example for a Long Position:
Imagine an investor buys a stock at ₹1,000 and sets a trailing stop order with a 20% trail. If the stock price goes up to ₹1,200, the trailing stop will automatically move up to ₹960 (20% below ₹1,200). If the stock price then drops to ₹960 or lower, the trailing stop order will trigger, and the stock will be sold.
Example for a Short Position:
If an investor has shorted a stock at ₹1,000 and sets a trailing stop of 10%, the stop price would move down as the stock price falls. If the stock price rises by 10% from its lowest point, the trailing stop order will trigger, and the stock will be bought to cover the short position.
The trailing stop order allows the investor to lock in gains as the stock price moves favorably, while still providing protection if the market turns.
Immediate or Cancel (IOC) order
An Immediate or Cancel (IOC) order is a type of stock order that must be executed immediately. If the full order cannot be filled right away, whatever portion can be filled will be completed, and the rest will be canceled. If no part of the order can be executed immediately, the entire order is canceled.
Example:
Suppose an investor places an IOC order to buy 500 shares of a stock at ₹1,000 per share. If only 300 shares are available at ₹1,000 right away, the IOC order will purchase those 300 shares, and the remaining 200 shares will be canceled. If no shares are available at ₹1,000 immediately, the entire order will be canceled.
Good Till Cancelled (GTC) order
A Good Till Cancelled (GTC) order is a type of stock order that stays active until you choose to cancel it. Unlike other orders that expire at the end of the trading day, a GTC order remains open until you either cancel it or it gets executed. However, most brokerages set a limit on how long you can keep a GTC order open, usually up to 90 days.
Example:
Let's say an investor wants to buy a stock at ₹500, but the current price is ₹600. They place a GTC order to buy 100 shares at ₹500. This order will stay active until the stock price drops to ₹500 and the order is filled, or until the investor cancels the order. If the price never drops to ₹500 and the investor doesn't cancel the order, it will automatically expire after 90 days (or whatever time limit the brokerage sets).
Good 'Till Triggered (GTT) order
A Good 'Till Triggered (GTT) order is similar to a Good 'Til Canceled (GTC) order but with a key difference: a GTT order only becomes active when a specified trigger condition is met. Once the trigger price is reached, the order is placed in the market. If the trigger price is not reached, the order stays inactive.
Example:
Imagine an investor wants to buy a stock currently priced at ₹600, but only if it drops to ₹550. They set a GTT order with a trigger price of ₹550. If the stock price falls to ₹550, the order is activated and placed in the market. If the price never drops to ₹550, the order remains inactive until it reaches the trigger price or the investor cancels it.
GTT orders can also have a time limit, so if the trigger price isn’t reached within a certain period, the order will expire.
Conclusion
In the stock market, an order is a fundamental instruction to buy or sell a security, tailored to an investor's strategy and market conditions. The various types of orders—such as market, limit, stop, stop-limit, trailing stop, IOC, GTC, and GTT—offer flexibility to manage price, timing, and risk. Understanding these order types empowers investors to execute trades more effectively, ensuring alignment with their financial goals and risk tolerance.
Learn how to optimize your trades and manage risk with Swastika!

.avif)
.avif)

.avif)