Information


Has the Midcap–Smallcap Panic Finally Ended? Signs the Market May Have Formed a Bottom
.webp)

Key Takeaways
- Panic selling in midcap and smallcap indices has eased, showing early signs of bottom formation.
- Valuations have cooled, SIP flows remain steady, and regulatory interventions have stabilised sentiment.
- Institutional buying and volatility compression signal returning confidence.
- Investors should stay selective, focusing on quality, earnings visibility, and balance-sheet strength.
- Swastika Investmart’s research-driven approach can help navigate this recovery phase.
The recent sell-off in India’s midcap and smallcap space sent shockwaves through the market. After months of outperformance, these segments corrected sharply as investors reacted to frothy valuations, regulatory caution from SEBI, and global uncertainty.
But the big question now is: Has the panic finally ended? There are early signs that the market may be stabilising — and possibly forming a short-term bottom.
Let’s break down what’s happening, what signals matter, and how investors should position themselves.
What Triggered the Panic in Midcap and Smallcap Stocks?
The correction didn’t happen in isolation. Multiple triggers set the tone:
1. Valuation Excesses
Midcaps and smallcaps had rallied far beyond their historical averages. Many stocks were trading at 30–50% premiums despite modest earnings visibility.
This stretched the risk-reward equation, making the segment vulnerable to a correction.
2. SEBI’s Risk Alert
SEBI issued cautionary comments regarding overheating in smaller companies, urging mutual funds to reassess risk frameworks.
While not a direct intervention, it created a sentiment shock, leading to profit-booking and fund rebalancing.
3. Global Uncertainty
Concerns over US bond yields, geopolitical tensions, and FII outflows added fuel to the fire. With risk-off sentiment globally, smallcaps took the hardest hit.
4. Mutual Fund Rebalancing
Many schemes faced pressure to rebalance portfolios due to size restrictions and liquidity management rules, further accelerating the decline.
Is the Midcap–Smallcap Bottom In? Key Signs of Stabilisation
Now, the dust is beginning to settle — and several indicators suggest a bottom may be forming.
1. Selling Pressure Has Eased
The pace of declines has slowed significantly. Earlier, deep cuts of 4–6% were common in a day; now, volatility has tapered.
This cooling-off reflects reduced panic and more measured trading activity.
2. Volatility Compression
The India VIX remains within a controlled range, signalling improving risk appetite. Historically, midcap recoveries begin when volatility stabilises first.
3. Steady SIP Inflows
Despite sharp corrections, SIP contributions hit all-time highs, showing unwavering domestic investor faith.
Consistent inflows act as shock absorbers, reducing the likelihood of prolonged downturns.
4. Institutional Buying Is Back
Domestic institutional investors have started nibbling into quality smallcap and midcap names—especially in sectors like capital goods, defense, manufacturing, and financial services.
When institutions buy during corrections, it often marks the beginning of base formation.
5. Earnings Have Held Up
Indian corporates have delivered stable earnings. Several smaller companies reported healthy margins, strong order books, or improved cash flows — not characteristics of a market in deep distress.
6. Regulatory Clarity from SEBI
SEBI’s recent stance has shifted from caution to structured monitoring. Clear guidelines always reduce fear-driven volatility.
Once the overhang of regulatory uncertainty eases, quality stocks typically rebound sooner.
7. Historical Cycles Support the Trend
Past midcap–smallcap corrections (2013, 2018, 2020) show a similar pattern:
- Sharp decline
- Panic selling
- Sentiment stabilisation
- Slow accumulation phase
- Sectoral rotation
- Recovery
Markets seem to be entering the accumulation zone now.
What Should Investors Do Now? A Practical Guide
A bottoming market can be a golden opportunity — but only with the right strategy.
1. Focus on Quality Over Momentum
Companies with:
- Low leverage
- Consistent cash flows
- Strong promoters
- Predictable earnings
… are likely to lead the recovery.
2. Avoid “Penny Move” Traps
A rising tide won’t lift all boats. Many questionable smallcaps jumped in the rally but lack fundamentals.
Stay selective and avoid speculative bets.
3. Use SIPs and STPs Smartly
Instead of trying to catch the exact bottom, stagger your entry over 4–6 months.
This cushions volatility and improves long-term returns.
4. Look at Sectors with Structural Tailwinds
Segments showing resilience include:
- Capital goods
- Manufacturing and industrials
- Financial services
- Defense
- Railways
- Renewables
- Building materials
These sectors continue to receive policy support and strong domestic demand.
5. Review Portfolio Allocation
If your equity allocation has fallen due to the correction, rebalancing can boost long-term compounding.
6. Use Research-backed Tools
Platforms with robust screening tools, research reports, and advisory support can help you avoid mistakes.
This is where a trusted financial partner becomes invaluable.
Why Swastika Investmart Can Help You Navigate This Phase
Swastika Investmart, a SEBI-registered financial services provider, offers:
- In-depth equity research backed by data and market experience
- Advanced screening and analytics tools
- Dedicated customer support for investors across segments
- Tech-enabled platforms for effortless trading and investing
- Investor education initiatives designed to enhance financial literacy
In volatile markets, having a research-driven approach matters more than ever.
👉 Open an account today:
https://trade.swastika.co.in/?UTMsrc=HasTheMidcapSmallcapPanicFinallyEnded
FAQs
1. Are midcap and smallcap stocks safe to invest in now?
They are safer than during the peak, but selectivity is essential. Focus on companies with strong fundamentals.
2. Has the market definitely bottomed?
Not guaranteed — but key indicators show stabilisation and early signs of accumulation.
3. Should I stop SIPs during a correction?
No. Corrections increase long-term returns by lowering average cost.
4. Which sectors look promising after this correction?
Manufacturing, capital goods, financial services, and defense are showing resilience.
5. How long do recoveries usually take?
Historically, midcap–smallcap recoveries take 3–6 months to gain momentum after major corrections.
Conclusion
The midcap–smallcap panic appears to be cooling, with several signals pointing towards a potential bottom. While uncertainty remains, disciplined investing, quality stock selection, and data-backed decisions can turn this volatility into opportunity.
If you’re looking to navigate this phase with expert guidance, Swastika Investmart’s research-driven tools and advisory support can help you make informed decisions.

Nifty’s Santa Rally Pattern: Is December 20–Jan 5 Still a High-Probability Window for Returns?
Key Takeaways
- Historical data shows Nifty has delivered an 80% win rate during the Santa Rally window.
- Liquidity, festive spending, and global risk appetite often support this pattern.
- Not all years are positive—macros like FIIs, crude oil, and Fed policy matter.
- This year’s setup depends on domestic flows, RBI stance, and global volatility.
- Investors should stay data-driven and avoid emotional trading during year-end rallies.
Nifty’s Santa Rally Pattern: Is December 20–Jan 5 Still a High-Probability Window for Returns?
Every December, a familiar question resurfaces among Indian market participants:
“Will we see a Santa Rally this year?”
The Santa Rally—a phase between December 20 and January 5—is historically known for delivering strong positive returns in global equity markets. While the concept originated from US markets, the pattern has quietly taken shape in India as well.
And the numbers speak for themselves.
Over the last 20 years, Nifty has shown an 80% win rate during this period. That means in 16 out of 20 years, markets ended flat or positive.
Before we explore whether this year can repeat history, let’s look at the Table.
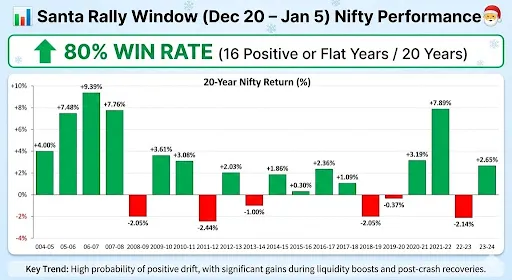
The Table highlights how often Nifty has delivered gains during this specific trading window. Notably big gains were observed in years following liquidity expansion phases or post-correction rebounds.
Some standout years include:
- 2005–06: +9.33%
- 2020–21: +7.89%
- 2006–07: +7.76%
Even in difficult cycles such as 2011–12 or 2015–16, the dips remained relatively contained.
The data hints at something deeper:
Investor behaviour, liquidity conditions, and institutional rebalancing consistently influence year-end trends.
Why Does the Santa Rally Happen in India?
1. Global Risk-On Sentiment
International markets often rally on:
- Year-end portfolio rebalancing
- Lower institutional trading volumes
- Festive optimism and reduced volatility
Nifty mirrors this behaviour, especially when FIIs turn buyers.
2. Domestic Liquidity Dominance
India’s rising SIP culture—now over ₹20,000 crore per month—creates a dependable liquidity cushion. Even when FIIs stay cautious, domestic institutions and retail flows provide strong support.
3. Corporate and Macro Visibility
By December:
- Most earnings downgrades are factored in
- Q3 outlook becomes clearer
- Global central bank signals stabilize
This reduces uncertainty, which markets love.
4. Event-Light Period
With major policy decisions and earnings behind us, markets enter a quieter news cycle—ideal for rallies.
Will Nifty See a Santa Rally This Year? Key Factors to Watch
Whether the Santa Rally returns this year depends on several moving parts.
1. FII and DII Behaviour
FIIs have been extremely sensitive to:
- US bond yields
- Dollar strength
- Emerging market valuations
If global yields cool and India remains the preferred EM destination, FIIs could drive a meaningful rally.
Meanwhile, DIIs continue to provide steady inflows regardless of global conditions.
2. RBI Policy Tone
A neutral-to-dovish stance from the RBI generally:
- Supports banking and rate-sensitive sectors
- Encourages broader market risk-taking
If inflation stays within comfort levels, the backdrop improves for a year-end run-up.
3. Crude Oil Volatility
For India, crude oil is the single biggest macro swing factor.
A stable or falling crude environment increases the probability of a Santa Rally.
4. Global Market Mood
If the US markets — especially S&P 500 and Nasdaq — carry momentum into the year-end, Nifty tends to follow suit.
Historically, India rarely rallies alone.
5. Technical Setup
Nifty’s technical structure going into December matters:
- Higher highs support continuation
- Consolidation ranges often lead to a breakout
- Overbought zones may limit upside
A neutral–positive structure improves the setup.
What Should Investors Do During a Potential Santa Rally?
1. Avoid Chasing Short-Term Euphoria
While Santa Rallies are common, relying on them as guaranteed is risky.
2. Keep Focus on High-Quality Stocks
Large caps tend to perform better due to stable liquidity.
3. Use Corrections to Accumulate
If volatility emerges, staggered buying helps reduce timing risk.
4. Don’t Ignore Global Triggers
Fed commentary, dollar index movement, and geopolitical risks can break the trend quickly.
5. Use Tools and Advisory Support
Platforms like Swastika Investmart, with SEBI-registered research and actionable insights, help investors stay aligned with data—not emotions.
FAQs
1. Does the Santa Rally always work in India?
No. While Nifty has delivered positive or flat returns in 80% of the last 20 years, external shocks or high valuations can offset historical patterns.
2. Why does Nifty usually rise between Dec 20 and Jan 5?
A mix of lower volatility, festive sentiment, portfolio rebalancing, and strong domestic flows often lifts markets.
3. Which sectors benefit the most during Santa Rallies?
Historically, banking, autos, consumer, and large-cap IT have shown stronger year-end momentum.
4. Is it safe to invest only for the Santa Rally?
Short-term bets are riskier. Long-term investors should view the rally as an opportunity, not a strategy.
5. What can break the Santa Rally this year?
Unexpected Fed remarks, Middle-East tensions, crude spikes, or heavy FII selling may cap returns.
Conclusion
The Santa Rally pattern in Nifty remains one of the most intriguing behavioural trends in the Indian market. Past data provides confidence—but not certainty. Whether this year repeats the 80% positive trend will depend on macro stability, global liquidity, and the market’s risk appetite.
For investors, the smartest approach is to stay data-driven and avoid knee-jerk decisions. Platforms like Swastika Investmart offer research-backed insights, strong customer support, and tech-enabled investing tools to help you navigate market opportunities confidently.
.webp)
Silver Supercycle 2025: Could Prices Really Shoot Up to ₹2 Lakh?
Key Takeaways
- Global supply constraints and rising industrial demand are reviving talks of a 2025 silver supercycle.
- Silver’s dual nature—industrial and precious metal—makes it highly sensitive to macro cycles.
- A ₹2 lakh/kg target is aggressive, but not impossible if inflation, clean energy demand, and geopolitical risks rise.
- Indian investors should track import duty policies, rupee movement, and global ETF flows.
- Silver remains a high-volatility asset; diversification is essential.
Silver Supercycle 2025: Could Prices Really Shoot Up to ₹2 Lakh?
Silver has always been the quieter cousin of gold—less flashy, more volatile, and often overlooked until a big move happens. But the conversation is heating up again. Several analysts and commodity strategists believe that 2025 could be the start of a major silver supercycle, one strong enough to push prices to ₹2,00,000 per kg in India.
Is this realistic or just another hype cycle?
Let’s break it down using real-world data, global trends, and India-specific context.
Why “Silver Supercycle 2025” Is Gaining Attention
A supercycle typically refers to a long, sustained rise in commodity prices caused by structural demand and limited supply. Historically, metals like copper, iron ore, and oil have experienced supercycles during periods of global expansion.
Silver is now entering a similar setup because of three major forces:
1. Exploding Industrial Demand
Silver is a critical input in:
- Solar panels
- Electric vehicles
- 5G devices
- Semiconductor manufacturing
- AI-driven hardware
- Medical equipment
The Solar Energy Industries Association estimates a gigantic jump in photovoltaic demand, potentially making silver one of the fastest-growing industrial metals in 2025.
2. Global Liquidity and Possible Rate Cuts
If the US Federal Reserve and other central banks move toward easing monetary policy, precious metals like silver typically rise due to:
- Lower real yields
- Weaker dollar
- Higher speculative interest
We saw this pattern during 2008–2011, when silver surged over 400%.
3. Tightening Supply and Mining Challenges
Mine production has lagged behind demand for years. Several major silver miners have reported:
- Lower ore grades
- Higher extraction costs
- Regulatory hurdles in Latin America
This mismatch between supply and demand is a classic trigger for a supercycle.
Can Silver Realistically Touch ₹2 Lakh per Kg in 2025?
Let’s look at the numbers.
Silver currently trades at approximately:
- ₹70,000–₹80,000 per kg (India)
- $22–$25 per ounce globally
For silver to reach ₹2,00,000 per kg, we would need:
- A 150%–180% price rise globally
- A stable to moderately weakening rupee
- Strong investment flows in global ETFs
- A surge in industrial consumption
While this is not the base-case expectation for most analysts, it is possible under a high-stress macro environment, such as:
- A global recession
- Major geopolitical escalation
- Aggressive central bank rate cuts
- Supply chain breakdowns
- A massive shift to renewable energy
Think of it this way:
Silver has rallied 10x in past cycles, most notably between 2003–2011. When silver runs, it really runs.
But it also corrects sharply.
This is why investors need a balanced view, not blind optimism.
How a Silver Supercycle Would Impact Indian Markets
India is one of the world’s largest consumers of silver—both industrially and as jewellery. The effects of a supercycle would be mixed:
1. Higher Import Bills
India imports most of its silver. A spike to ₹2 lakh/kg would put upward pressure on:
- Trade deficit
- Current account balance
- Rupee stability
This could indirectly influence stock markets via FII sentiment.
2. Boost for Solar and EV Stocks
Domestic companies in:
- renewable energy
- power equipment
- battery technology
- specialty chemicals
may face cost pressure but benefit from rising demand.
3. Increased Retail Participation
Indians traditionally buy silver during festivals and weddings. A price boom could push demand toward:
- Silver ETFs
- Silver ETPs
- Digital silver
- MCX silver derivatives
This aligns with India’s wider shift to formal financial instruments.
4. Impact on Jewellers
Jewellery players may see mixed results:
- Higher inventory values
- Lower retail demand
- Better margins if priced strategically
What Indian Investors Should Watch in 2025
Before assuming a supercycle, track these triggers:
1. RBI Policy and Rupee Movement
A weakening rupee can amplify silver prices far more than global moves.
2. India’s Import Duties
Any change in customs duty on silver impacts price directly.
3. MCX Volume Trends
Rising volumes can indicate rising speculative interest.
4. Global Silver ETF Flows
Institutional money is the real driver of supercycles.
5. Industrial Demand Data from China
China consumes nearly 50% of global silver. Its industrial recovery will be crucial.
FAQs
1. What is a silver supercycle?
It refers to a long-term surge in silver prices driven by strong structural demand and tight supply conditions across the global market.
2. Can silver really hit ₹2,00,000 per kg?
It’s an optimistic target. Achievable only if global liquidity, industrial demand, and supply disruptions align. Investors should consider it a possibility, not a certainty.
3. Is silver a better investment than gold in 2025?
Silver is more volatile but can deliver higher percentage returns during bull cycles. Gold, on the other hand, is more stable and defensive.
4. How should Indian investors buy silver?
Silver ETFs, MCX futures, and digital silver offer regulated and transparent access. Physical silver carries storage and purity risks.
5. Is now the right time to enter silver?
It depends on your risk profile. A staggered approach or SIP-style buying may help manage volatility.
Conclusion
The idea of a Silver Supercycle 2025 is exciting—and in many ways, credible. Industrial demand from solar and EVs is rising sharply, supply constraints are real, and global monetary cycles may turn favourable. But the jump to ₹2 lakh per kg requires an extraordinary combination of global events.
For Indian investors, the key is to stay informed, avoid speculative bets, and balance silver exposure within a diversified portfolio.
If you want expert guidance, market insights, and research-backed strategies, Swastika Investmart’s SEBI-registered advisory team and tech-enabled platforms can help you navigate commodity trends with confidence.
Fed Cuts Rates to 3.50%–3.75%: How Will This Impact Indian Stock Markets and Nifty?
Key Takeaways
- The US Federal Reserve has cut rates to 3.50%–3.75%, signaling a shift toward easing.
- Indian markets may see short-term volatility, but medium-term sentiment remains constructive.
- FIIs could increase flows into emerging markets if the dollar weakens.
- Rate-sensitive sectors in India—banks, NBFCs, real estate, autos—may see improved momentum.
- Nifty’s direction will depend on inflation, crude oil, domestic earnings, and global liquidity.
Fed Cuts Rates to 3.50%–3.75%: How Will This Impact Indian Stock Markets and Nifty?
The US Federal Reserve’s decision to cut interest rates to 3.50%–3.75% marks one of the most important policy shifts of the year. Whenever the Fed moves, global markets listen. And for India — now one of the world’s most influential emerging market economies — such a decision has both direct and indirect consequences.
Investors often wonder:
Will this boost Nifty?
Will FIIs return?
Will the market rally or consolidate?
This blog simplifies the answer with data-driven insights, Indian context, and real-world examples — written in a clear, natural, and professional style.
Why Did the Fed Cut Rates? A Quick Look at the Global Context
The Fed’s move comes on the back of a slowing US economy, easing inflation, and a need to support consumption and business borrowing. This pivot toward rate cuts signals:
- A softer interest-rate environment going forward
- Higher global liquidity
- A potential reversal of the strong US dollar trend
- Lower yields on US treasury bonds
Any of these factors can quickly alter the risk appetite of global investors — especially FIIs who influence Indian equity markets significantly.
How Fed Rate Cuts Affect the Indian Stock Market
Let’s break it down into simple, relatable impacts:
1. Impact on FIIs: Will Flows Return to India?
Generally, when US interest rates drop:
- US bond yields fall
- Dollar weakens
- Emerging markets become more attractive
For India, this is usually positive. Historically, we’ve seen this during:
- 2014–2015: Fed pause and liquidity boost → Heavy FII inflows → Nifty rallied
- 2020: Ultra-low US rates → Record inflows → Sensex touched new highs
If the current cut leads to a weaker dollar index, India could see:
- Renewed FII buying in banks, IT, capital goods
- Stabilizing currency volatility
- Higher participation in large-cap stocks
However, India is no longer dependent only on FIIs — strong domestic inflows provide a cushion even during global uncertainty.
2. Impact on Nifty: Short-Term Volatility, Medium-Term Tailwinds
Nifty’s immediate reaction may be choppy because markets had partially priced-in the rate cut.
But over the next quarter:
- Lower global borrowing costs
- Strong domestic GDP growth
- A supportive budget cycle
…could create a healthy setup for Nifty to trend positively, barring external shocks.
A key indicator to watch:
Crude oil. If oil stays below $85, India benefits.
3. Impact on the Indian Rupee
A Fed cut often reduces pressure on emerging market currencies. For the rupee:
- A stable or stronger INR reduces imported inflation
- Makes foreign borrowing cheaper for Indian corporates
- Improves investor confidence in rate-sensitive and import-dependent sectors
IT companies may see mild margin pressure if the rupee strengthens, but the overall direction remains sector-specific.
4. Sector-wise Impact on Indian Markets
Banking & NBFCs
Lower borrowing costs and better liquidity often support credit growth. Nifty Bank tends to benefit when yields soften globally.
IT & Tech
A weaker US dollar can reduce rupee revenues, but improved US business activity typically boosts demand for Indian IT services.
Real Estate
This sector thrives in lower-rate environments. Home loans could become more competitive if Indian rates also follow a softening path.
Autos
Lower global rates help reduce financing costs and also soften commodity prices — a positive for auto manufacturers.
Metals & Commodities
If global growth expectations rise due to Fed easing, metals could see revival.
What Should Indian Investors Do Now?
1. Avoid knee-jerk decisions
Markets may react sharply in the first few sessions, but stability often follows.
2. Focus on strong fundamentals
Companies with resilient earnings, low leverage, and steady cash flows are better positioned to benefit from liquidity-driven rallies.
3. Watch macro indicators
- Dollar Index (DXY)
- US 10-year bond yield
- Indian inflation and RBI commentary
- Crude oil trends
4. Maintain a diversified portfolio
A mix of large caps, sectors with strong earnings visibility, and long-term SIP flows can help ride global cycles smoothly.
FAQs
1. Will the Fed rate cut directly impact Indian interest rates?
Not immediately. The RBI considers domestic inflation and growth, though global cues like Fed policy indirectly influence its stance.
2. Will Nifty rise after the Fed rate cut?
Short-term volatility is possible, but medium-term sentiment tends to be positive due to better liquidity and improved risk appetite.
3. Are FIIs likely to return to Indian markets?
Yes, if global yields remain soft and the dollar cools, India becomes attractive due to strong economic fundamentals.
4. Which sectors will benefit the most?
Banks, NBFCs, real estate, IT, and autos could see improved sentiment depending on secondary macro factors.
5. Should retail investors make changes to their portfolios?
Only after evaluating risk tolerance and goals. Long-term investors should stay disciplined.
Conclusion
The Fed’s move to cut rates to 3.50%–3.75% is a significant turning point for global liquidity and market momentum. For India, the impact is likely to be constructive over the medium term — supported by strong domestic growth, healthy corporate earnings, and robust retail participation.
Investors who balance patience with informed decision-making stand to benefit the most.
If you're looking to analyze markets with expert guidance, real-time insights, and SEBI-registered research support, Swastika Investmart offers a tech-enabled platform to help you invest smarter.

ICICI AMC IPO: Complete Breakdown for Investors : Read This to Know If You Should Apply
Key Takeaways
- ICICI Prudential AMC is launching a ₹10,602 crore 100% OFS IPO.
- Strong financials: EBITDA margin 73%, RoNW 82.8%, consistent growth.
- Diversified AUM and strong brand help maintain stable long-term cash flows.
- Valuation at P/E 40.37x (FY25) seems reasonable vs peers.
- Good for long-term investors; listing gains may be moderate.
ICICI AMC IPO: Complete Breakdown for Investors — Read This to Know If You Should Apply
ICICI Prudential Asset Management Company (ICICI AMC) is finally coming to the public markets, and investor interest is already buzzing. Backed by ICICI Bank and Prudential Group — two respected names in the financial world — this IPO has become one of the most anticipated listings of the year.
In this detailed breakdown, we analyse the company’s business model, strengths, risks, financial performance, valuation, peer comparison, and whether investors should consider applying. This analysis follows SEBI-aligned transparency, Indian market context, and strong research methodology backed by Swastika Investmart’s expertise.
What Does ICICI Prudential AMC Really Do?
ICICI AMC is an Asset Management Company — meaning it manages money on behalf of retail and institutional investors. This money is pooled through mutual fund schemes like:
- Equity funds
- Debt funds
- Hybrid funds
- ETFs and Index funds
- PMS, AIFs
- Offshore advisory mandates
The company’s core responsibility is simple:
Invest clients’ money responsibly and generate long-term returns while managing risk.
They earn revenue primarily from management fees, which are linked to their AUM (Assets Under Management). So, higher AUM → higher income → stable profitability.
As of September 2025, ICICI AMC reported a Quarterly Average AUM of ₹10,147.6 billion, reflecting its large market dominance.
IPO Details
Issue Type: 100% Offer for Sale (OFS)
Total Issue Size: ₹10,602.65 crore
Fresh Issue: NIL
Offer for Sale: ₹10,602.65 crore
Price Band: ₹2061–₹2165
Market Lot: 6 shares
Issue Opens: 12 December 2025
Issue Closes: 16 December 2025
Listing: BSE & NSE
Market Cap at Upper Band: ₹1,07,006.97 crore
Basis of Allotment: 17 Dec 2025
Refunds: 18 Dec 2025
Shares in Demat: 18 Dec 2025
Listing Date: 19 Dec 2025
This IPO is purely OFS — no new money comes into the company, as existing shareholder Prudential Corporation is reducing its stake.
Company Financial Performance (FY23–FY25)
Below is a clean text summary of the company’s consolidated financial performance:
Equity Share Capital
- FY23: ₹17.6 crore
- FY24: ₹17.6 crore
- FY25: ₹17.6 crore
Net Worth
- FY23: ₹2,313.06 crore
- FY24: ₹2,882.84 crore
- FY25: ₹3,516.94 crore
Total Income
- FY23: ₹2,838.18 crore
- FY24: ₹3,761.21 crore
- FY25: ₹4,979.67 crore
EBITDA Margin
- FY23: 73.02%
- FY24: 73.91%
- FY25: 73.04%
Net Profit
- FY23: ₹1,515.78 crore
- FY24: ₹2,049.73 crore
- FY25: ₹2,650.66 crore
Observation:
There is consistent revenue and profit growth, stable margins, strong balance sheet expansion, and market-leading profitability.
Key Strengths of ICICI AMC
1. Strong Brand Backing
ICICI Bank + Prudential Group = instant trust among investors.
2. Diversified Product Mix
Equity, debt, hybrid, ETFs, PMS, AIF — all major asset classes covered.
3. High and Stable Margins
EBITDA margin ~73% indicates superior cost efficiency.
4. Robust Distribution Network
272 offices across 23 states + strong digital onboarding ecosystem.
5. High Return on Net Worth
RoNW of 82.8% is among the best in the financial sector.
Competition & Peer Comparison
Key Interpretation:
ICICI AMC leads the industry in RoNW, revenue scale, and premium brand value.
Outlook & Valuation
ICICI AMC is valued at P/E 40.37x (FY25). While not cheap, the valuation seems justified because:
- High investor trust in ICICI brand
- Strong and predictable fee-driven income
- Massive AUM backing
- Sector tailwinds (financialization of savings)
- Consistent profitability
- Low capital requirements + high operating leverage
Swastika Investmart’s research outlook suggests the IPO is positioned as a long-term compounding opportunity.
Risks to Consider
- 100% OFS — no fresh capital for future expansion
- Regulatory tightening (SEBI norms impact mutual funds)
- High dependence on distributor networks
- Market volatility may affect AUM inflows
- Rising competition from HDFC AMC, Nippon, SBI MF, Axis MF, etc.
Should You Apply for ICICI AMC IPO?
Here’s the balanced view:
Short-Term (Listing Gains)
- Since it is a full OFS, listing pop may be moderate.
- Demand looks strong due to brand name + financial quality.
Long-Term Investors
- Stable business model
- Industry tailwinds
- Strong balance sheet
- High margins and high RoNW
- Brand credibility
Verdict:
If your aim is long-term wealth creation, this IPO is worth considering.
FAQs
1. Is ICICI AMC a debt-free company?
Yes, the company operates with minimal debt due to its asset-light model.
2. What is the biggest risk for mutual fund AMCs?
Regulatory changes from SEBI and market volatility impacting AUM growth.
3. Is the IPO fully OFS?
Yes, 100% OFS, meaning no new shares are issued.
4. What makes ICICI AMC different from competitors?
Its scalable digital ecosystem, massive distribution, and industry-leading RoNW.
5. Can retail investors apply easily?
Yes, through broker apps, UPI, or via Swastika Investmart’s seamless platform.
Conclusion: Should You Apply?
ICICI Prudential AMC stands out for its strong financials, brand backing, diversified product portfolio, and superb profitability metrics. While the IPO is a pure OFS, long-term investors may find significant value as the Indian asset management industry continues to expand with rising financialization.
If you're looking for stability, trust, and steady compounding, ICICI AMC can be a strong addition to your long-term portfolio.
Explained: Why AU Small Finance Bank’s FDI Limit Increase Matters and What Investors Should Watch Next
Key Takeaways
- AU Small Finance Bank receives approval to raise foreign investment limit from 49% to 74%.
- Move can improve liquidity, capital access, and global investor participation.
- Could reshape competition within the small finance bank sector.
- Watch asset quality, capital deployment, and interest rate cycles in the coming quarters.
- Swastika Investmart’s SEBI-registered research can help investors interpret such regulatory shifts.
The Indian banking industry has been transforming rapidly, especially with growing digital adoption, tighter regulatory frameworks, and stronger capital adequacy norms. In this evolving landscape, the Finance Ministry’s approval allowing AU Small Finance Bank (AU SFB) to raise its foreign investment limit from 49% to 74% marks a significant policy milestone.
This development is not just a technical regulatory update—it is a signal that could reshape the bank’s capital flexibility, global investor interest, and long-term growth trajectory. For investors, understanding the implications of this move is essential, particularly at a time when the BFSI sector is witnessing steady credit offtake and rising competition.
Let’s break down what this approval means, why it matters, and what you—as an investor—should track in the coming months.
Why Raising the FDI Limit Is a Big Deal
1. Stronger Access to Global Capital
By increasing the foreign direct investment ceiling to 74%, AU SFB gains access to a broader pool of international investors. This is important because:
- Global investors bring long-term, patient capital
- They often support governance reforms and operational strengthening
- FDI helps reduce dependency on domestic markets during tight liquidity cycles
For a bank aiming to scale lending, digital infrastructure, and geographical footprint, additional foreign capital improves both capacity and resilience.
2. Enhances Market Perception and Institutional Trust
Banks with higher FDI participation often gain better visibility among global funds and rating agencies. AU SFB could see:
- Improved perception of governance quality
- Strengthened institutional confidence
- Enhanced long-term investor base
In previous regulatory instances—such as when HDFC Bank or ICICI Bank saw increased foreign investor interest—market visibility improved significantly.
3. Potential Boost to Capital Adequacy and Expansion Plans
Additional foreign capital can support AU SFB’s long-term growth roadmap, which typically includes:
- MSME and retail credit expansion
- New branch launches in underserved regions
- Investments in digital banking and fintech partnerships
- Better underwriting capabilities
Higher capital levels also act as a buffer during stressed credit cycles, ensuring healthier balance sheet stability.
Impact on the Indian Markets
The FDI increase aligns with India’s broader efforts to attract overseas capital into regulated sectors. For the BFSI space, such policy green signals generally:
- Improve foreign investor sentiment toward Indian financials
- Encourage capital flows into mid-tier banks
- Strengthen the SFB segment’s competitive landscape
In recent years, foreign flows into financial services have been closely tied to India’s interest rate cycles and macroeconomic stability. This announcement may help AU SFB attract incremental FPI/FII inflows, especially from global funds focused on emerging market banking stories.
What Investors Should Watch Next
1. How Much Capital AU SFB Actually Raises
FDI limit enhancement is only the first step. Investors should monitor:
- Size of capital infusion
- Type of investors participating
- Pricing and dilution impact
- Deployment strategy
Large long-term funds coming in could boost the stock’s institutional credibility.
2. Asset Quality Trends
With growth comes risk. Key metrics to follow:
- GNPA and NNPA movement
- Restructured book performance
- Collection efficiency
- Exposure to MSME and unsecured portfolios
A stable or improving asset quality trend will be a positive indicator.
3. Impact on Margins and Profitability
Capital infusion gives AU SFB the ability to expand lending, but investors should track:
- Net Interest Margin (NIM) trends
- Cost of funds
- Operating leverage gains
- Credit cost movements
If the bank maintains strong profitability while scaling, the FDI hike will translate into real value creation.
4. Regulatory Landscape for Small Finance Banks
The RBI has been vigilant with SFB compliance on:
- Lending norms
- Priority sector guidelines
- Capital adequacy ratios
Any shift in regulatory expectations could influence AU SFB’s growth trajectory.
FAQs
1. What does AU SFB’s FDI limit increase mean?
It allows foreign investors to own up to 74% of the bank, expanding its ability to attract global capital for growth and strengthening its balance sheet.
2. Will the bank immediately raise funds after this approval?
The approval only increases the permissible limit; actual fundraise depends on market conditions and management decisions.
3. How will this impact retail shareholders?
Higher FDI may improve liquidity, valuation visibility, and future growth prospects, though short-term market reactions may vary.
4. Is this positive for the small finance bank sector?
Yes. It may enhance global confidence in the SFB model and set the stage for similar policy flexibility for other players.
5. What risks should investors be aware of?
Asset quality pressures, credit cycle sensitivity, regulatory changes, and execution challenges during expansion.
Conclusion
The Finance Ministry’s approval for AU Small Finance Bank to raise its foreign investment limit from 49% to 74% is more than a policy update—it’s a strategic catalyst. It enhances the bank’s capacity to raise high-quality capital, strengthens institutional credibility, and opens doors for long-term expansion in a competitive banking ecosystem.
For investors, the next few quarters will be crucial to understand how the bank deploys new capital, manages its asset quality, and leverages growth opportunities.
For data-backed insights, investor education, and SEBI-registered guidance, platforms like Swastika Investmart empower you to make smarter, informed decisions—whether analysing regulatory updates or navigating market trends.

Park Medi World IPO Review (Dec 10–12): Business Model, Valuation & Investment Call
Key Takeaways
- Park Medi World operates 14 NABH-accredited multi-super speciality hospitals across North India.
- IPO size is ₹920 crore with a price band of ₹154–162.
- Healthy FY25 performance: ₹1,425.97 crore revenue and 26.11% EBITDA margin.
- Strong RoNW of 20% and reasonable valuation at 29.21x P/E.
- Suitable for medium to long-term investors seeking healthcare growth exposure.
India’s healthcare sector has been one of the most resilient and fast-evolving spaces, backed by rising demand for speciality care, medical infrastructure expansion, and increasing insurance penetration. Against this backdrop, the Park Medi World IPO has generated noticeable investor interest ahead of its December 10–12 bidding window.
The company operates a large network of multi-super speciality hospitals under the “Park” brand and is already one of the largest private healthcare providers in North India. Given the strong fundamentals and sectoral momentum, the IPO has become a talking point among retail and institutional investors.
Let’s dive deeper into its business model, financials, valuation, strengths, and key risks.
About Park Medi World
Park Medi World runs 14 multi-super speciality hospitals across Haryana, Delhi, Punjab, and Rajasthan. Its hospitals offer more than 30 speciality and super-speciality services including:
- Internal Medicine
- Neurology
- Oncology
- Orthopaedics
- Gastroenterology
- General Surgery
- Urology
All hospitals are NABH accredited, and eight facilities also hold NABL accreditation, reflecting strong clinical standards. The diverse speciality mix positions the group as a reliable healthcare provider across major population clusters.
IPO Details at a Glance
Issue Open: 10 December 2025
Issue Close: 12 December 2025
Total IPO Size: ₹920 crore
Fresh Issue: ₹770 crore
Offer for Sale: ₹150 crore
Price Band: ₹154–162
Market Lot: 92 shares
Face Value: ₹2
Listing: BSE, NSE
Expected Market Cap: ₹6,997.28 crore
Issue Break-up:
- QIBs: 50%
- NII: 35%
- Retail: 15%
Indicative Timetable:
- Basis of Allotment: 15 Dec 2025
- Refunds/ASBA Unblocking: 16 Dec 2025
- Shares to Demat: 16 Dec 2025
- Listing Date: 17 Dec 2025
Objects of the Issue
The company plans to deploy the fresh capital for:
- Expansion of 117 new company-operated (COCO) stores
- Lease and license fee payments for existing centres
- Purchase of new medical equipment and machinery
- Marketing and brand-building activities
- Debt repayment (a major positive)
- General corporate purposes
The ₹380 crore earmarked for debt repayment is expected to instantly improve net margins post-listing.
Valuation Metrics
- EPS (Pre-IPO): 5.55
- P/E (Post Issue): 29.21x
- RoNW: 20.08%
The valuation is reasonable when compared with premium-listed peers like Apollo Hospitals, Max Healthcare, Global Health, Krishna Institute of Medical Sciences, etc.
Strengths of Park Medi World
1. Strong Presence in North India
It is the second largest private hospital chain in North India and the largest in Haryana, offering deep regional penetration.
2. Diverse Speciality Mix
From oncology to orthopaedics, the wide range of specialities creates a stable revenue stream and enhances patient retention.
3. Accredited and Quality-Driven Network
NABH and NABL certifications across multiple hospitals strengthen clinical credibility.
4. Scalable Operating Model
A proven track record of acquiring and integrating hospitals gives the company an edge in expansion-driven growth.
5. Healthy Financial Profile
Consistent revenue growth, strong margins, and improving net worth make the financials robust.
Risks to Consider
High Operating Costs
Running large multi-speciality hospitals demands constant capex and skilled manpower, impacting cost structures.
Healthcare Regulatory Environment
The sector faces strict regulatory oversight relating to pricing, reporting, and medical standards.
Competitive Pressure
Private hospital chains and government institutions both create competitive intensity in major markets.
Dependence on Medical Professionals
Availability and retention of skilled doctors and staff remain critical to operational stability.
Seasonality in Patient Footfall
Certain treatments and admission rates fluctuate seasonally, affecting quarterly performance.
Competitive Landscape
Although the company claims no direct comparable peers with the same business model, listed players in the broader healthcare space include:
- Apollo Hospitals
- Narayana Hrudalaya
- Fortis Healthcare
- Max Healthcare
- KIMS
- Global Health
- Jupiter Hospitals
Park Medi World’s valuation is noticeably lower compared to many of these, offering an attractive entry point for long-term investors seeking healthcare exposure.
Should You Subscribe? – Valuation & Investment View
The IPO arrives with a favorable mix of growth, profitability, and reasonable valuation. Key positives include:
- Strong RoNW of 20%
- 26.11% EBITDA margin in FY25
- Debt reduction expected to boost profitability
- Large and expanding hospital network
- Healthy demand outlook in India’s healthcare sector
With growing healthcare consumption, rising insurance penetration, and government-backed initiatives supporting medical infrastructure, Park Medi World is well-positioned to benefit from structural sectoral demand.
For medium to long-term investors, the IPO appears to offer a solid combination of stable business fundamentals and attractive valuation.
Frequently Asked Questions
1. What is the price band of the Park Medi World IPO?
The IPO is priced at ₹154 to ₹162 per share.
2. How is the company financially performing?
In FY25, Park Medi World generated ₹1,425.97 crore in revenue, with a 26.11% EBITDA margin and ₹213.22 crore net profit.
3. What will the company use the IPO proceeds for?
Funds will be used for expansion, equipment purchase, marketing, and debt repayment.
4. Is the valuation attractive?
At 29.21x P/E, the valuation is reasonable compared to major listed hospital chains with significantly higher multiples.
5. Is this IPO suitable for long-term investors?
Given the strong operating performance and regional leadership, the IPO suits investors seeking long-term exposure to India’s healthcare growth story.
Conclusion
Park Medi World’s IPO comes at a time when healthcare demand in India is rising rapidly. With strong financials, expanding capacity, and a track record of consistent execution, the company presents a compelling long-term investment case. As always, aligning IPO investments with your risk appetite and financial goals is important.
For deeper insights, SEBI-registered guidance, and easy investing tools, platforms like Swastika Investmart help investors make informed decisions with confidence.

Nephrocare IPO Opens Dec 10–12: Should Investors Back Asia’s Largest Dialysis Provider?
Key Takeaways
- Nephrocare is Asia’s largest dialysis provider with 519 centers across India and international markets.
- IPO opens December 10–12; price band ₹438–460; total issue size ₹4,615 crore.
- Revenues grew from ₹443 crore in FY23 to ₹770 crore in FY25; FY25 profit stood at ₹67 crore.
- Valuation appears aggressive at a P/E of 63.52x vs listed healthcare peers.
- Suitable primarily for aggressive long-term investors; short-term listing gains uncertain.
India’s healthcare ecosystem has transformed rapidly over the past decade, with specialized service providers playing a crucial role in bridging critical care gaps. One segment that has grown consistently is dialysis care, driven by rising chronic kidney disease (CKD) cases and limited access to quality treatment in Tier II and Tier III cities.
Against this backdrop, Nephrocare Health Services, Asia’s largest dialysis care provider and the world’s fifth-largest by treatment volume, is launching its IPO from December 10 to December 12. The company’s scale, operational footprint, and unique service model have attracted strong investor attention.
This analysis breaks down whether the Nephrocare IPO deserves a spot in your portfolio.
Company Overview
Founded in 2010, Nephrocare offers end-to-end dialysis services, including diagnosis, haemodialysis, mobile dialysis, home dialysis, and wellness programs. The company also runs an in-house pharmacy, which enhances value per patient and operational efficiency.
As of September 30, 2025, Nephrocare operated:
- 519 dialysis centers
- 51 international centers across the Philippines, Uzbekistan, and Nepal
- Presence in 288 cities across 21 states and 4 union territories
- 77.53% centers in Tier II and III regions
Its international presence includes the world’s largest dialysis clinic in Uzbekistan, highlighting its execution capability outside India as well.
Nephrocare also partners with major hospitals such as Max Super Speciality Hospital, Fortis Escorts, Care Hospitals, Wockhardt Hospitals, Paras Healthcare, Jehangir Hospital, and Ruby Hall Clinic—strengthening credibility and patient inflows.
IPO Details
Here is the IPO information converted from the table into clean descriptive text:
- IPO Date: December 10–12, 2025
- Total Issue Size: ₹4,615 crore
- Fresh Issue: ₹3,534 crore
- Offer for Sale (OFS): ₹1,080+ crore (11.25 million shares)
- Price Band: ₹438–460
- Market Lot: 32 shares
- Face Value: ₹2
- Market Capitalization at Upper Band: ₹4,615 crore
- Listing: NSE and BSE
- QIB Allocation: 50%
- NII Allocation: 15%
- Retail Allocation: 35%
Important dates:
- Basis of Allotment – December 15
- Refunds/ASBA Unblocking – December 16
- Credit to Demat – December 16
- Listing – December 17
Objects of the Issue
According to the RHP and uploaded note, the proceeds will be used for:
- Opening new dialysis centers in India
- Repayment/prepayment of certain borrowings
- General corporate purposes
This aligns with Nephrocare’s expansion-led growth model.
Financial Performance
Here is the table translated into simple text:
FY23 to FY25 Financial Trend
- Revenue:
- FY23: ₹443.26 crore
- FY24: ₹574.72 crore
- FY25: ₹769.92 crore
- EBITDA Margin:
- FY23: 11%
- FY24: 17.3%
- FY25: 21.6%
- Net Profit/Loss:
- FY23: –₹11.79 crore (loss)
- FY24: ₹35.13 crore (profit)
- FY25: ₹67.10 crore (profit)
- Net Worth:
- FY23: ₹384.73 crore
- FY24: ₹423.55 crore
- FY25: ₹594.21 crore
This financial trajectory shows that Nephrocare has achieved consistent revenue growth, margin expansion, and a turnaround from losses to profits within two years.
However, the note also highlights that higher finance costs affected profitability in H1 FY26, indicating the impact of expansion-related borrowing.
Key Strengths
- Asia’s largest dialysis provider, serving over 33,000 patients annually
- Extensive clinic network across India and key international markets
- Deep penetration in underserved Tier II and III markets
- Strategic partnerships with major hospital chains
- Operational excellence backed by an experienced management team
Key Risks
- Capital-intensive expansion demands continuous funding
- Maintaining quality control across 500+ clinics is challenging
- Profit margins vulnerable to policy changes in dialysis reimbursement
- Rising competition from hospital chains and local providers
- High OFS component may reflect partial exits by existing shareholders
Valuation and Peer Comparison
The IPO is valued at 63.52x earnings, based on FY25 EPS of ₹8.28.
When compared with listed Indian healthcare players:
- Narayana Health – 45.21x
- Jupiter Lifeline Hospitals – 51.10x
- Rainbow Children’s Hospital – 56.84x
- Dr. Lal Path Labs – 52.47x
- Metropolis Healthcare – 69.48x
- Vijaya Diagnostics – 73.14x
While a direct comparison is difficult due to Nephrocare’s unique dialysis-focused model, the valuation appears aggressive, especially considering its relatively smaller scale compared to multispecialty hospital chains.
This suggests that strong listing gains are not guaranteed unless subscription is exceptionally high.
Market Context and Regulatory Relevance
Dialysis demand in India is rising sharply due to:
- Increasing CKD prevalence
- Limited access to kidney care in semi-urban regions
- Supportive government schemes like Ayushman Bharat
- Public-private partnership models for dialysis centers
The sector’s growth is resilient and relatively non-cyclical, which helps companies like Nephrocare maintain steady patient footfall regardless of market cycles.
SEBI’s oversight on IPO disclosures and IRDA/RBI-backed financial compliance add another layer of investor protection.
Should You Apply for the Nephrocare IPO?
Nephrocare presents a strong long-term growth opportunity powered by scale, rising healthcare demand, and a proven operating model. However, the valuation premium and capital-intensive nature of the business require cautious optimism.
Best suited for:
✔ Aggressive long-term investors
✔ Those who believe in chronic-care healthcare models
✔ Investors comfortable with higher valuations
Not ideal for:
✘ Risk-averse investors
✘ Those seeking guaranteed short-term listing gains
FAQs
1. Is Nephrocare IPO good for long-term investment?
Yes, provided you are comfortable with higher valuations and expect steady growth in healthcare services.
2. How has Nephrocare performed financially?
The company grew revenues from ₹443 crore in FY23 to ₹770 crore in FY25, with profits improving sharply.
3. Why is the valuation considered aggressive?
Its P/E of 63.52x is higher than many listed healthcare peers, despite smaller revenue size.
4. What makes Nephrocare different from hospital chains?
It is a pure-play dialysis provider, giving it specialization advantage but also limiting diversification.
5. Who should avoid this IPO?
Investors seeking low-risk opportunities or short-term listing gains may skip.
Conclusion
Nephrocare’s IPO brings a unique healthcare opportunity to the Indian markets. The company’s strong presence in underserved regions, international expansion, and improving financials make it a compelling option for long-term investors. However, the valuation premium means investors must balance growth potential with cautious expectations.
For investors who want expert research, seamless IPO application, and tech-enabled investing backed by a SEBI-registered entity, Swastika Investmart provides a trusted platform.

Fino Payments Bank Gets Green Light from RBI - Will This Fuel New Growth in Financial Inclusion?
Key Takeaways
- RBI lifts restrictions on Fino Payments Bank, enabling a fresh start.
- Move expected to boost last-mile digital banking and rural inclusion.
- Strengthens the role of fintech-led micro-banking ecosystems.
- Could influence investor sentiment across small finance and fintech players.
- Swastika Investmart highlights investor education and data-backed insights for smarter decisions.
The recent approval granted to Fino Payments Bank by the Reserve Bank of India (RBI) has revived conversations around the future of digital banking and financial inclusion in India. The lifting of restrictions marks a crucial turning point for a bank that has always positioned itself as a last-mile service provider, especially across Tier-3 and rural regions.
With India’s financial ecosystem becoming more digital and regulated than ever, this move carries significant implications—not just for customers, but also for fintech competition, investor sentiment, and the overall payments landscape.
Let’s break down what this development means, why it matters, and how it may shape the future of India's financial inclusion efforts.
Why RBI's Green Light Matters
Stronger Trust in the Payments Bank Model
Payments banks were conceptualized to bridge India’s financial inclusion gap by offering safe, low-cost digital banking services. When the RBI reinstates operational clarity to such a player, it sends a signal that the model still holds value—especially for enabling micro-transactions, doorstep banking, Aadhaar-enabled services, and cash-in/cash-out points.
Fino has a strong presence across rural pockets, functioning like a bridge between formal banking systems and underserved communities. With the recent approval, the bank can accelerate operations that were earlier limited or paused.
What This Means for Customers
1. Revival of Digital Banking Services
Customers can expect smoother access to services like:
- Digital savings account operations
- Micro-ATM withdrawals
- Aadhaar-enabled payment services
- Utility bill payments
- Remittance services
This is crucial for regions where traditional banking infrastructure remains limited.
2. Boost for Rural & Semi-Urban Banking
Fino’s vast merchant network—spanning kirana stores, CSCs, and micro-businesses—supports millions of small-value transactions daily. With RBI’s go-ahead, these services resume normalcy, ensuring uninterrupted financial activity in remote areas.
3. Increased Security & Compliance Assurance
RBI oversight ensures improved operational controls, cybersecurity protocols, and customer protection—important for users who rely heavily on cash-led transactions.
Impact on the Indian Financial Markets
While the development does not directly move major indices, it does influence sentiment across:
- Payments and fintech companies
- Small finance banks
- NBFC-MFI players
- Rural banking solution providers
Investors read RBI’s decision as a signal of stability and consistency in the regulatory stance toward digital financial models. This comes at a time when India is rapidly advancing toward a less-cash economy driven by UPI, Aadhaar-based verification, and interoperable infrastructure.
Real-World Parallel
When Airtel Payments Bank received regulatory clarity in the past after temporary restrictions, customer activity rebounded quickly. A similar rejuvenation could occur for Fino, particularly in domestic remittances and agent-assisted banking.
How This Shapes the Future of Financial Inclusion
1. Strengthening the “Phygital” Model
India’s unique financial landscape requires both digital and physical touchpoints. Fino’s large on-ground network complements digital interfaces, making it easier for first-time users to adopt formal banking.
2. Support for Government-Led Initiatives
Reforms such as:
- Jan Dhan Yojana
- PM Kisan
- Direct Benefit Transfers (DBT)
- Digital literacy programs
get a direct operational boost as the last-mile delivery channel becomes more robust.
3. Job Creation & Local Enterprise Support
Banking correspondents, micro-merchants, and rural service points benefit economically from resumed services.
Competitive Landscape: Navigating Neutrally but Smartly
While players like Airtel Payments Bank, India Post Payments Bank, and small finance banks continue strengthening their digital stack, the reinstatement allows Fino to re-align its position.
Amid this, Swastika Investmart stands apart in helping investors interpret such developments with:
- SEBI-registered advisory
- Strong research-backed insights
- Tech-enabled platforms for smooth investing
- Focus on investor education
- Reliable customer support for new and seasoned investors
These strengths matter when markets move on regulatory developments, especially in emerging sectors like fintech and digital banking.
FAQs
1. Why did RBI’s approval for Fino Payments Bank create buzz?
Because it restores full operational capacity, enabling the bank to continue serving millions of customers in rural and semi-urban India.
2. Will this impact other fintech or payments bank stocks?
Not directly, but it improves confidence in the payments bank ecosystem, which can positively influence sectoral sentiment.
3. Does Fino's reinstatement help financial inclusion?
Yes. It strengthens last-mile service delivery, which is central to India’s financial inclusion mission.
4. Are customers safe using services after RBI’s nod?
Yes. RBI clearance indicates adherence to regulatory norms, improving trust and operational transparency.
5. Should investors consider fintech or banking stocks now?
Investors should evaluate fundamentals, compliance track record, and growth opportunities—preferably with guidance from a SEBI-registered advisor like Swastika Investmart.
Conclusion
RBI’s approval for Fino Payments Bank is more than a compliance milestone—it’s a reaffirmation of India’s vision of inclusive, accessible, and digitally empowered banking. As demand for low-cost, last-mile financial services grows, players like Fino will continue shaping the future of rural and semi-urban banking.
For investors, staying informed about such regulatory developments is essential. That’s where Swastika Investmart, with its strong research tools and investor-first approach, empowers you to make smarter decisions.
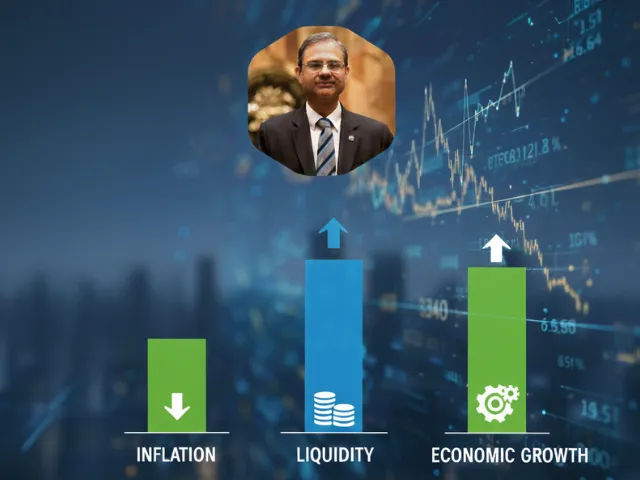
Monetary Policy 2025: RBI Cuts Repo Rate to 5.25% : December Policy Explained & Its Impact on India’s Economy
Key Takeaways
- RBI reduced the repo rate by 25 bps to 5.25% in its December 2025 monetary policy.
- The move aims to support growth, ease borrowing costs, and improve liquidity.
- Inflation is expected to moderate gradually, giving RBI space to adjust rates.
- Borrowers may see lower EMIs, while banks gain better credit demand visibility.
- Financial markets may react positively as rate cuts usually support economic momentum.
The Reserve Bank of India (RBI) delivered its much-awaited December 2025 Monetary Policy, announcing a 25 bps cut in the repo rate, bringing it down to 5.25%. This move signals the central bank’s intent to revive economic momentum while ensuring inflation stays within the target band.
For the Indian financial markets, banks, borrowers, and businesses, this rate cut carries significant implications. Here’s a detailed breakdown of what the latest monetary policy means and how it shapes the economic landscape going into 2026.
Why Did RBI Cut the Repo Rate?
The repo rate—the rate at which banks borrow funds from the RBI—plays a key role in controlling inflation and supporting growth.
Key reasons behind the 25 bps cut:
1. Easing Inflation Pressures
Despite temporary spikes due to food inflation, core inflation has stayed within the comfort zone. This gave the RBI room to support growth through a moderate rate cut.
2. Boosting Consumption & Investment
A lower repo rate makes loans cheaper.
This helps push consumer spending in sectors like real estate, auto, and fintech lending—critical pillars of India’s economy.
3. Supporting Economic Growth
With global economic uncertainty and weakening exports, domestic growth needs a push. The rate cut aims to strengthen India’s economic resilience.
How the Rate Cut Impacts Inflation, Liquidity & Growth
Inflation Impact
A rate cut can potentially increase demand, which may push inflation slightly higher.
However, RBI expects food inflation to soften and supply chains to improve, keeping overall inflation manageable.
Liquidity Impact
Lower repo rates make borrowing easier for banks, improving overall systemic liquidity.
This helps NBFCs, fintech lenders, and sectors dependent on credit availability.
Economic Growth Impact
A 25 bps cut boosts:
- Housing demand
- Auto sales
- SME and MSME borrowing
- Corporate capex plans
Economic activity tends to pick up when borrowing becomes cheaper.
What the Rate Cut Means for Borrowers
1. EMIs May Reduce
Borrowers with floating-rate home loans, car loans, and personal loans could see reduced EMIs in the coming cycles.
2. Faster Loan Approvals
Banks may push more credit to accelerate growth, improving overall lending conditions.
3. Refinancing Becomes Attractive
Borrowers may consider switching lenders to take advantage of lower interest rates.
Impact on Banks and NBFCs
1. Improved Credit Demand
With cheaper loans, demand for retail and business credit may rise.
2. Pressure on NIMs (Net Interest Margins)
Lower rates can reduce banks’ margins, especially for those with higher cost of funds.
3. Stronger Retail Lending Cycle
Banks in home loans, vehicle financing, and personal loans may see stronger growth.
How the Indian Stock Market May React
Stock markets generally react positively to rate cuts because they improve economic outlook.
Potential Beneficiaries:
- Banks & NBFCs
- Real estate developers
- Automobile companies
- Rate-sensitive sectors like capital goods and consumer durables
Market Caution Areas:
- PSU banks with high deposit costs
- Sectors facing global headwinds (IT, exports)
Does This Mark the Start of a Rate-Cut Cycle?
While the RBI did not commit to future cuts, the tone of the policy was accommodative.
Future rate cuts will depend on:
- Inflation trajectory
- Global economic conditions
- Crude oil prices
- Domestic demand patterns
FAQs
1. Why did RBI cut the repo rate to 5.25%?
To support economic growth, improve liquidity and encourage borrowing while inflation remains manageable.
2. Will loan EMIs come down after this rate cut?
Yes, floating-rate loans are likely to see reduced EMIs as banks gradually pass on the rate cut.
3. What are the risks of this rate cut?
Inflation may rise if demand shoots up aggressively, and bank margins may remain under pressure.
4. Which sectors benefit the most?
Real estate, auto, banks, NBFCs, and consumer discretionary typically gain from lower interest rates.
5. Is this the beginning of a rate cut cycle?
Not confirmed, but RBI’s stance appears accommodative, opening the door for further adjustments depending on inflation data.
Conclusion
RBI’s December 2025 monetary policy marks a key moment for India’s economic road ahead.
The 25 bps cut to 5.25% aims to strike a balance between supporting growth and keeping inflation under control. Borrowers, banks, and financial markets stand to benefit from improved liquidity and cheaper credit.
As India heads into 2026, monitoring inflation, global cues, and domestic demand will be important to understanding RBI’s next moves.
If you want to navigate such market shifts with expert-backed research, tools, and dedicated support, Swastika Investmart can be your trusted partner.
%20(7)%20(2).webp)
Why Kaynes Tech Shares Are Falling: A Breakdown of Kotak’s Critical Report
Key Takeaways
- Kaynes Tech shares fell sharply after Kotak Institutional Equities raised concerns over its FY25 disclosures.
- Issues flagged: negative cash flows, higher CCC days, questionable accounting of technical know-how, and lack of clarity in disclosures.
- Market reacted before the exchange filing, showing shaken investor confidence.
- The concerns do not automatically mean fraud—but they highlight the need for stronger governance and transparency.
- Investors should track future disclosures closely and assess fundamentals before taking decisions.
Kaynes Technology, one of India’s most-watched electronics manufacturing services (EMS) companies, has recently come under pressure. The stock fell 4.56% in a single day, dropped 7% over the last five days, and is down 22.7% in one month—raising eyebrows across the market.
The trigger?
A critical report by Kotak Institutional Equities questioning the company’s FY25 financial disclosures, accounting treatment, cash flow quality, and transparency.
This blog breaks down:
- What Kotak flagged
- Why the market reacted so strongly
- What this means for investors
- Broader implications for the Indian markets
All in a simple, fact-driven, educational manner.
Kaynes Tech: What Triggered the Sell-Off?
In early December, Kotak Institutional Equities released a report raising significant concerns about Kaynes Technology’s FY25 numbers. Interestingly, the market reacted even before the official exchange filing, suggesting the concerns circulated among institutions ahead of time.
As a result, the stock—already under pressure—fell even more sharply.
Major Concerns Raised by Kotak (Explained Simply)
1. Negative Cash Flow Despite Revenue Growth
Kotak pointed out that Kaynes reported negative operating cash flow for the year.
Why?
- Cash conversion cycle increased by 22 days
- Higher working capital requirements
- Increased capital expenditure
In the EMS business, where efficiency and cash turnaround are crucial, this is a red flag.
2. Questionable Accounting of Technical Know-How
One of the most debated points:
Kaynes capitalised ₹180 crore (about 6.5% of revenue) as technical know-how.
Kotak said:
- No sufficient detail was provided on what this know-how is
- Why such a large amount was capitalised
- How it contributes to future revenue or margins
When companies capitalise expenses aggressively, profitability can appear inflated.
This raised investor suspicion.
3. Concerns Over Smart Metering Acquisition
Kotak questioned the accounting treatment of Kaynes’s smart metering acquisition.
The report pointed out:
- Lack of clarity in disclosures
- Unexplained adjustments
- Uncertain financial synergies
Since acquisitions are a major growth lever for EMS companies, transparency becomes essential.
4. Inconsistencies in Cash Flow Reporting
Kotak flagged:
- Gaps in related-party disclosures
- Variance between reported profit vs. cash flow
- Unexplained changes in working capital items
Such inconsistencies usually make analysts more cautious, especially in a high-growth sector.
5. Market Sentiment Turned Risk-Off
The overall Indian market has been cautious in December due to global volatility.
Small and mid-cap stocks have been under pressure, and reports like this amplify the sell-off.
For a stock like Kaynes—which previously traded at a premium valuation—any governance or disclosure concern triggers a strong reaction.
Why the Market Reacted So Quickly
Even though companies often clarify such issues later, markets tend to price in risk immediately.
Three reasons:
1. High valuations = Low tolerance for bad news
Kaynes traded at rich multiples, so even small concerns can cause a steep correction.
2. Institutions act fast
When institutional brokerages flag issues, FII and DII flows adjust quickly.
3. Cash Flow concerns scare long-term investors
Profit can be adjusted.
Cash cannot.
Negative cash flow instantly triggers caution.
Impact on the Indian Market & EMS Sector
1. EMS sector under scrutiny
Kaynes' situation has led to broader questions on:
- Governance
- Transparency
- Capital allocation practices in EMS companies
Rivals like Syrma SGS, Dixon, and Amber also saw intraday volatility.
2. Regulators may seek clarity
Accounting treatment of technical know-how and related-party reporting may draw attention from SEBI.
3. Investors becoming more selective
High-growth sectors now face closer scrutiny.
This is healthy for long-term market quality.
What Should Investors Watch Next (Educational Checklist)
This is not investment advice, but a general educational guide on what key areas matter:
1. Clarification from Management
Watch for detailed explanations on:
- Technical know-how capitalisation
- Smart metering acquisition accounting
- Related-party disclosures
2. Q3 & Q4 Cash Flow Trends
Sustained cash burn could become a bigger concern.
3. Auditor Notes
Any emphasis of matter in annual reports is important.
4. Working Capital Cycle
EMS companies must maintain discipline here.
5. Institutional Activity
Track FII/DII buying or selling patterns.
Frequently Asked Questions
1. Why did Kaynes Tech shares fall sharply?
Due to concerns raised by Kotak about FY25 disclosures, accounting treatment, cash flows, and transparency.
2. Is this a sign of fraud?
No. Kotak’s report highlights red flags—not fraud.
It simply calls for clearer disclosures.
3. Should investors panic?
Investors should wait for management clarification and analyse fundamentals.
Corrections often happen when valuations are high.
4. How does this affect the EMS sector?
It creates short-term volatility but may improve governance and transparency long-term.
5. What should retail investors track?
Cash flows, working-capital cycle, disclosures, and management commentary.
Conclusion
Kaynes Technology’s recent stock correction reflects how sensitive markets are to financial reporting clarity and governance standards. Kotak’s report has raised valid questions that the company needs to address clearly and transparently.
For investors, this is a reminder that:
- Cash flow matters more than reported profit
- High valuations demand high governance
- Transparency builds trust in the long run
If you want research-backed insights, tools, and support for your investing journey, Swastika Investmart offers SEBI-registered advisory, robust platforms, and a customer-first approach to simplify decision-making.
Operational Disruptions at IndiGo: How Operational Disruptions Could Impact Aviation Stocks in the Short Term
Key Takeaways
- IndiGo’s recent operational disruptions may trigger short-term volatility across aviation stocks.
- Flight cancellations, delays, and crew shortages directly influence costs and passenger sentiment.
- The aviation sector is already facing elevated fuel prices and capacity constraints.
- Investors should track DGCA updates, operational metrics, and forward-booking trends.
- Long-term structural growth in Indian aviation remains strong despite near-term pressures.
Operational disruptions in the aviation industry are not uncommon, but when they occur at scale—especially at India’s largest airline—markets tend to react sharply. IndiGo, which commands more than half of India’s domestic aviation market, has recently faced operational challenges ranging from flight cancellations to crew shortages. These issues have not only inconvenienced passengers but have also raised questions about the short-term outlook for aviation stocks.
In a sector where margins are thin and operating costs are unpredictable, even temporary disruptions can create ripple effects in stock performance. This blog explores what IndiGo’s operational issues could mean for the broader aviation sector and what investors should monitor going forward.
Understanding the Nature of IndiGo’s Operational Disruptions
IndiGo’s disruptions typically stem from a combination of internal and external factors. Recent incidents have included:
- Large-scale delays due to crew availability
- Weather-related disturbances impacting key hubs
- Aircraft groundings for maintenance and safety checks
- Supply chain bottlenecks affecting spare parts and engine components
Since IndiGo operates a massive fleet network with tight turnaround times, even small inefficiencies can snowball across multiple routes.
India’s aviation regulator, the Directorate General of Civil Aviation (DGCA), closely monitors such disruptions and may issue advisories or require corrective action when they impact flight safety or scheduling reliability.
Immediate Market Impact: Why Aviation Stocks React Quickly
Short-Term Hit to Investor Sentiment
When operational disruptions become news headlines, airline stocks often witness immediate selling pressure. The reasons are straightforward:
- Investors fear rising operational costs
- Disruptions affect passenger satisfaction and brand perception
- Short-term revenue may drop due to cancellations and reimbursements
For example, during earlier disruptions across airlines in 2019 and 2023, market leaders like Indigo and SpiceJet observed swift intraday declines as uncertainty mounted.
Higher Operating Costs and Fuel Sensitivity
Even under normal operations, aviation companies struggle with fluctuating ATF (Aviation Turbine Fuel) prices, which account for nearly 35–40% of an airline’s operating expenses. When disruptions occur:
- Turnaround times increase
- Aircraft utilisation drops
- Compensation and refund costs rise
This combination puts pressure on operating margins, leading analysts to revise short-term forecasts.
Impact on Competitors
Interestingly, when the market leader faces disruptions, smaller competitors may experience mixed effects:
- They may gain passengers temporarily
- Yet, sector-wide sentiment often weakens
- Operational stress can shift across the industry as demand redistributes
Thus, aviation stocks often move together during such episodes.
How IndiGo’s Issues May Affect Other Aviation Stocks
Spillover Effects on Market Perception
Markets tend to view aviation as a high-risk sector due to its capital-intensive nature. When one major player struggles, investors question the resilience of all airlines. This can trigger:
- Short-term corrections in airline stocks
- Higher volatility in aviation-related companies, including airport operators
Potential Short-Term Gains for Competitors
Airlines like Air India, Vistara, or Akasa may temporarily gain market share if passengers switch carriers due to IndiGo’s reliability concerns. However, gains typically remain short-lived unless disruptions persist.
Possible Support for Ancillary Aviation Stocks
Companies involved in:
- Airport services
- Maintenance, repair & overhaul (MRO)
- Aviation technology and logistics
may experience temporary tailwinds if airlines accelerate outsourcing or expand capacity planning.
Regulatory Oversight: The Role of DGCA
The DGCA’s involvement is crucial in such scenarios. In past disruptions, the regulator has instructed airlines to:
- Increase crew availability
- Rework flight schedules
- Improve passenger communication
- Ensure compliance with minimum service standards
If IndiGo’s disruptions escalate, regulatory scrutiny may intensify, influencing operational costs and investor expectations.
What Should Investors Watch in the Coming Weeks?
1. Passenger Load Factors (PLF) and On-Time Performance (OTP)
A drop in OTP often leads to cascading disruptions. Investors should track weekly DGCA updates to assess recovery.
2. ATF Prices
Rising fuel prices amplify the financial impact of disruptions. If global crude prices remain elevated, the pressure could persist.
3. Guidance from Management
Statements regarding fleet availability, staffing, and scheduling adjustments often influence market reactions.
4. Capacity Additions and Route Rationalisation
IndiGo may adjust flight frequencies to stabilise operations. This impacts revenue projections and competitive dynamics.
5. Forward Bookings and Yield Trends
A decline in booking momentum or ticket prices can indicate near-term demand softness.
Is This a Buying Opportunity or a Red Flag?
Short-term disruptions alone rarely change the long-term trajectory of India’s aviation sector. With rising domestic travel demand, expanding airports, and favourable demographics, the industry remains on a structural growth path.
However, investors should differentiate between temporary noise and deeper operational issues.
Near-Term Risks
- Pressure on margins
- Elevated volatility in aviation stocks
- Sector-wide sentiment challenges
Long-Term Positives
- IndiGo’s leadership position
- Expanding domestic passenger traffic
- Government focus on improving aviation infrastructure
- Growing Tier-2/Tier-3 airport connectivity
Investors who prefer stability may wait for clearer signals, while risk-tolerant investors may view price dips as accumulation opportunities—backed by thorough research.
FAQs
1. Why are IndiGo’s operational disruptions affecting aviation stocks?
Because IndiGo holds the largest market share, disruptions at scale influence sector sentiment, passenger behaviour, and operational cost expectations.
2. Will these disruptions impact IndiGo’s long-term performance?
Short-term performance may be affected, but long-term fundamentals depend on fleet expansion, cost management, and demand growth.
3. Do competitors gain when IndiGo faces disruptions?
Competitors may gain passengers for a short period, but broader sector sentiment can still remain weak.
4. What regulatory actions can be expected?
The DGCA may require schedule adjustments, better staffing, or operational audits to ensure passenger safety and service continuity.
5. Should retail investors buy aviation stocks right now?
Investors should monitor operational metrics, costs, and management commentary. Aviation stocks require careful timing due to volatility.
Conclusion
IndiGo’s operational disruptions have once again highlighted the sensitivity of aviation stocks to even temporary disturbances. While short-term corrections are common, the long-term Indian aviation narrative remains intact. Investors should maintain a data-driven approach and avoid reacting purely to headlines.
Platforms like Swastika Investmart, backed by SEBI registration, strong research capabilities, and tech-enabled tools, can help investors make informed decisions in volatile sectors like aviation.

Putin’s India Visit: Could New Strategic Alliances Re-rate India’s Defence Stocks?
Key Takeaways
- Putin’s India visit may strengthen defence, energy, space, and technology cooperation.
- Possible long-term defence contracts could benefit domestic defence manufacturers.
- Markets may see sentiment-driven rallies in defence stocks in the short term.
- India’s Make in India and Atmanirbhar Bharat push limits reliance on imports.
- Investors should track policy announcements, orders, and valuations before acting.
India–Russia ties have historically been rooted in defence cooperation, spanning aircraft, submarines, missiles, and joint technology development. With President Vladimir Putin’s latest visit to India, markets are once again buzzing about whether fresh strategic alliances could spark a re-rating in Indian defence stocks.
While geopolitics doesn’t always translate into immediate market moves, strategic defence collaboration often influences long-term capital flows, order pipelines, and investor expectations. In this blog, we decode what Putin’s visit could mean for India’s defence sector and how investors may position themselves amid policy shifts and market sentiment.
Why Putin’s Visit Matters for India’s Defence Outlook
Russia has been one of India’s biggest defence partners for decades, and the relationship continues to evolve. During major bilateral summits, defence and strategic technology are typically top-priority agenda topics. This visit arrives at an important time:
- India is pushing aggressively for defence indigenization.
- Global supply chains face disruptions due to ongoing geopolitical tensions.
- India aims to become a net defence exporter by 2028–2030.
- Russia is actively looking to strengthen Asian partnerships.
Together, these trends create an environment where Indo–Russian cooperation could reshape both procurement and domestic manufacturing opportunities.
Possible Areas of Collaboration Discussed During the Visit
1. Joint Development of Defence Platforms
India and Russia have earlier co-developed systems like BrahMos, which has now become an export-ready platform. Renewed focus on joint development could involve:
- Advanced missile systems
- Fighter jet modernization
- Submarine technologies
- Air defence systems
Such collaborations typically bring multi-year order visibility to companies involved in integration, components, and systems development.
2. Expansion of Local Manufacturing Under Make in India
India has been pushing global defence partners to establish manufacturing bases locally. Any new deals with Russia may include:
- Deeper localisation of spares and components
- Transfer of technology agreements
- JV announcements benefiting Indian defence PSUs and private players
This aligns with India’s Atmanirbhar Bharat vision, potentially unlocking higher revenue streams for domestic players in aerospace, electronics, and heavy engineering.
3. Strengthening Supply Chain Resilience
Geopolitical tensions have made defence supply chain reliability a strategic priority. Agreements improving logistics, maintenance, spare-part stockpiling, and quicker delivery timelines could help:
- Bharat Dynamics
- Hindustan Aeronautics
- Bharat Electronics
- Cochin Shipyard
- Mishra Dhatu Nigam
Investors often interpret such outcomes as positive, as stable supply chains reduce execution risk.
Impact on Indian Defence Stocks: What the Markets May Look At
Market Sentiment Boost
Historically, major diplomatic visits involving defence discussions often result in short-term rallies. For example, during previous India–Russia and India–US summits, defence stocks such as HAL, BEL, and BDL saw intraday jumps on hopes of future orders.
A similar sentiment play may occur this time as well, especially if joint statements emphasize defence or technology cooperation.
Long-Term Order Pipeline Visibility
Defence manufacturing cycles stretch across years. Even a single large contract—like the S-400 system deal or Akula-class submarine leasing—creates multi-year revenue streams for multiple listed players involved at various stages.
If Putin’s visit results in:
- R&D partnerships
- New co-production initiatives
- Agreements for local upgrades of Russian-origin platforms
…investors can anticipate more predictable order flow.
Exports: The Big Story for Re-rating
India’s defence exports have jumped from ₹1,500 crore in 2016 to over ₹21,000 crore+ recently, according to MoD data. If Indo–Russian collaborations help India export more platforms (like BrahMos), it could contribute to re-rating potential for:
- HAL
- Bharat Electronics
- Bharat Dynamics
- Solar Industries
- Data Patterns
Global exports make valuations richer, similar to how US and European defence firms are valued.
Regulatory and Policy Context Supporting the Sector
- India’s Positive Indigenisation Lists restrict imports and boost domestic manufacturing.
- The Defence Acquisition Procedure (DAP) encourages Make in India.
- The government has increased defence capital outlay consistently.
- Strategic partnerships with Russia may accelerate technology transfer, reinforcing policies.
These structural trends ensure that markets react not just to geopolitics but also to the underlying policy framework.
Should Investors Buy Defence Stocks Based on Putin’s Visit?
Diplomatic visits should not be the sole reason to invest. However, they can be a trigger that adds confidence to the long-term sector story.
Consider the following:
What Works in Favour
- Multi-year visibility of defence spending
- India’s push for self-reliance
- Rising exports
- Strong order books for HAL, BEL, BDL
What Investors Must Watch
- Valuations, which are already elevated in many defence stocks
- Execution capacity and delivery timelines
- Geopolitical risks influencing supply chains
- Actual agreements vs announcements
A disciplined, research-backed approach is essential.
FAQs
1. Will Putin’s India visit immediately impact defence stocks?
Markets may see a short-term sentiment boost, but long-term impact depends on actual deals and policy outcomes.
2. Which Indian defence companies could benefit the most?
PSUs like HAL, BEL, BDL, and firms involved in aerospace and missile systems could gain from deeper collaboration or new joint projects.
3. Does this visit reduce India’s dependence on defence imports?
If the visit leads to local manufacturing and technology transfer, it strengthens India’s indigenisation goals.
4. Are defence stocks overvalued right now?
Some are trading at premium valuations. Investors should assess order books, earnings growth, and balance sheets before investing.
5. What should retail investors do next?
Track official announcements from the Ministry of Defence and stay focused on fundamentals rather than speculation.
Conclusion
Putin’s India visit comes at a pivotal moment in global geopolitics and India’s push toward defence self-reliance. While immediate market reactions are usually sentiment-driven, the real story lies in potential long-term collaboration, local manufacturing, and expanding defence exports.
For investors, the defence theme remains structurally strong, but careful research is key. Platforms like Swastika Investmart, backed by SEBI registration, robust research tools, and tech-enabled investing solutions, help investors navigate such evolving sectors with clarity.
%20(6).webp)
Which IPO Matches Your Portfolio Style? A Comparative Guide to Meesho, Aequs and Vidya Wires
Key Takeaways
- Meesho, Aequs, and Vidya Wires represent three different sectors: tech, aerospace manufacturing, and specialty wires
- Meesho suits growth-focused and aggressive investors
- Aequs fits stable, long-horizon investors seeking industrial expansion
- Vidya Wires is ideal for value-seekers wanting steady earnings
- Your choice depends on risk tolerance, sector preference, and investment horizon
Indian markets have entered a phase where IPOs are no longer just about chasing listing gains. Retail investors today are more informed, more selective, and more conscious about matching IPOs with their long-term goals. With three major offerings—Meesho, Aequs, and Vidya Wires—opening doors to very different sectors, choosing the right one depends entirely on your portfolio style.
This guide simplifies the decision, compares business fundamentals, and helps you decide which IPO fits your investment strategy.
India’s Dynamic IPO Landscape
In FY25–26, India witnessed strong IPO participation driven by robust domestic liquidity, expanding demat account numbers, and higher retail awareness. Sectors like tech, manufacturing, and industrial components continue to attract investor attention thanks to government initiatives, Make in India, and rising digital adoption.
Meesho, Aequs, and Vidya Wires each ride different mega-trends:
- India’s booming value e-commerce market
- Rising demand for precision aerospace manufacturing
- Expansion of power & electrical infrastructure
Understanding where you fit in this growth curve is the key.
Overview of the Three IPOs
Meesho IPO: A Play on India’s Value E-Commerce Boom
Meesho is one of India’s most awaited tech IPOs. Built around affordability, social commerce, and AI-driven efficiency, it has carved a niche among Tier-2 and Tier-3 consumers.
Investor fit:
✔ Growth-driven investors
✔ Those who understand tech cycles
✔ Higher-risk, long-term investors
Meesho is still loss-making but has strong revenue growth, improving margins, and a rising user base. Its valuation remains competitive compared to peers like Zomato and Nykaa.
Aequs IPO: Aerospace Manufacturing with Global Partnerships
Aequs, known for aerospace precision components, benefits from Make in India, increasing defence spending, and supply chain diversification by global OEMs.
Investor fit:
✔ Long-term investors
✔ Those seeking industrial growth
✔ Investors preferring predictable cash flows
Aequs serves major global customers with recurring orders. The company’s visibility and strong industry tailwinds make it suitable for investors who prefer stability over rapid growth.
Vidya Wires IPO: Stable Earnings from a Niche Market
Vidya Wires operates in a traditional but essential segment: copper and aluminium winding wires. With applications across motors, EV components, transformers, and appliances, demand remains steady and cyclical.
Investor fit:
✔ Value investors
✔ Those wanting consistent earnings
✔ Investors seeking low-risk, manufacturing-focused exposure
Vidya Wires shows solid profitability metrics such as ROE and margin stability, making it a good fit for conservative investors.
Comparative Snapshot: Meesho vs Aequs vs Vidya Wires
Below is the simplified text-based comparison:
Company: Meesho
Sector: Value E-Commerce
Strength: High growth, AI-driven scale, Tier-2/3 dominance
Risk: Competition, losses, regulatory sensitivity
Best for: Aggressive investors
Company: Aequs
Sector: Aerospace & Manufacturing
Strength: Global client base, Make-in-India support, stable demand
Risk: High capex cycles, export dependency
Best for: Long-term moderate investors
Company: Vidya Wires
Sector: Electrical & Metal Wires
Strength: Strong ROE, stable margins, diversified demand
Risk: Commodity dependence, price volatility
Best for: Conservative or value-oriented investors
Which IPO Suits Which Portfolio Style?
1. If Your Portfolio Focuses on High Growth
You prefer companies with scalable models, rapid user expansion, and optionalities from tech and brand play.
Best choice: Meesho IPO
Why:
- Fastest revenue growth among the three
- Asset-light business model
- Large upside if profitability improves
2. If You Prefer Stability and Manufacturing Exposure
Your strategy revolves around steady cash flows, tangible assets, and long-term contracts.
Best choice: Aequs IPO
Why:
- Aerospace demand is structurally growing
- Government push for defence & manufacturing
- Predictable order books
3. If You Value Earnings Consistency and Lower Volatility
You want companies that are financially sound with strong unit economics.
Best choice: Vidya Wires IPO
Why:
- Stable demand from electrical, EV and infrastructure sectors
- Strong profitability and manageable debt
- Clear visibility in operations
Real-World Market Context
Recent policy measures such as the Production Linked Incentive (PLI) schemes, defence reforms, and investments in renewable energy have strong spillover effects on Aequs and Vidya Wires. Meanwhile, the rapid digitalisation of Bharat and rising smartphone penetration directly benefit Meesho.
Additionally, SEBI’s framework for transparency in tech IPO valuations encourages better pricing and deeper investor trust.
In the secondary market, investors have shown a stronger appetite for manufacturing IPOs in the past year, but tech IPOs with strong growth potential continue to find demand among aggressive investors.
FAQs
1. Which IPO is best for short-term listing gains?
Listing gains depend on market sentiment, but manufacturing and specialty wire companies often see stronger short-term traction due to profitability.
2. Is Meesho suitable for conservative investors?
Not typically. It suits long-term and growth-focused investors comfortable with volatility.
3. Which IPO offers the most stable fundamentals?
Vidya Wires and Aequs offer stronger financial stability compared to Meesho.
4. Can I apply to all three IPOs?
Yes. Diversifying across sectors reduces concentration risk.
5. Is SEBI regulating these IPOs?
All IPOs undergo SEBI scrutiny, ensuring investor protection, transparent disclosures, and compliance with listing rules.
Conclusion
Choosing between Meesho, Aequs, and Vidya Wires is not about which IPO is “best”. It’s about which one fits your investing style.
Tech-focused growth investors may lean toward Meesho, stability-seekers may prefer Aequs, while conservative investors might find Vidya Wires a better value play.
No matter your choice, always invest through a trusted platform with strong research support and transparent processes.
Swastika Investmart, a SEBI-registered broker, offers expert insights, portfolio tools, and a seamless IPO application experience.
%20(5).webp)
Meesho IPO Review: Apply or Avoid? A Practical Investor’s Guide
Key Takeaways
- Meesho IPO size: ₹5,421 crore
- FY25 revenue jumped sharply, but Net Profit remains negative due to one-offs
- Company turned FCF positive; operates an asset-light, AI-driven, zero-commission model
- At ~5.5× FY25 Sales, valuation is attractive vs premium tech peers
- Suitable for aggressive, long-term investors
Meesho IPO Overview
India’s value-driven e-commerce space is rapidly expanding, and Meesho has emerged as a dominant disruptor—serving Tier-2 & Tier-3 buyers underserved by Amazon and Flipkart. With the IPO opening on December 3, 2025, here’s an in-depth analysis for investors.
Meesho IPO Details
Issue Open: December 3, 2025
Issue Close: December 5, 2025
Total Issue Size: ₹5,421.20 crore
Fresh Issue: ₹4,250 crore
Offer for Sale: ₹1,171.20 crore
Price Band: ₹105–₹111
Market Lot: 135 shares
Estimated M-Cap: ₹50,095.75 crore
Listing: BSE & NSE
Issue Allocation:
- QIBs – 75%
- NIIs – 15%
- Retail – 10%
Use of Funds:
- Cloud infrastructure for subsidiaries
- Branding & marketing
- Acquisitions and general corporate expenses
- Hiring for AI/ML & tech teams
Understanding Meesho’s Business Model
Founded in 2015, Meesho is a multi-sided value-commerce marketplace connecting:
- Non-metro consumers
- Small sellers & micro entrepreneurs
- Logistics providers (including in-house Valmo)
- Influencers/content creators
Key Advantages
- Zero-commission model
- Asset-light structure
- AI-based personalization
- Strong Tier-2/3 penetration
- 30% share of India’s e-commerce shipments
Financial Performance (Restated Consolidated)
Revenue Growth
- FY23: ₹5,897.69 crore
- FY24: ₹7,859.24 crore
- FY25: ₹9,900.90 crore
Strong, consistent rise in volume & efficiency.
Net Profit / Loss
- FY23: –₹1,671.90 crore
- FY24: –₹327.64 crore
- FY25: –₹3,941.71 crore
FY25 losses reflect one-time accounting items, not operational weakness.
EBITDA Margin
- FY23: –28.72%
- FY24: –2.93%
- FY25: –2.22%
Margins improving steadily.
Net Worth
- FY23: ₹2,548.31 crore
- FY24: ₹2,301.64 crore
- FY25: ₹1,561.88 crore
Valuation Ratios (FY25)
- EPS: –₹9.98
- P/E: –11.63×
- P/B: 30.16×
Negative earnings are typical during the scaling phase of digital platforms.
Why Investors Are Interested
1. Free Cash Flow Positive in FY25
Shows solid unit economics despite accounting losses.
2. Dominance in Tier-2 & Tier-3 Markets
India’s most underpenetrated and fastest-growing segment.
3. Zero-Commission Model
Boosts seller margins → drives affordability.
4. Scarcity Premium
Meesho is the only pure-play value e-commerce listed/going public.
5. AI-Led Flywheel
AI helps across:
- Recommendations
- Fraud detection
- Logistics planning
- Seller monetization
Competitive Strategy Going Forward
- Increase product catalog and transaction frequency
- Deepen AI/ML capabilities
- Strengthen affordability and cost innovation
- Scale monetization
- Invest in Horizon 2 businesses (media, fintech, content commerce)
Key Risks to Consider
- Tough competition from Amazon, Flipkart, Jiomart, Ajio, D2C brands
- Small-seller dependence → risk of low-quality goods
- High reliance on Cash-on-Delivery
- Sensitive to e-commerce regulation changes
- Counterfeit risk → brand perception issues
Peer Comparison
Meesho vs Key Listed/New-Age Peers (FY25)
Meesho
- Revenue: ₹9,389.9 crore
- P/E: –11.63
- NAV: 3.68
- RoNW: –252.37%
Zomato
- High P/S (10×+), strong RoNW, positive earnings
Swiggy
- Loss-making, NAV ~40.98
Brainbees (FirstCry)
- Loss-making, global listing candidate
Nykaa (FSN)
- P/E 1,168×; profitable but premium priced
Trent
- Strong profitability, P/E 100.87
Avenue Supermarts (DMart)
- Retail leader; P/E ~98.43
Conclusion:
Meesho’s ~5.5× Sales valuation is reasonable compared to premium peers.
FAQs
1. Is Meesho profitable?
Not yet. Losses continue due to one-off items, but cash flow is positive.
2. Why is the Meesho IPO attractive?
Affordable valuation, strong growth, and value-commerce dominance.
3. Main risks for investors?
Competition, quality issues, COD dependency.
4. Is the valuation reasonable?
Yes—~5.5× Sales, cheaper than Zomato & Nykaa.
5. Who should apply?
Aggressive, long-term tech investors.
Conclusion
- Meesho has successfully carved out a niche in Tier-2/3 cities where Amazon and Flipkart struggle to penetrate deeply
- Meesho has turned Free Cash Flow (FCF) positive in FY25, even though reported Net Profit is still negative due to one-off items.
- At a valuation of ~$6 Billion (₹50,000 Cr), it is priced at roughly 5.5x Price-to-Sales (FY25). This is attractive compared to Zomato (trading often at >10x Sales).
- It has "scarcity premium" as it is the only pure-play "value e-commerce" stock in India.
- Aggressive investors can subscribe for both listing gain and long term.
Aequs IPO Review: Attractive Valuation or Risky Bet : A Retail Investor’s Guide
Key Takeaways
- Aequs operates a unique aerospace-focused SEZ with vertically integrated manufacturing.
- The company is loss-making with negative ROE and ROCE, increasing risk.
- Valuation is cheaper vs niche peers on Price-to-Book, but P/E is highly negative.
- IPO proceeds largely go toward debt repayment, not expansion.
- Suitable only for high-risk, long-term investors looking to play the aerospace theme.
India’s aerospace and defence manufacturing ecosystem is strengthening with Make in India, rising localisation, and global export demand. Aequs Ltd., a vertically integrated aerospace components manufacturer, is tapping the capital markets with a ₹921.81 crore IPO.
However, with volatile financials and dependence on debt, is the IPO attractive or too risky?
This detailed review covers financials, valuation, strengths, risks, and industry comparison.
Aequs IPO Details
- Issue Opens: December 3, 2025
- Issue Closes: December 5, 2025
- Total Issue Size: ₹921.81 crore
- Fresh Issue: ₹670 crore
- Offer for Sale: ₹251.81 crore
- Price Band: ₹118–₹124
- Market Lot: 120 shares
- Estimated Market Cap: ₹8,316.06 crore
- Listing: NSE & BSE
Issue Allocation
- QIBs: 75%
- NIIs: 15%
- Retail: 10%
Use of Funds
- Repayment/prepayment of borrowings
- Investments into three wholly owned subsidiaries
- Machinery & equipment capex
Note: Majority of funds focus on debt reduction, not growth.
Company Overview: What Does Aequs Do?
Founded in 2000, Aequs Ltd. operates a dedicated aerospace SEZ, one of the few integrated ecosystems in India.
Aerospace Product Portfolio
- Structures: brackets, fittings, floorboards
- Cargo & Interiors: panels, trays, seat components
- Landing Systems: landing gear brackets, rims, wheel assemblies
- Actuation Systems: manifolds, housings, pistons
Aequs also leverages its precision engineering capabilities to serve consumer electronics, plastics, and durables, with manufacturing across three continents, offering proximity to global OEMs.
Financial Performance: Three-Year Snapshot
(All values from restated consolidated statements)
Revenue
- FY23: ₹812.1 crore
- FY24: ₹965 crore
- FY25: ₹924.6 crore
Insight: Revenue rose sharply in FY24 but dipped slightly in FY25.
Profitability
- Net Profit FY23: –₹109.50 crore
- Net Profit FY24: –₹14.24 crore
- Net Profit FY25: –₹102.35 crore
Margins temporarily improved but slipped again.
EBITDA Margin
- FY23: 7.77%
- FY24: 15.08%
- FY25: 11.68%
Key Ratios (FY25)
- ROCE: 0.87%
- EPS: –₹1.80
- P/E: –74.71×
- RoNW: –14.47%
Net Worth
- FY23: ₹251.91 crore
- FY24: ₹807.17 crore
- FY25: ₹707.53 crore
FY24 saw a restructuring-led jump, followed by erosion in FY25Interpretation
- Aequs is loss-making, unlike all comparable peers.
- On P/B (~9.9x), it is cheaper than several precision engineering stocks trading at 15–20x P/B.
Key Strengths
- Vertically integrated precision manufacturing ecosystem
- Production spread across multiple continents
- Strong relationships with global aerospace OEMs
- Deep engineering capability across key aerospace systems
- High entry barriers due to specialised infrastructure
Key Risks & Concerns
- All major manufacturing operations based in Karnataka
- Negative operating cash flows
- Heavy dependence on global aerospace cycles
- Persistent losses and negative return ratios
- IPO proceeds primarily for deleveraging, not growth
Strategic Roadmap
Aequs aims to:
- Deepen aerospace client engagement
- Expand consumer product categories
- Improve margins through higher-value manufacturing
- Leverage capabilities to enter adjacent sectors
Execution risk remains high due to financial volatility.
Valuation & Analyst Outlook: Subscribe or Avoid?
Positives
- Unique aerospace SEZ ecosystem
- Sticky client relationships
- Cheaper than peers on Price-to-Book
- Aligned with India’s aerospace manufacturing push
Negatives
- Loss-making for three consecutive years
- High debt, low profitability
- Poor short-term visibility
- Only 10% retail quota, limiting listing momentum
Analyst View
- A unique, high-barrier entry into the aerospace & defense supply chain.
- The company is currently loss-making with negative return ratios
- The majority of IPO proceeds will be used to pay off debt, not for new expansion.
- Priced significantly lower than peers on a Price-to-Book basis (~9.9x vs peers at 15-20x).
- Aggressive investors can park some money for the long term to play niche theme.
FAQs
- Is Aequs IPO good for retail investors?
Suitable only for high-risk investors with long-term horizons. - What is the price band for the Aequs IPO?
₹118–₹124 per share. - How will the IPO proceeds be used?
Mainly debt repayment, subsidiary investments, and machinery capex. - Is Aequs profitable?
No. Aequs has reported losses in FY23, FY24, and FY25. - How does Aequs compare with peers?
Peers are profitable with high P/E valuations; Aequs is loss-making but cheaper on P/B.
Conclusion
The Aequs IPO offers a rare aerospace SEZ ecosystem but comes with high financial risk. While long-term structural opportunity exists, persistent losses, negative returns, and debt dependence make the IPO suitable only for risk-tolerant investors.
For those looking to invest with expert-backed research and a trusted experience, Swastika Investmart offers a SEBI-registered platform with strong tools and support.
.webp)
Vidya Wires Ltd. Going Public: Analyst’s Take on the IPO
Key Takeaways
- Vidya Wires Ltd launches a ₹300 crore IPO backed by strong profitability and 24.57% ROE.
- Financials show consistent revenue growth and superior margins vs peers.
- IPO priced at ~20.36x P/E, far lower than listed wire manufacturers.
- Strengths: diversified product mix, backward integration, and 370+ clients.
- Medium to long-term investors may consider subscribing based on fundamentals.
Vidya Wires Ltd., a long-standing manufacturer of copper and aluminium winding wires, is set to enter the capital markets with its ₹300 crore IPO. The company serves a wide range of sectors—electrical equipment, industrial applications, renewable energy, and EV components—and has built a strong market reputation with steady expansion and a large customer base.
This blog covers detailed IPO insights including business analysis, financials, valuations, risks, and the overall investment outlook.
Vidya Wires Ltd IPO Details
- Total Issue Size: ₹300 crore
- Fresh Issue: ₹274 crore
- OFS: ₹26.01 crore
- Issue Window:
- Opens: December 3, 2025
- Closes: December 5, 2025
- Price Band: ₹48–₹52 per share
- Lot Size: 288 shares
- Listing: BSE & NSE
- Estimated Market Cap: ₹1,106 crore
Issue Allocation
- QIBs: 50%
- NIIs: 15%
- Retail: 35%
Use of Funds
- Setting up a new subsidiary project under ALCU
- Repayment of borrowings
- General corporate purposes
Company Overview
Vidya Wires Ltd is one of India’s established suppliers of conductivity-based copper and aluminium products used in transformers, motors, renewable power systems, and EV components.
Product Portfolio
- Winding wires
- Conductors
- Busbars
- Copper & aluminium strips
- Aluminium paper-covered strips
- PV ribbons
- Custom conductivity-engineered solutions
The company services 370+ clients, making it a key player in India’s electrical manufacturing ecosystem.
Key IPO Financial Ratios (FY25)
- ROCE: 19.72%
- ROE: 24.57%
- EPS: ₹2.55
- P/E (Pre-IPO): 20.36×
These indicate strong profitability and efficient capital deployment.
Industry Comparison
Vidya Wires is priced at nearly half the P/E multiple of listed peers while delivering superior ROE, making the IPO valuation extremely attractive.
Competitive Strategy
Vidya Wires aims to strengthen its industry position through:
- Capacity expansion (ALCU project)
- Broader product diversification
- Growth in EV and renewable segments
- Enhanced cost-efficiency through backward integration
- Wider domestic & international reach
Key Strengths
- 370+ diversified customer base
- Presence across multiple industries reduces cyclicality
- Backward-integrated operations ensure cost & quality control
- Manufacturing in a logistically favourable region
- Strong client relationships with repeat business
- Stable financial performance with consistent margin growth
Key Concerns
- Heavy dependence on a few raw material suppliers
- Limited insurance coverage for operational risks
- Exposure to ongoing legal proceedings
- Industry-wide margin sensitivity to copper & aluminium price fluctuations
Valuation & Outlook: Should You Subscribe?
Vidya Wires operates in a structurally strong sector driven by India’s rising consumption of electrical infrastructure, EV components, and renewable energy systems.
Key Positives
- Attractive valuation compared to peers
- High ROE of 24.57%
- Structural demand growth in power & EV sectors
- Upcoming capacity expansion to support revenues
Our View
- The company operates in a competitive, thin-margin segment
- It has delivered consistent growth in both revenue and profitability over the reported periods.
- Its ROE of 24.57% is superior to both Precision Wires and Ram Ratna Wires.
- Vidya Wires is priced at roughly 50% of the industry average P/E. Even if we account for the "small-cap discount" or liquidity risks, the valuation gap is substantial.
- Investors can consider subscribing for a medium to long-term perspective.
Frequently Asked Questions (FAQs)
1. Is Vidya Wires Ltd IPO good for long-term investors?
Yes. Strong ROE, profitability, and sector tailwinds make it attractive for long-term investors.
2. What is the price band of the IPO?
₹48–₹52 per share.
3. How does the company compare with peers?
It is priced much lower in terms of P/E while delivering better ROE.
4. What will the IPO funds be used for?
ALCU project setup, debt repayment, and general corporate needs.
5. What are the key risks?
Raw material dependency, limited insurance, and margin pressures.
Conclusion
Vidya Wires Ltd’s IPO offers a combination of strong fundamentals, attractive valuations, and sector-driven growth opportunities. Though risks exist, the company’s long-term prospects look positive.
If you're planning to invest in the IPO or build a long-term equity portfolio, Swastika Investmart provides a SEBI-regulated, research-backed platform with powerful tools and expert support.
%20(1).webp)
Vodafone Idea’s AGR Relief: How Government Intervention Can Impact Telecom Stocks
Key Takeaways
- Government AGR relief offers short-term breathing room to Vodafone Idea (Vi).
- Relief helps improve cash flow but does not fully resolve long-term liabilities.
- Telecom sector sentiment may stabilize, but competitive pressures remain.
- Vi still needs sustained fundraising and tariff hikes to stay viable.
- Investors should track government policy, ARPU trends, and 5G capex cycles.
The Indian telecom sector often stands at the intersection of policy, technology, and intense competition. Vodafone Idea (Vi), once a dominant player, has struggled for years under the weight of its Adjusted Gross Revenue (AGR) dues—a long-standing regulatory dispute that reshaped the industry’s financial landscape.
With the government recently extending AGR-related relief, investor interest has once again surged. But the key question remains: Does this relief materially change the future of Vodafone Idea and the telecom sector—or is it just a temporary lifeline?
This blog breaks down the implications for investors, telecom stocks, and market sentiment.
What Exactly Is Vodafone Idea’s AGR Relief?
AGR dues originate from a long legal battle where telecom operators were asked to pay levies on a broader revenue definition. Operators like Vi were hit the hardest.
Government relief measures have generally focused on:
- Extending payment timelines
- Moratoriums on AGR and spectrum dues
- Conversion of dues into equity
- Lowering interest burden through adjusted repayment structures
The recent relief package continues this policy approach—offering Vi more breathing space to rebuild operations without the immediate pressure of large outflows.
Why This Relief Matters for Vodafone Idea
Vodafone Idea has been facing:
- Heavy debt burden
- Declining subscriber share
- Intense price competition
- Large 4G and 5G capex requirements
- Shrinking ARPU (Average Revenue Per User)
A payment moratorium or restructured AGR timeline significantly impacts Vi’s near-term:
Cash Flow Stability
Immediate payments reduce operational risk and free up capital for network investments.
Fundraising Ability
Investors—both domestic and foreign—are more willing to fund a telecom player with policy support and enhanced solvency.
Market Perception
Government backing signals the intent to maintain a three-player market structure, avoiding duopoly.
Operational Continuity
Greater capital can flow into upgrading networks, improving service quality, and regaining competitive footing.
Impact on Indian Telecom Stocks
Government intervention in telecom typically triggers movement across the sector. Let’s break it down.
1. Positive Sentiment for Vodafone Idea
Short-term sentiment often improves due to:
- Reduction in bankruptcy risk
- Hope of fresh equity infusion
- Market confidence in policy continuity
Historically, Vi’s stock has reacted quickly to AGR-related announcements, especially during the 2021 telecom reform package.
2. Stability Boost for the Sector
Investors worry when a major player nears collapse. Relief reduces the risk of industry disruption, which is positive for the entire telecom ecosystem—from tower companies to equipment suppliers.
3. Limited Impact on Jio and Airtel
While Vi benefits disproportionately, rivals like Airtel and Jio continue to dominate due to:
- Stronger balance sheets
- Better spectrum holdings
- Faster 5G rollout
- Superior ARPU growth
They benefit indirectly through healthier industry structure, but their financial metrics remain unaffected by Vi’s relief.
4. Tariff Hike Cycle: The Real Game-Changer
Regardless of AGR relief, telecom sustainability depends heavily on tariff hikes.
India still has one of the lowest data prices globally, making periodic tariff adjustments vital.
If the relief allows Vi to remain competitive, the chance of coordinated tariff hikes increases—a powerful earnings catalyst for all telecom stocks.
Telecom Sector Outlook: What Should Investors Track?
ARPU Growth Trends
A small ARPU jump can dramatically expand profitability given the large user base.
Fundraising Progress
Vi must raise capital to maintain 4G expansion and 5G entry. Delays could negate the benefits of AGR relief.
Government Policy Continuity
The sector remains policy-heavy. TRAI recommendations, spectrum pricing changes, and further relief measures will shape valuations.
Market Share Dynamics
Subscriber movement between operators is a leading indicator of competitive strength.
Capex Cycles
5G rollout, fiber networks, and rural expansion still require large investments.
Real-World Example: Market Reaction to Past AGR Relief
In 2021, after the government approved a moratorium and allowed conversion of dues into equity:
- Vodafone Idea surged nearly 25–30% in a few days.
- Telecom tower companies like Indus Towers saw a relief rally.
- Brokerages revised short-term sector outlooks to “neutral to positive.”
This shows how sensitive telecom stocks are to regulatory decisions.
A similar pattern could emerge now—but sustaining gains requires fundamental improvement.
Does AGR Relief Make Vodafone Idea a Strong Investment?
The honest answer: It improves viability, but does not guarantee revival.
Strengthened Outlook
- Lower short-term financial pressure
- Higher chances of fundraising
- Improved service quality potential
Challenges Still Persist
- Intense duopoly from Airtel and Jio
- Losses and high debt
- Large capex needs
- Need for consistent tariff hikes
For investors, this becomes a calculated risk—not a clear turnaround story yet.
FAQs
1. What is AGR relief and why does it matter to Vodafone Idea?
AGR relief offers extended payment timelines and reduced financial pressure, improving Vi’s cash flows and operational stability.
2. Will Vodafone Idea become profitable because of this relief?
Not immediately. Profitability still depends on tariff hikes, subscriber retention, and successful fundraising.
3. How does this impact other telecom stocks like Airtel and Jio?
Indirectly positive. A stable three-player market reduces disruption and supports tariff discipline.
4. Should retail investors buy telecom stocks now?
Investors should focus on ARPU trends, financial health, and market share sustainability before committing.
5. Does this change long-term sector fundamentals?
Yes, to the extent that regulatory stability strengthens earnings visibility, but competition remains intense.
Conclusion
Vodafone Idea’s AGR relief is an important development that improves the sector’s financial stability and sustains competitive balance. But for Vi, it’s just the first step—successful fundraising, network upgrades, and ARPU growth are essential for a full turnaround.
Investors who want to participate in India’s telecom story should evaluate fundamentals carefully and rely on trusted research-backed platforms.
Swastika Investmart, a SEBI-registered broker with advanced tools, strong research capabilities, and dedicated customer support, helps investors navigate complex sectors like telecom with confidence.
Weekly Market Outlook: Key Triggers, Sector Trends, and What to Expect This Week
Key Takeaways
- Indian markets posted gains for the third straight week, supported by financials.
- Strong 8.2% GDP growth and global rate-cut optimism boost sentiment.
- FIIs remain sellers and rupee weakness may cap upside.
- RBI policy and November auto sales will be the most crucial triggers.
- Nifty and Bank Nifty show bullish bias with defined breakout and support zones.
Indian equity markets ended their third consecutive week in the green, despite range-bound activity across most sessions. Broader indices such as mid-caps and small-caps continued to outperform, supported by rotational buying and strong interest in financial stocks. The Sensex and Nifty gained around 0.6% each, while Bank Nifty surged over 1.5%, reflecting renewed confidence in banking heavyweights.
As we enter the week of November 29 to December 5, 2025, market sentiment is cautiously optimistic. A mix of strong domestic macro data, improving global cues, and upcoming policy triggers will shape the trading landscape. Let’s dive into the factors that will matter most for investors this week.
Domestic Market Drivers
Better-Than-Expected GDP Numbers Lift Sentiment
The National Statistics Office’s latest data reported an 8.2% year-on-year real GDP growth in Q2 FY26, beating market expectations. What stood out is that the expansion was broad-based:
- Manufacturing output grew 9.1%
- Services expanded 9.2%
This reinforces the resilience of domestic demand and provides confidence that India’s growth cycle remains intact, despite global uncertainties.
Such strong data often acts as a sentiment booster for sectors like banking, infrastructure, capital goods, and consumer discretionary.
Sectoral Performance: Pharma and PSU Banks Shine
The previous week saw:
- Pharma stocks performing well due to stable earnings, defensive positioning, and strong export orders.
- PSU banks continuing their upward momentum, supported by healthy credit growth and declining NPAs.
- PSU index, however, lagged the broader market as investors preferred private sector names and mid-caps.
Going ahead, investors may continue to find opportunities in:
- Pharma
- Private banks
- Financial services
- Domestically focused mid-caps
Global Market Influences
Global Rally on Fed Rate-Cut Hopes
Global equities rallied sharply last week as expectations of a potential U.S. Federal Reserve rate cut grew stronger. Softer-than-expected U.S. inflation data led to:
- Declining U.S. 10-year treasury yields
- Renewed risk appetite
- Strength in emerging market equities
For India, falling bond yields globally reduce external borrowing costs and support flows into risk assets.
However, despite supportive global cues, FIIs remain net sellers, which indicates that foreign flows may remain selective until currency volatility stabilizes.
Rupee Weakness: A Risk to Watch
The Indian rupee continues to show weakness against the dollar. This can impact:
- Import-heavy sectors
- Oil and gas companies
- Companies with dollar-denominated debt
A volatile currency also restricts aggressive FII buying, keeping near-term upside in check.
Key Triggers for the Week
RBI Monetary Policy (December 5, 2025)
The most important event this week will be the RBI’s monetary policy announcement.
In October 2025, the central bank kept the repo rate unchanged at 5.50%, citing:
- Cooling inflation
- Transmission of previous rate cuts
- Global trade uncertainties
The repo rate is currently at its lowest since August 2022, after a cumulative reduction of 100 basis points during the year.
While no rate cut is expected this week, markets will focus on:
- RBI’s commentary on growth and inflation
- Liquidity management stance
- Mandates on consumption and credit expansion
A dovish tone could support banks, NBFCs, autos, and real estate.
November Auto Sales (December 1, 2025)
Automobile sales data is a major domestic trigger. This release will provide insights into:
- Festive-season demand
- Urban vs rural consumption trends
- Inventory cycles
- Margin outlooks for OEMs
Strong numbers across:
- Passenger vehicles
- Two-wheelers
- Commercial vehicles
may lift market sentiment, whereas subdued data may put pressure on auto and ancillary stocks.
Technical Overview
Nifty 50: Consolidation With a Positive Bias
Nifty is currently consolidating after hitting fresh all-time highs. While profit-booking at higher levels is visible, the index continues to hold above key short-term moving averages.
Important Levels to Track
- Resistance Zone: 26,142–26,310
- Breakout Targets: 26,405 and 26,570
- Support Levels: 26,150 → 26,025 → 25,850
A move above the resistance band could trigger momentum buying, while a slip below 26,150 may invite short-term corrections.
Bank Nifty: Outperformance Continues
Bank Nifty remains the strongest major index, supported by heavyweights across private and PSU banks. The index is comfortably trading above its 20-day and 50-day moving averages, signalling sustained bullish momentum.
Key Levels
- Upside Trigger: 60,000 (psychological barrier)
- Next Target: 60,400
- Support Range: 59,400 and 59,000
A decisive move above 60,000 may attract strong institutional buying.
What Should Investors Do This Week?
Given the mixed global and domestic environment, a selective approach is essential.
Opportunities
- Banks & financials
- Automobiles
- Pharma
- Quality mid-caps
- Capital goods
Caution Required In
- Import-heavy sectors
- Currency-sensitive businesses
- High-valuation small caps
Investors should also stay updated on RBI policy commentary, currency movement, and global volatility.
FAQs
1. What is the main trigger for the market this week?
The RBI monetary policy announcement on December 5, 2025, will be the most crucial event.
2. Why are markets optimistic despite FII selling?
Strong domestic GDP growth, improving global cues, and robust sectoral performance have lifted sentiment.
3. Which sectors look strong this week?
Banks, financials, pharma, and auto stocks show promising setup.
4. What are the key technical levels for Nifty?
Resistance lies at 26,142–26,310, while supports are at 26,150, 26,025, and 25,850.
5. How will auto sales data impact the market?
Healthy auto numbers may boost demand confidence and support auto, metal, and financial stocks.
Conclusion
The week ahead presents a balanced mix of opportunity and caution for Indian markets. Strong GDP numbers, a global risk-on mood, and sectoral resilience provide support, but currency weakness and FII outflows may keep volatility elevated. Investors should track domestic triggers—especially RBI policy and auto sales—while adopting a stock-specific approach.
To navigate markets with expert-backed research, seamless trading tools, and personalised support, consider opening an account with Swastika Investmart.
%20(4)%20(5).webp)
India’s Q2 GDP Shoots Up to 8.2%: What This Means for Markets, Sectors & Investors in FY26
Key Takeaways
- India’s Q2 GDP grew 8.2%, beating estimates of 7.4%.
- Growth improved sharply vs 5.4% last year and slightly vs 7.8% in Q1 FY26.
- Manufacturing, construction, and services drove the expansion.
- Markets may see strong action in capital goods, banks, and consumption themes.
- Investors should watch RBI policy cues, inflation trends, and earnings upgrades.
India has delivered another strong economic signal, reporting Q2 GDP growth of 8.2%, far above market expectations of 7.4%. The latest print marks a sharp improvement from 5.4% a year ago and a steady climb from 7.8% in Q1 FY26, reinforcing India’s position as one of the fastest-growing major economies globally.
At a time when many advanced economies are struggling with slowdowns, India’s numbers highlight the resilience of domestic demand, strong policy momentum, and a continued push in infrastructure and manufacturing.
Let’s break down what is driving this growth—and more importantly, what it means for Indian markets, sectors, and investors as FY26 unfolds.
What Drove India's 8.2% GDP Growth in Q2 FY26?
1. Manufacturing Rebound Continues
Manufacturing expanded at a robust pace, supported by:
- Rising factory output
- Strong PMI readings
- Supply chain normalisation
- Higher capacity utilisation in key industries
Several listed companies in capital goods, auto components, chemicals, and electronics manufacturing have reported improved volume growth during the quarter.
2. Infrastructure & Construction Accelerate
The government’s ongoing capex push—highlighted in the last Union Budget—showed up clearly in construction GVA growth.
Examples of visible impact include:
- Rapid highway expansion under NHAI
- Railways capex at record levels
- Strong order books for EPC companies
This has boosted demand for cement, steel, construction equipment, and financing from PSU banks.
3. Services Sector Momentum
Services remained the backbone of growth, driven by:
- Retail consumption
- Financial services
- Logistics and e-commerce
- Travel and tourism revival
India’s digital ecosystem continues expanding, with UPI transactions touching fresh highs—another indicator of strong economic activity.
How Did Markets React to the 8.2% GDP Print?
The immediate market reaction was mildly positive, but the real impact will play out over the next few weeks as analysts revise earnings expectations for FY26.
Why GDP Matters to Markets
- Higher growth → Stronger corporate earnings
- Better consumption → Higher volume growth in FMCG, auto, retail
- Capex momentum → Boost for banks, capital goods, infra stocks
Historically, whenever GDP grows above 7.5–8%, sectors like banks, construction, capital goods, and discretionary consumption tend to outperform the broader indices.
Sectors Likely to Benefit the Most in FY26
1. Banking & Financial Services
Stronger GDP growth typically leads to:
- Higher credit demand
- Lower NPAs
- Improved loan growth for private and PSU banks
Nodal regulatory references like RBI’s FY26 credit outlook support this trend.
2. Capital Goods & Infrastructure
With strong order books and sustained government capex, this sector may continue to see momentum in order inflows and execution.
3. Manufacturing & Industrials
PLI scheme beneficiaries in electronics, pharmaceuticals, and renewable energy are expected to gain from rising investment flows.
4. Consumption & Retail
Higher disposable incomes and stable inflation improve urban and semi-urban consumption patterns.
5. IT & Digital Services
Although global headwinds remain, India’s digital expansion—startups, SaaS, fintech—could see renewed interest due to stable domestic macro conditions.
What Should Investors Focus on Next?
1. RBI Policy Cues
Higher GDP growth may strengthen the case for a pause in rate cuts. Investors should watch:
- Inflation trajectory
- Liquidity management
- RBI commentary on growth-inflation balance
2. Corporate Earnings
Q3 and Q4 earnings will reflect whether GDP growth is translating into improved profitability across sectors.
3. Global Economic Shifts
US interest rate decisions, crude oil movement, and geopolitical events will influence FPI inflows into Indian markets.
4. Budget FY26 Expectations
Investors will track:
- Fiscal deficit stance
- Capex announcements
- Tax or regulatory changes affecting consumption and markets
Relatable scenario:
If the government continues its capex-heavy strategy, infra-related stocks may see renewed buying, similar to the rally seen after the FY24 and FY25 Budgets.
What This Means for Retail Investors in FY26
For long-term investors, India’s strong macro fundamentals offer:
- Better earnings visibility
- Stable market environment
- A favourable backdrop for SIPs and long-term investing
Traders may see opportunities in banking, infra, and midcaps as sector rotation picks up.
For beginners or first-time market participants, platforms like Swastika Investmart, a SEBI-registered broker offering research-backed insights, easy tech-enabled trading, and round-the-clock support, make investing more accessible and informed.
FAQs
1. Why did India’s GDP grow 8.2% in Q2 FY26?
Strong manufacturing, infrastructure development, and resilient services demand were the key contributors.
2. How does rising GDP impact stock markets?
Higher GDP growth often leads to stronger corporate earnings and improved market sentiment, benefiting sectors like banks, infra, and consumption.
3. Will RBI change its policy after the GDP print?
RBI may maintain a cautious stance, focusing on inflation stability while acknowledging strong economic activity.
4. Which sectors are expected to gain the most from this growth?
Banks, capital goods, manufacturing, infra, and consumption-related sectors may see strong traction.
5. Is this a good time for new investors to enter markets?
With strong macro stability and positive earnings outlook, investors can consider staggered entry through SIPs or diversified portfolios.
Conclusion
India’s Q2 GDP growth of 8.2% reinforces the strength of its economic engine. As FY26 progresses, the combination of healthy domestic demand, strong capex push, and improving manufacturing activity sets a positive tone for markets and investors.
Whether you're a beginner or seasoned investor, having the right research and tools makes a difference.
Swastika Investmart, with its SEBI registration, robust research capabilities, and investor-friendly digital platform, can help you navigate the opportunities ahead.

.webp)
.webp)

.webp)


