
Turtlemint Fintech Solutions Limited IPO: Should You Apply, Wait, or Watch for Listing Momentum?


.webp)

Key Takeaways
- Turtlemint Fintech Solutions Limited IPO is priced at ₹144-₹152 with up to 5,80,70,398 shares (₹883 crore) and a lot size of 98.
- GMP data is not available yet, so the immediate demand signal is unclear.
- No financial snapshot is provided, making valuation and risk assessment difficult.
- Action: watchlist this IPO for now and decide after GMP, subscription trends, and final allotment data emerge.
IPO details at a glance
GMP signals and demand: what's known so far?
GMP data is not available yet. In IPO markets, a positive grey-market price can hint at healthy early demand and potential listing gains, but the absence of GMP data here means investors lack an early demand signal. The quota mix shows QIB, NII, and Retail allocations (1,74,21,119; 29,03,520; 13) but the exact percentage split and official demand indicators will come only with the formal subscription builds. Given these uncertainties, investors should not rely on early signals alone.
Valuation and risk: is the ₹144-₹152 band justified?
There is no posted revenue or profit figure in the source, so anchoring a valuation against earnings is not possible yet. The IPO size is sizeable (₹883 crore) and includes a significant fresh issue (₹661 crore) plus OFS (₹222 crore); the impact on the company's equity base and potential dilution will depend on future performance and use of proceeds. Retail investors should weigh the risk of uncertain financial visibility against the potential upside if future growth is strong and demand remains healthy post-listing.
Should investors apply? Pros and cons
Pros: a large, book-built issue with access for retail investors and a listing on two major exchanges could offer liquidity if demand stays robust. Cons: no financials in the public domain from the source, no explicit promoter track record details, and GMP data not yet available, which makes it hard to gauge demand and fair value. The lack of clarity around registrar and lead managers also raises execution risk, though this may be resolved before bidding closes.
How to apply: UPI and ASBA guide
Two common routes exist for Indian IPOs: UPI-based bidding and ASBA. For UPI-based bidding, you typically login to your broker's IPO portal, select Turtlemint Fintech Solutions Limited, choose the number of lots (each lot is 98 shares) and the price band within ₹144-₹152, then approve the UPI payment to place the bid. The funds are debited only if you are allotted the shares. For ASBA, you place the bid and authorize your bank to block the bid amount; the funds remain blocked until allotment results are announced. If you need help, your broker can walk you through the exact UI steps–just ensure your UPI/ASBA bank and app are linked and ready.
Allotment & listing timeline
Open: 19 Jun 2026; Close: 23 Jun 2026; Listing: 29 Jun 2026 on BSE & NSE. Allotment date and registrar/lead-manager specifics will be announced closer to the window close; keep an eye on the exchange notices for the final schedule.
FAQ
Is Turtlemint Fintech Solutions Limited IPO worth applying for at ₹144-₹152?
Given the absence of a financial snapshot and GMP data in the source, it is challenging to assign a fair value; investors with high risk tolerance and appetite for listing momentum may consider monitoring the stock before applying.
What is the price band and lot size for the Turtlemint Fintech Solutions Limited IPO?
The price band is ₹144-₹152 per share and the minimum bid lot is 98 shares.
When does the IPO open and close for Turtlemint Fintech Solutions Limited?
Open on 19 June 2026 and close on 23 June 2026; listing is expected on 29 June 2026.
What is the mix of Fresh Issue and OFS in this IPO?
Fresh Issue: 4,34,68,552 shares (up to ₹661 crore); OFS: 1,46,01,846 shares (up to ₹222 crore). Total issue size: 5,80,70,398 shares (₹883 crore).
What is GMP status and why does it matter?
GMP data is not available yet; a positive grey-market price can hint at healthy early demand, but absence of GMP data means investors lack an early demand signal.
What should I watch for before allotment and listing?
Monitor GMP developments (if released), official subscription trends, registrar/lead-manager announcements, and the final allotment data after 23 June 2026.
Conclusion
For retail investors, Turtlemint Fintech Solutions Limited IPO represents a sizable, book-built offering with a clear listing timeline, but it lacks fundamental disclosure in the material provided (no revenue/profit figures) and currently has no GMP signal. This makes it a higher-uncertainty bet that should be approached with caution and only with capital you can afford to risk. Watchlist – there is no GMP signal yet and no financials disclosed, so gather data and decide after the market opens and the subscription pace becomes clear.
Big Budget


.avif)
.avif)
.avif)
.avif)
.avif)


.avif)
.avif)
.avif)
.avif)
Latest Articles
Telegram is Getting Banned: Here's What Every Indian Retail Trader Must Do Right Now


On June 16, 2026, millions of Indian traders woke up to a shocking surprise. Telegram was gone.
For them, this means no morning trade alerts, no buy-this-stock messages, no updates from the trading groups they had been following for months, sometimes years. Just silence.
The Indian government blocked Telegram across the entire country using Section 69A of the IT Act. The official reason was to stop fraud during the NEET-UG re-exam, where cheating rackets were reportedly selling fake question papers for ₹5,000 to ₹50,000. But the impact went far beyond students.
For India's massive retail trading community, this was not just a messaging blackout. It was a sudden cut-off from the app that millions had built their entire trading routine on.
India has over 15 crore unique registered investors today. A large portion of them were depending on Telegram groups every single day for trade tips, buy and sell signals, and market news. When the app went dark, so did their trading compass.
This blog is for every retail trader who felt that panic. We will tell you what happened, what the real risks were all along, and most importantly, what you should do right now.
Why Did Retail Traders Love Telegram So Much?
To understand why the ban hurt so many traders, you first need to understand why Telegram became so important to them in the first place.
It was not just a messaging app. For retail traders in India, Telegram was infrastructure. It was where trading happened before the market even opened.
Anyone could join a channel and start receiving buy and sell calls within seconds. No fees. No registration. No waiting. Telegram trading groups had up to 1 lakh members, and it genuinely felt like being inside a live trading room where hundreds of people were sharing real-time ideas together.
Breaking news, result announcements, F&O data, intraday ideas, everything came straight to your phone the moment it happened. And unlike Instagram or Twitter, Telegram showed every single message in order. Nothing was filtered or hidden by any algorithm.
Around 80% of young adults in India now receive financial advice through social media, and Telegram was the biggest hub for real-time trading signals. It felt like the smartest, fastest, most connected way to trade.
But there was a very dangerous side to all of this. And most traders chose not to look at it.
What the Telegram Ban Means for Traders
The ban has directly disrupted the daily trading life of crores of Indians. Here is what has changed overnight.
The buy and sell calls you depended on every morning are no longer arriving. For intraday traders especially, missing even one alert can mean a missed opportunity or an unexpected loss. The fast news updates and F&O data you were getting from channels are no longer accessible. The communities where you discussed ideas and learned from others are suddenly silent.
Trading is a routine-driven activity. When a core part of that routine disappears overnight, decision-making becomes harder and more stressful. Many traders are feeling genuinely lost right now.
But here is the question worth sitting with for a moment. Was depending on Telegram for all of this actually helping your trading? Or was it quietly working against you? The honest answer may surprise you.
The Risks of Telegram Trading That Nobody Talked About
Most traders never thought too deeply about where their tips were coming from. The signals felt real, the groups felt active, and occasionally a call would actually work out. That was enough to keep the habit going, but here is what was actually happening behind the scenes.
You were Trusting Strangers With Your Money
Most Telegram trading channels are run by completely anonymous people. You have no idea who they are, whether they have any real knowledge of markets, or whether they are even registered with SEBI as investment advisors. Every time you acted on one of those tips, you were trusting your hard-earned savings to someone you knew absolutely nothing about.
Nobody Was Accountable When Things Went Wrong
When a tip goes wrong, and you lose money, what happens? The channel admin either disappears, blames the market, or simply moves on to the next call. There is no accountability. No refund. No explanation. You bear the entire loss alone.
You were not getting tips. You were being used as the exit for someone else's trade.
The 93% Loss Number That Every Trader Must Know
SEBI conducted a landmark study on retail trader performance in India. The results were devastating. Between 91% and 93% of retail investors in the Futures and Options segment suffered losses in FY25. The total losses across these traders added up to ₹1.05 lakh crore. The average loss per trader was around ₹1.1 lakh.
The Telegram ban has removed something you depended on. But for many traders, it has also removed something that was quietly destroying their financial and mental wellbeing.
What Should An Investor Do Right Now?
First, do not panic because the ban is temporary. Use this week to make changes that will protect you long after Telegram comes back.
Stop Acting on Unverified Tips
This is the single most important decision you can make. If you do not know who is giving you advice, what their track record is, and whether they are registered with SEBI, do not put your money on the line based on what they say. It really is that simple.
Look for SEBI-Registered Advisors and Platforms
There are registered investment advisors and research analysts in India who are legally accountable for the recommendations they make. These are people who cannot simply disappear when a call goes wrong. Seek them out. Pay for proper advice if needed. It will cost far less than the losses from bad tips.
Start Building Your Own Understanding of Markets
Even basic knowledge helps. Learning how to read a chart, understanding what support and resistance mean, or knowing how to look at a company's quarterly results can dramatically reduce your dependence on external signals. Use this quiet week to start.
Spread Your Information Sources
Follow official BSE and NSE updates. Read credible financial news. Do not funnel everything through one app that can disappear overnight.
Meet Sarthi: The Trading Companion Built for You
At Swastika Investmart, we have been watching this problem grow for years. We understood the need traders have for timely, useful market ideas. And we built a proper solution.
Sarthi is a dedicated trade ideas feature inside the Swastika Investmart app, built specifically for Indian retail traders who want reliable, research-backed guidance without any of the risks that come with Telegram groups. Here is what Sarthi actually does for you every single day.
Complete Trade Ideas Across Equity, F&O, Intraday, and Commodity
Whether you trade stocks, futures and options, or commodities, Sarthi covers it all. Every trade idea comes with a clear entry price, a target price, and a stop loss. You know exactly where to enter, what profit you are aiming for, and at what point to exit if the trade goes against you. No guesswork. No vague "buy this stock" messages. Just complete, actionable information every time.
Call Type Notifications So You Never Miss a Trade
Sarthi sends you call type notifications directly through the Swastika app the moment a new trade idea is published. You do not need to keep checking a group chat or scrolling through hundreds of messages to find the one tip that matters. The alert comes to you, clearly labelled, ready to act on.
One Click Trade
This is where Sarthi truly stands apart. When you receive a trade call and want to act on it, you do not need to open a separate trading app, search for the stock, and manually fill in all the details. Simply tap Trade on the call. Sarthi takes you directly to the trading dashboard with everything already filled in, such as the stock, the entry price, the stop loss, and the target. All you need to do is enter the quantity and tap to place your order. That is it. From seeing the idea to placing the trade, the whole thing takes just a few seconds. In a market where timing matters, this is a genuine advantage.
A Full Track Record of Every Call Made
This is something no Telegram group ever gave you. Sarthi shows you the complete performance history of every trade idea that has been published. You can see exactly how past calls performed, what the success rate looks like, and how the research team has done over time. Full transparency, nothing hidden. Before you follow any idea, you already know the track record behind it.
Built for Both Beginners and Experienced Traders
Whether you have been trading for ten years or you are just starting, Sarthi is designed to make sense to you. The trade ideas are presented in simple, clear language. A beginner can understand what to do without needing to decode jargon. An experienced trader gets the depth and detail they need to make a confident decision. Everyone gets the same quality of research.
Telegram vs Sarthi: A Comparative View
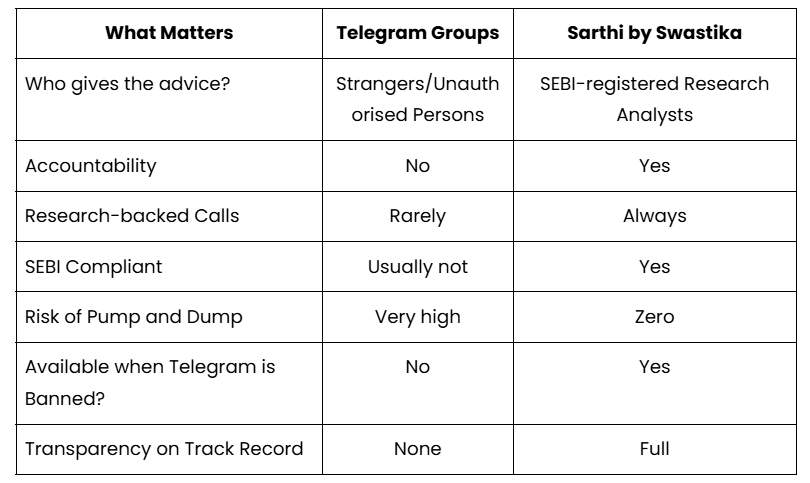
Overall, we can say that one is a gamble dressed up as a trading community. The other is a system built on trust, research, and accountability.
Over to You: Invest Your Money Wisely
The Telegram ban will lift on June 22, 2026. The app will come back. The groups will reopen. The tips will start flowing again, but you do not have to go back to the way things were.
SEBI's data tells us that 93 out of every 100 retail traders in the F&O segment lost money last year. That is not bad luck. That is a pattern. And a large part of that pattern is driven by the impulsive, herd-driven tip culture that Telegram made so easy to fall into.
This week of silence is a rare gift. A forced pause. A moment to honestly ask yourself: Am I trading with a proper system, or am I just following the crowd and hoping for the best?
The best traders are not the ones who get the most tips. They are the ones who get the right advice, from the right people, backed by real research. That is exactly what Sarthi is built to give you. Do not wait for the next ban to change how you trade. Make the shift today.
Disclaimer: This blog is for informational purposes only and does not constitute investment advice. Stock market investments are subject to market risks. Please read all scheme-related documents carefully before investing.

Petrol Diesel Prices Unchanged June 17 City-Wise Rates Across India
Key Takeaways
- Petrol and diesel prices remained unchanged on June 17 across city-wise rates.
- City-wise rates were static for major Indian cities from the previous day.
- Rates differ by city due to local taxes and VAT, as shown in the report.
- Stable fuel pricing can influence investment considerations in energy stocks and sectors.
petrol diesel prices unchanged June 17 city-wise rates across India: what happened?
As reported by 5paisa, petrol and diesel prices were unchanged on June 17 when looking at city-wise rates, with the table showing flat rates in the listed cities compared with the day before. This kind of update is typical of the daily pricing cycle where local tax structures and consumer demand influence the headline numbers, but on this date no city recorded a price change.
how city-wise fuel price stability impacts Indian stocks and inflation risk
Flat fuel prices can influence inflation dynamics by reducing near-term pressure on transportation costs and consumer prices. For investors, this can translate to more stable input costs for sectors such as FMCG, logistics, and manufacturing, potentially affecting earnings trajectories for energy and transport-related stocks.
which sectors are most affected by steady petrol price trajectories in different Indian cities
Energy marketing companies (OMCs) and logistics players are among the fastest to reflect local fuel price stability in their earnings profiles. If city-level rates remain flat over a longer period, OMCs may experience steadier margins, while freight and transport-heavy businesses may see relatively predictable cost baselines across major markets.
how to track city-wise petrol and diesel prices for smarter investment decisions
Investors can monitor daily city-wise rates through trusted price trackers, official government releases, and aggregators like the 5paisa city-wise table. By mapping price changes to your portfolio’s exposure to transport and energy equities, you can adjust position sizing to manage regional risk. Remember to consider local tax changes and policy updates that can shift city-level pricing patterns over time.
why this price stability matters for OMCs and energy ETFs
When petrol and diesel prices hold steady across city-wise rates, OMCs may enjoy more stable retail margins in the near term. For investors, this can influence the relative attractiveness of energy ETFs and buy-hold strategies versus more active rotations in response to price moves. Keep an eye on policy signals and refinery run rates that could alter the outlook for stock-specific catalysts.
In summary, the June 17 city-wise price stability offers a quiet moment in the fuel pricing cycle, with implications for consumer inflation, corporate margins, and stock selection in energy-related spaces. Use this insight to recalibrate your near-term assumptions and stay ready to adjust as policy or market conditions evolve.
The article reports price stability; it does not forecast future changes. Treat this as a snapshot of the current price state.
FAQ
Did petrol and diesel prices change on June 17?
No; petrol and diesel prices remained unchanged across city-wise rates on June 17, per the 5paisa report.
What does 'city-wise rates' mean?
It refers to the per-city price per litre; rates vary by city due to local taxes, VAT, and other factors, with the article listing the cities and rates.
Who published the June 17 city-wise rates update?
5paisa published the update, summarizing the city-wise rates for petrol and diesel on June 17.
Where can I view the city-wise rates?
You can view the city-wise rates in the 5paisa article linked in the source material.
What does unchanged pricing imply for investors?
The article reports price stability; it does not forecast future changes. Treat this as a snapshot of the current price state.
Conclusion
For the retail investor, steady petrol and diesel prices across city-wise rates suggest a temporary breathing room in price pressures that can affect consumer inflation, sector earnings, and stock selection. The main takeaway is to translate city-level price signals into portfolio-level implications–watch how transportation and energy names respond as the price backdrop remains stable. Use this moment to refine your mental model: city-wise price stability reduces near-term fuel-driven volatility, but be prepared for policy changes that could disrupt this calm.
Next step: incorporate city-level fuel price awareness into your stock analysis, using tools like Swastika's Sarthi AI to simulate how OMCs and energy ETFs might perform if price stability shifts. Consider a small, measured exposure to energy equities or ETFs with clear exposure to mobility and fuel sectors, while maintaining discipline on risk and diversification.

Coforge FY30 Revenue Target: Why Nomura Sees Up to 50% Upside
Key Takeaways
- Coforge targets $5 billion revenue by FY30, signaling a major growth milestone.
- Nomura and peers see up to 50% upside in Coforge shares.
- The stock is in focus as investors weigh this ambitious plan.
- Retail investors should assess risk vs reward before investing.
Coforge FY30 revenue target: what it means for investors in Indian IT stocks
From a retail investor perspective, a $5 billion revenue target by FY30 signals a potentially larger, more scalable business. Hitting such a milestone would likely require sustained growth across Coforge's core verticals, consistent demand for digital services, and expansion into new geographies. The target reflects Coforge's ambition to scale in a market where digital outsourcing remains a growth tailwind for Indian IT players. While targets are forecasts and not guarantees, execution risk and macro factors can affect outcomes.
Nomura's upside view: why analysts see up to 50% upside in Coforge shares
The Economic Times article notes that Nomura and other brokerages see Coforge as capable of delivering substantial upside, with some estimates pointing to as much as 50% upside. This kind of upside typically arises from stronger revenue growth visibility, potential deal wins, and market re-rating as confidence in Coforge's long‑term trajectory improves. Investors should treat such upside as the market's sentiment and consensus view rather than a guaranteed return.
How Coforge can reach $5 billion in revenue by FY30: potential growth drivers and milestones
To hit the target, Coforge would likely need sustained demand across its digital services portfolio, robust deal momentum, and expansion into new geographies, especially North America and Europe. The article does not enumerate a formal plan, but in practice such a trajectory relies on cross-sell to existing clients, investments in cloud-native offerings, and disciplined execution to protect margins. Execution risk exists, yet the target provides a clear long-horizon objective that could attract investors if progress is visible in quarterly results.
Retail investor takeaways: balancing risk and opportunity in Coforge stock
For a retail investor in India, Coforge represents a classic risk‑reward proposition: upside from a growth milestone against execution and market risk. Key things to monitor include order momentum, client concentration, utilization trends, and how Coforge funds growth while preserving margins. A measured entry, clear risk controls, and regular portfolio reassessment can help manage volatility in a growth stock like Coforge, especially in the IT services space.
Risks and catalysts for Coforge stock in the near term
While the target and upside view are compelling, investors should watch for catalysts such as quarterly results, commentary on deal wins, and any macro shifts in IT spend that could impact Coforge. Conversely, catalysts like stronger order momentum or favorable macro shifts could accelerate the stock’s run, particularly if the market re-rates Coforge higher as growth becomes clearer.
FAQ
What revenue target is Coforge aiming for by FY30?
Coforge targets $5 billion in revenue by FY30.
Which brokerages see upside in Coforge shares according to the article?
Nomura and other brokerages see up to 50% upside.
Why are Coforge shares in focus in the market?
Coforge shares are in focus due to the firm’s ambitious revenue target by FY30 and the potential upside highlighted by analysts.
What is the potential upside mentioned for Coforge stock?
Up to 50% upside as cited by Nomura and peers.
Where can retail investors learn more about Coforge using AI stock research?
Swastika's Sarthi AI stock assistant provides institutional-grade research to retail investors; learn more at Swastika's site.
Conclusion
The Coforge story, anchored by a bold FY30 revenue target and a bullish view from Nomura and peers, presents a high‑conviction growth idea within Indian IT stocks for retail investors willing to tolerate volatility and execution risk. The key takeaway is to evaluate whether Coforge’s long‑term revenue ambition aligns with your risk tolerance and portfolio goals.
Two practical steps to apply now: use a scenario‑based framework (Base/Bull/Bear) to test Coforge’s price targets, and consider a disciplined entry approach with defined risk controls; if the implied value looks compelling, a measured position may be warranted while closely watching quarterly results and order momentum.
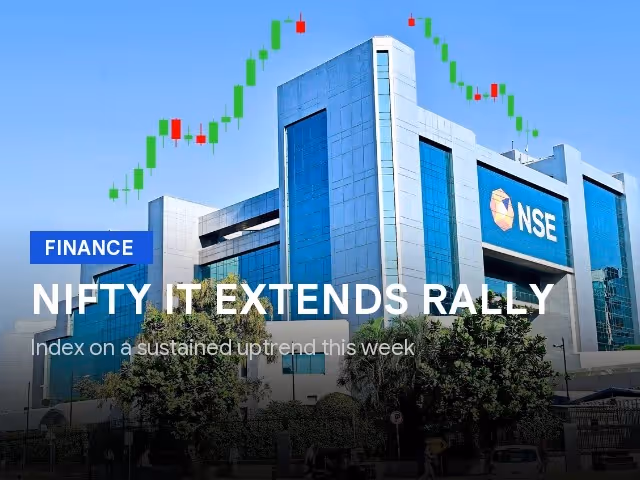
Nifty IT Extends Rally: TCS Infosys Coforge Lead Gains Amid US-Iran Peace Mood
TLDR
- Nifty IT rally extended led by TCS, Infosys, Coforge.
- US-Iran peace mood fuels risk-on in Indian tech.
- IT index outperforms as global cues improve.
- Retail investors should watch near-term levels; Sarthi AI can help.
Can a peace deal between the US and Iran sustain India's tech rally? The latest trading session suggests investors are embracing risk, lifting Indian IT counters such as TCS, Infosys, and Coforge as the Nifty IT index extends its rally amid the risk-on mood.
What drove Nifty IT higher today as TCS Infosys Coforge led the gains?
Nifty IT extended its rally with top gainers including TCS, Infosys, and Coforge. The broader market mood turned risk-on on hopes of a peace deal between US and Iran, which boosted sentiment across equities including IT. Investors rotated into the IT pack, seeking exposure to growth-oriented names amid improving global appetite for risk. The move underscores that Indian IT brands remain a focal point for domestic funds and retail investors as the sector continues to ride strong demand in outsourcing and digital services.
For deeper stock-specific insights on these leads and others, Swastika's Sarthi AI stock assistant can deliver institutional-style research to retail investors.
Which Indian IT stocks led the rally and why did Coforge join TCS and Infosys?
The article highlights TCS and Infosys as primary movers, with Coforge joining the rally. The exact reasons for Coforge's outperformance aren't detailed, but the broader risk-on mood and sector-wide buying interest appear to carry Coforge along with the large-caps. This suggests that investors are favoring a mix of entrenched industry giants and mid-cap IT names, especially those with exposure to digital services and vertical-specific solutions.
How does the US-Iran peace deal mood influence risk appetite and Indian IT stocks?
The news of potential peace talks between the US and Iran has shifted global markets into risk-on territory. In India, that sentiment often translates into buying in sectors considered growth-oriented, including IT stocks such as TCS, Infosys, and Coforge. This mood can push the Nifty IT index higher, though, as always, investors should be mindful of near-term volatility and the possibility of pullbacks if headlines shift or if global cues turn sour.
What should retail investors do next: timing and risk management for IT names?
With the rally in IT stocks, retail investors should balance momentum with fundamentals. Key considerations include valuations relative to earnings growth, exposure to outsourcing demand, and the quality of order books across big names like TCS and Infosys. A disciplined risk approach–setting stop losses, maintaining diversification, and avoiding overconcentration in a single theme–can help manage downside risk. For stock-specific insights, you can use Sarthi AI to compare growth, margins, and valuation across IT names and tailor watchlists accordingly.
FAQ
What triggered the Nifty IT rally?
A risk-on mood driven by news of a potential US-Iran peace deal, lifting IT counters such as TCS, Infosys, and Coforge.
Which Indian IT stocks led the gains in the Nifty IT index?
TCS, Infosys, and Coforge led gains in the Nifty IT index.
How did the US-Iran peace deal mood influence Indian IT stocks?
The peace-deal headlines boosted global risk appetite, supporting the Nifty IT index and the IT names.
What should retail investors consider after this rally?
The article describes gains and a risk-on mood; investors should base decisions on their own analysis and risk tolerance, and consider diversification.
What is Swastika's Sarthi AI and how can it help retail investors?
Sarthi AI is Swastika Investmart's stock assistant that provides institutional-level research on stocks or indices to retail investors, aiding decision-making.
Where can investors get more insights from Swastika's research?
Investors can access Swastika's research reports and the Sarthi AI tool for stock-specific analysis.
Conclusion
The rally in Nifty IT, signals a risk-on mood for Indian tech giants, with TCS, Infosys, and Coforge among the standout gainers. For the retail investor, this environment offers upside potential, but it also brings IT-specific volatility and sensitivity to global macro shifts. The key takeaway is to treat this rally as a prompt to refine your watchlist and approach rather than a guaranteed path to gains.
Next step: adopt a pragmatic mental model–separate the momentum narrative from fundamentals. Use a structured framework to identify quality leaders, set clear risk controls, and reassess IT exposure as global cues evolve. Swastika's Sarthi AI can help you surface high-conviction names and monitor price levels, turning market signals into a disciplined, research-backed action plan.
Open your trading and demat account here

Motilal Oswal Bets on Indian Bank Stocks: HDFC Bank ICICI Bank Shriram Finance AU Small Finance Bank Nuvama – What Retail Investors Should Know
Key Takeaways
- Motilal Oswal's latest bets center on Indian banks, led by HDFC Bank and ICICI Bank.
- Shriram Finance, AU Small Finance Bank, and Nuvama broaden the financials tilt.
- Retail investors should focus on durable earnings and valuations in financials.
- Diversify and stay aligned with risk tolerance amid rate cycle shifts.
In a move that could influence how Indian retail investors think about financials, Motilal Oswal Financial Services highlighted a set of bank. The full list includes HDFC Bank, ICICI Bank, Shriram Finance, AU Small Finance Bank, and Nuvama. This article breaks down what the picks mean for your portfolio and how to translate a broker's note into a practical investment plan.
Motilal Oswal's latest bank stock bets explained: the five names in focus and why they matter
HDFC Bank and ICICI Bank are the anchors. As the two largest private banks by market capitalization in India, they benefit from strong retail deposit bases, scalable loan books, and robust risk controls. The broker's note signals continued confidence in these franchises, which have delivered consistent earnings growth and resilient asset quality in various rate environments. Shriram Finance, an established NBFC with a focus on retail lending, adds a different flavor by targeting consumer finance in a segment where demand remains sticky. AU Small Finance Bank provides a microcosm of the large private bank growth story in a smaller, more granular format, with expansion driven by focused lending and improving asset quality. Nuvama rounds out the list, representing the convergence of wealth management and research for Indian retail investors and signaling the value of integrated financial services in a volatile market.
What does this mean for Indian retail investors
For retail investors, the list underscores a tilt toward high-quality private banks that have historically shown resilience, stable earnings, and the ability to grow deposits and loans even as macro conditions shift. This can offer a degree of ballast to a stock portfolio dominated by financials, particularly in a market where cyclicals and tech have shown more volatility. Yet valuations in top private banks have stretched in the past few years, so the emphasis on HDFC Bank and ICICI Bank is a reminder to balance potential returns with price discipline. The inclusion of Shriram Finance and AU Small Finance Bank points to a continuum in the financials space, from large players to niche lenders with improving asset quality and expanding footprints. Nuvama's presence hints at the growing appetite for integrated research and advisory offered through fintech-enabled platforms, which may help retail investors navigate this sector better.
Why Shriram Finance AU Small Finance Bank and Nuvama feature in Motilal Oswal bets
Shriram Finance brings NBFC exposure with a strong consumer finance footprint, which in turn benefits from steady retail credit demand. AU Small Finance Bank demonstrates the bank's ability to grow in a controlled manner with a focus on disciplined lending and improving coverage. Nuvama's inclusion signals a broader trend toward offering research and wealth management in one place, a feature that can be beneficial to retail investors seeking a holistic view of markets. The combination of these names with HDFC and ICICI Bank suggests a strategy of combining quality, scale, and growth opportunities across different segments of India's financial sector.
What are the risks and what should retail investors do next
As with any bank-focused strategy, a few macro headwinds could impact performance. Interest rate changes, inflation, and RBI policy stance can influence bank net interest margins and credit costs. A sector with high valuations requires careful entry and exit discipline to avoid short-term volatility turning into long-term underperformance. If you are considering aligning with this list, you might opt for a core allocation to the high-quality banks while adopting a satellite approach to NBFCs and smaller banks. A structured approach–defining your risk tolerance, setting a clear time horizon, and using stop-loss levels–can help you navigate the risk-reward framework. And when you want deeper numbers and a granular view of each name, Swastika's Sarthi AI stock assistant can provide institutional-level research to compare these names on fundamentals, valuations, and risk metrics.
One essential caveat: broker picks reflect a particular view, not a guaranteed pathway to profits. Use the list as a guide rather than a blueprint and ensure your decisions are aligned with your goals and constraints. A practical step is to start with a small core exposure to HDFC Bank and ICICI Bank, then gradually add the others as your comfort with the sector grows and as earnings and macro signals validate the case.
FAQ
Which five stocks are included in Motilal Oswal's latest bank stock bets?
HDFC Bank, ICICI Bank, Shriram Finance, AU Small Finance Bank, and Nuvama.
What sector is the focus of Motilal Oswal's bets?
Banking and financial services, with emphasis on large-cap banks and select NBFCs.
Should retail investors copy Motilal Oswal's picks?
Not necessarily. Use the picks as a signal, and align investments with your own risk tolerance, time horizon, and diversification needs.
What factors could affect the performance of these bank stocks?
Macro factors such as interest rate policy, credit cycles, inflation, and overall economic growth, along with valuation levels.
Conclusion
For retail investors, Motilal Oswal's battery of bank stock bets signals a continued preference for financials, particularly high-quality private banks with durable earnings. The story is not a buy signal by itself, but it gives you a framework to examine valuations, earnings quality, and growth opportunities across India's financial sector. The practical takeaway is to think in terms of risk-adjusted ballast–core holdings in the stalwarts, complemented by selective bets in NBFCs and smaller banks where fundamentals are improving and valuations still look reasonable.
Open your trading and demat account here
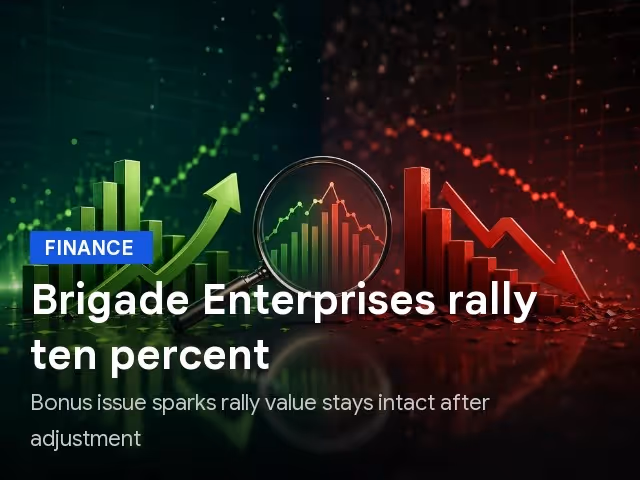
Brigade Enterprises Bonus Issue: 10% Rally, 22% Dip Explained for Indian Retail Investors
Key Takeaways
- Brigade Enterprises rallied ~10% after the bonus issue, despite a 22% prior plunge.
- The move is likely sentiment-driven, not a fundamental upgrade.
- Retail investors should avoid chasing price moves and assess fundamentals.
- Use Swastika's Sarthi AI stock assistant for deeper, institutional-grade analysis.
When Brigade Enterprises announced a bonus issue, its stock jumped about 10% in the immediate trading session, even after a prior 22% decline. This juxtaposition–short-term strength after a corporate action on the backdrop of a sizable prior fall–creates a moment of tension every retail investor should study. In this article, we unpack what this price action means, how to interpret it, and what it implies for the typical Indian investor using Swastika Investmart's tools to frame a decision.
brigade enterprises bonus issue impact on share price
A bonus issue is a corporate action that issues additional shares to existing shareholders at no cost, increasing the total outstanding shares. While it may improve liquidity and expand the investor base, it does not inject new cash into the company and typically does not change the fundamental earning capacity of the firm immediately. The Economic Times piece notes Brigade Enterprises saw a roughly 10% rally after the bonus announcement, even though the stock had already swung down by about 22% earlier. That price move is more a story of market mechanics–share-count adjustment, demand-supply dynamics, and speculative trading–than an immediate signal of better business prospects.
From a value perspective, the post-bonus rally should be interpreted with care. An increase in share count can dilute earnings per share (EPS) unless the company funds growth or the price rises proportionally. Hence, a 10% price rise is not a guaranteed predictor of future profitability. For a retail investor, the key takeaway is to separate the effect of the corporate action on the stock's price from any change in the companys fundamental fortunes.
why brigade enterprises rallied after bonus issue
The 10% rally following the bonus issue is consistent with a typical market reaction where traders exhibit a short-term price bounce around corporate actions. Such moves can be driven by perceived improvements in liquidity, increased investor interest, or a temporary mismatch between supply and demand after new shares are issued. However, the article emphasizes that the rally should not be mistaken for a fundamental improvement in Brigade Enterprises earnings or cash flows. The earlier 22% plunge suggests the stock has been volatile and may have priced in risks that are not automatically resolved by a bonus issue.
In short, the rally's drivers are likely technical or sentiment-based rather than reflective of a credible upgrade in the companys core business. This is a reminder to separate price action from business fundamentals and to consider the broader macro environment and sector trends when interpreting such moves.
For investors seeking a clearer view, a methodical approach can help. Look at the companys balance sheet, debt levels, project pipeline, and cash flow visibility before forming a judgment about whether the stock deserves new capital. If you want a deeper, numbers-driven perspective, you can request a tailored report via Sarthi to evaluate Brigade Enterprises in a multi-quarter framework.
how should indian retail investors interpret brigade enterprises price action
Indian retail investors should view the post-bonus rally as a data point rather than a signal of immediate value creation. The key takeaways are: (1) price moves following a corporate action can be short-lived and do not guarantee future profitability; (2) a prior drawdown may reflect risk factors that require fundamental recovery; (3) always corroborate price action with fundamentals and sector trends. In Brigade Enterprises case, the 10% rally occurred within days, but there is no detailed information in the article about improvements in earnings, order book, or balance-sheet strength that would justify sustained upside.
To translate price action into a potential investment decision, use a structured framework. Compare valuations with sector peers, assess net debt, and verify the sustainability of any reported project revenue or backlog. If your plan is to invest, you might want to see how Brigade stacks up against comparables before committing capital; Sarthi can help by summarizing results and benchmarking against peers in the real estate sector.
what next for brigade enterprises investors after the rally
The prudent course after a 10% rally is not to chase the stock higher but to seek clarity on fundamentals. Watch for upcoming quarterly results, management commentary on project pipelines, debt reduction plans, and any dividend announcements that could influence long-term value. In the absence of a credible fundamental upgrade, investors should be prepared for possible volatility and mean reversion as the market digests the corporate action and any accompanying news.
Before taking a position, align this stock with your risk tolerance and investment horizon. If you are a long-term investor, you may await more visibility on Brigade Enterprises' order book and cash flow generation. If you are a short-term trader, acknowledge the potential for volatility around corporate actions and implement disciplined risk management. Ensure that you do not over-allocate to a single name and maintain a balanced portfolio.
FAQ
What happened to Brigade Enterprises stock after the bonus issue?
The article notes a roughly 10% rally after the bonus issue, while the stock had previously fallen about 22%.
Why did Brigade Enterprises rally after the bonus issue?
The rally is described as sentiment-driven and not a fundamental upgrade; it reflects price action around a corporate action rather than a change in business fundamentals.
Should Indian retail investors buy Brigade Enterprises after this move?
The article suggests caution and emphasizes focusing on fundamentals rather than chasing short-term price moves.
What should I watch next for Brigade Enterprises?
Look for upcoming quarterly results, management commentary on projects, debt levels, and any new information that could affect fundamentals.
How can Sarthi help with Brigade Enterprises analysis?
Sarthi provides AI-driven, institutional-grade research on stocks, helping retail investors analyze Brigade Enterprises beyond headline price moves.
Conclusion
In the near term, Brigade Enterprises’ 10% rally after a bonus issue should be interpreted with caution. Price moves around corporate actions are common in Indian markets and often reflect supply-demand dynamics more than a refreshed business outlook. As a retail investor, keep your focus on fundamentals, not headlines; use structured checks to assess whether the stock’s valuation remains attractive given its sector and risk profile. The practical takeaway is to adopt a disciplined approach: treat a bonus issue like a technical signal in the price ladder, not a guarantee of higher earnings, and look for credible catalysts before committing capital.
Open your trading and demat account here
Popular Articles


.avif)
.avif)

.avif)


START YOUR INVESTMENT JOURNEY
Get personalized advice from our experts
- Dedicated RM Support
- Smooth and Fast Trading App
