
India’s passenger vehicle market ended the year on a strong note, with Maruti Suzuki once again reinforcing its leadership. According to industry data, the Maruti Suzuki Baleno topped the sales chart in December, while the Dzire claimed the crown as the best-selling car of 2025.
These numbers are more than just monthly rankings. They reflect changing consumer preferences, the strength of Maruti Suzuki’s product portfolio, and the broader recovery trend in the Indian automobile sector. For investors and market watchers, the sales performance also offers important insights into demand patterns and sectoral momentum.
The Baleno has consistently been one of India’s most popular premium hatchbacks. Its December sales leadership can be attributed to a mix of urban demand, festive season carryover, and its value proposition in terms of features and fuel efficiency.
In real-world terms, buyers today are looking for cars that balance affordability with technology. Touchscreen infotainment, safety features, and mileage have become non-negotiable. Baleno’s positioning fits well with these expectations, helping it outperform peers in a competitive segment.
Another key factor is Maruti Suzuki’s unmatched dealer and service network. During peak demand periods, availability plays a crucial role. While some manufacturers face supply constraints, Maruti’s scale allows it to convert enquiries into deliveries faster, boosting monthly sales numbers.
The Dzire’s emergence as 2025’s best-selling car underlines the enduring appeal of compact sedans in India. Despite the rise of SUVs, Dzire continues to attract buyers seeking comfort, boot space, and reliability at a reasonable price point.
For fleet operators, first-time buyers, and families alike, Dzire remains a practical choice. Its consistent performance across economic cycles shows how strong brand recall and trust influence purchasing decisions.
Unlike trend-driven launches, Dzire’s success is built on consistency. Incremental upgrades, strong resale value, and low maintenance costs have helped it maintain volumes year after year. This stability is something equity investors often look for when evaluating companies with long-term earnings visibility.
With Baleno and Dzire leading sales charts, Maruti Suzuki continues to command a significant share of the passenger vehicle market. This leadership translates into stable cash flows, pricing power, and resilience during demand fluctuations.
From an investor’s perspective, such dominance reduces earnings volatility and strengthens the company’s long-term fundamentals.
India’s automobile industry operates under evolving regulatory norms, including emission standards and safety requirements. Maruti Suzuki’s ability to adapt its portfolio while maintaining volumes indicates strong compliance capabilities and operational efficiency.
This alignment with regulatory expectations is critical in a market governed by standards set by bodies such as the Ministry of Road Transport and Highways and evolving environmental norms.
Strong sales data from a market leader often lifts sentiment across the sector. Auto ancillaries, component manufacturers, and dealerships tend to benefit from sustained volume growth. Investors usually interpret such data as a sign of healthy consumer demand.
In previous cycles, consistent sales leadership by Maruti Suzuki has coincided with improved earnings visibility for the broader auto ecosystem.
Car sales are closely linked to consumer confidence and disposable income levels. Baleno and Dzire’s performance suggests that demand in the mass and mid-premium segments remains intact, even amid macro uncertainties.
For Indian markets, this supports the narrative of steady domestic consumption, which is a key pillar of economic growth.
While monthly sales rankings grab headlines, long-term investors should focus on trends such as product mix, margin stability, and market share. Maruti Suzuki’s diversified portfolio across hatchbacks, sedans, and SUVs provides balance against shifting consumer preferences.
Interpreting auto sales data requires context. Factors like seasonality, inventory levels, and promotional campaigns all play a role. This is where structured research and investor education become valuable.
SEBI-registered platforms such as Swastika Investmart support investors with research tools, market insights, and tech-enabled investing solutions. Combined with responsive customer support, this helps investors make informed decisions rather than reacting to short-term news.
Why did Maruti Suzuki Baleno lead December sales?
Baleno benefited from strong urban demand, feature-rich positioning, and Maruti Suzuki’s wide dealer network ensuring timely deliveries.
How did Dzire become the best-selling car of 2025?
Dzire’s consistent demand from families and fleet buyers, along with strong brand trust and value-for-money pricing, helped it top annual sales.
Does strong car sales impact Maruti Suzuki’s stock?
Sales leadership generally supports earnings stability, but stock performance also depends on margins, costs, and overall market conditions.
What does this mean for the Indian auto sector?
Strong sales indicate healthy consumer demand, benefiting auto manufacturers and ancillary companies.
Should investors track monthly auto sales data?
Yes, but it should be combined with long-term fundamentals and sector trends for better decision-making.
The fact that Baleno led December sales and Dzire emerged as 2025’s best-selling car highlights Maruti Suzuki’s deep understanding of the Indian consumer. It also reinforces the strength of the domestic automobile market at a time when consumption trends are closely watched by investors.
For those looking to interpret such market signals effectively, access to credible research and regulatory-compliant guidance is essential. Swastika Investmart, with its SEBI registration, strong research framework, investor education initiatives, and tech-enabled investing platform, aims to empower investors to navigate market trends with confidence.
If you want to stay aligned with evolving market opportunities and invest with clarity, now is a good time to take the next step.


India’s largest airline, IndiGo, went through a challenging phase over the past few months. Frequent flight delays, cancellations, and aircraft groundings created frustration among passengers and raised concerns among investors. Social media complaints, airport congestion, and global engine supply issues added to the pressure.
For a business that thrives on punctuality and scale, these disruptions naturally sparked the question: is this just a temporary rough patch or a sign of deeper operational stress?
The aviation sector is inherently complex. Aircraft availability, crew scheduling, weather disruptions, and global supply chain issues can quickly snowball into large-scale operational problems. IndiGo was not alone in facing these challenges, but given its market leadership, the impact was more visible.
Over recent weeks, IndiGo flights have shown clear signs of stabilisation. The airline has gradually improved on-time performance, reduced cancellations, and normalised schedules across major domestic routes. Passenger feedback has also turned relatively positive compared to the peak disruption period.
IndiGo’s management has taken corrective steps, including better aircraft rotation planning and closer coordination with airport operators. These efforts are crucial in a country like India, where air traffic continues to rise sharply post-pandemic.
With India now among the fastest-growing aviation markets globally, operational stability is not just a short-term fix but a necessity for sustaining leadership.
Despite short-term turbulence, the long-term demand story for Indian aviation remains intact. Rising disposable incomes, expanding middle-class travel, corporate mobility, and regional connectivity under the UDAN scheme continue to support air travel growth.
IndiGo, with its extensive domestic network and cost-efficient model, is well positioned to benefit from this trend. High passenger load factors indicate that demand has not weakened even during operational hiccups.
From a market perspective, strong demand helps airlines absorb temporary shocks faster, provided cost controls remain disciplined.
While flight operations are improving, cost pressures remain a reality. Aviation turbine fuel prices, currency fluctuations, and maintenance costs continue to influence profitability. IndiGo’s scale provides some buffer, but margin volatility is part of the airline business.
Investors should also factor in aircraft grounding risks linked to global engine issues, which have affected multiple airlines worldwide. Regulatory oversight by the Directorate General of Civil Aviation plays a key role in ensuring safety compliance and operational discipline.
The broader Indian equity market generally reacts positively to signs of operational recovery in large consumer-facing companies. However, sustained financial performance matters more than short-term sentiment.
IndiGo continues to hold a dominant market share in India’s domestic aviation space. While competition has intensified, its low-cost structure, fleet size, and network depth provide a clear advantage.
Competitors are also expanding aggressively, but IndiGo’s ability to deploy capacity quickly and manage costs efficiently remains a key differentiator. That said, aviation is a cyclical business, and leadership positions must be defended continuously through execution.
A neutral view suggests that while competition is rising, IndiGo’s scale still offers resilience in volatile phases.
For investors tracking aviation stocks, the recent recovery in IndiGo flights offers cautious optimism. Operational normalisation reduces near-term uncertainty and improves revenue visibility.
However, aviation stocks demand patience and risk awareness. Fuel costs, global supply constraints, and regulatory compliance can impact earnings unpredictably. Long-term investors may view stability as a positive signal, while short-term traders should remain mindful of sector volatility.
Indian markets tend to reward companies that demonstrate quick corrective action, especially in consumer-driven industries like aviation.
Understanding aviation stocks requires more than tracking headlines. Investors need clarity on financial sustainability, operational execution, and regulatory developments.
Swastika Investmart, a SEBI registered entity, supports investors with in-depth research, real-time market tools, strong customer support, and continuous investor education. Whether you are tracking aviation stocks or building a diversified portfolio, access to structured insights can make decision-making more confident.
IndiGo flights resuming strong operations suggest that the worst phase of recent disruptions may be behind the airline. Improved punctuality, stable schedules, and robust demand offer reassurance. However, aviation remains sensitive to external risks, and sustained execution will determine long-term performance.
For investors, the situation calls for balanced optimism rather than blind confidence. Tracking fundamentals, costs, and regulatory developments remains essential.
If you are planning to invest or track aviation stocks more closely, consider opening an account with Swastika Investmart for research-backed insights and a tech-enabled investing experience.
Why were IndiGo flights disrupted recently?
Operational challenges such as aircraft availability, engine issues, and airport congestion contributed to delays and cancellations.
Are IndiGo flights operating normally now?
Flight operations have largely stabilised, with improved on-time performance and reduced cancellations.
Does strong demand support IndiGo’s recovery?
Yes, India’s growing air travel demand provides a strong tailwind for recovery.
Is IndiGo a long-term investment opportunity?
Long-term potential exists, but investors should consider sector volatility and cost risks.
How can investors track aviation stocks better?
Using research platforms and expert guidance, such as those provided by Swastika Investmart, helps investors make informed decisions.
KSH International is engaged in the manufacturing and export of magnet winding wires, a critical component used in motors, transformers, generators and other electrical equipment. These products play a vital role in sectors such as power transmission, renewable energy, electric vehicles, railways, industrial machinery and automotive applications.
The company offers a wide range of products including enamelled copper and aluminium winding wires, paper insulated rectangular wires, continuously transposed conductors and specialised insulated conductors. These products are supplied to large original equipment manufacturers across India and overseas markets.
What makes KSH International relevant in today’s market environment is its direct linkage to India’s long-term infrastructure story. With rising investments in power generation, EV manufacturing and renewable energy, demand for efficient and reliable magnet winding wires is expected to remain strong.
KSH International operates three manufacturing facilities in Maharashtra located at Taloja and Chakan, with a total installed capacity of 29,045 metric tonnes per annum. A fourth manufacturing facility at Supa in Ahilyanagar is under development and expected to commence operations in FY26, further strengthening capacity.
As per industry data, the company ranks as India’s third-largest manufacturer and the largest exporter of magnet winding wires in FY25. Its strong export presence provides diversification and reduces dependence on a single geography.
The company has also received quality and supplier excellence awards from reputed clients such as Toshiba T&D India, GE Power Grid and BHEL, reinforcing its credibility in a highly technical manufacturing segment.
KSH International has demonstrated consistent financial improvement over the last three years. Total income increased from ₹1,056.60 crore in FY23 to ₹1,938.19 crore in FY25, reflecting strong demand across end-use industries.
Profitability has improved steadily, with net profit rising from ₹26.61 crore in FY23 to ₹67.99 crore in FY25. EBITDA margins expanded from 4.72 percent to 6.32 percent during the same period, indicating better operating efficiency and cost control.
Return on equity for FY25 stands at a healthy 22.77 percent, which is higher than many listed peers in the magnet wire segment. This reflects effective capital utilisation and disciplined execution by the management.
The KSH International IPO is a book-built issue with a price band of ₹365 to ₹384 per share. The issue opens for subscription on December 16, 2025 and closes on December 18, 2025. The shares are proposed to be listed on both BSE and NSE.
The total issue size is ₹2,601.82 crore, consisting of a fresh issue of ₹710 crore and an offer for sale of ₹1,891.82 crore. The face value of each share is ₹5 and the market lot is 39 shares.
Post issue, the company’s market capitalisation is estimated at approximately ₹2,602 crore at the upper price band.
The company plans to utilise fresh issue proceeds primarily for repayment of certain borrowings, purchase and installation of new machinery at two manufacturing plants, and setting up a rooftop solar power plant at its Supa facility.
These initiatives are expected to support capacity expansion, improve energy efficiency and reduce power costs over the long term. Investment in renewable energy also aligns with sustainability goals and may provide cost advantages as electricity prices remain volatile.
At the upper price band, KSH International is valued at a pre-IPO P/E of around 32 times FY25 earnings. Compared with listed peers such as Precision Wires India and Ram Ratna Wires, the valuation appears reasonable but not deeply discounted.
While KSH International offers superior ROE and strong growth visibility, its debt levels are relatively higher than some peers. This may limit near-term re-rating potential, especially for investors focused on short-term listing gains.
From a long-term perspective, the valuation reflects the company’s growth prospects, export leadership and exposure to high-growth sectors like EVs and renewables.
The company derives a significant portion of its revenue from a limited number of large customers, which could impact earnings if client concentration increases. Raw material price volatility, particularly in copper and aluminium, can also affect margins.
Manufacturing operations involve operational risks such as equipment failure and force majeure events. Additionally, differences in accounting standards across jurisdictions may impact financial interpretation for some investors.
For listing gains seekers, the IPO may offer limited upside due to fair valuation and higher leverage compared to peers. However, for long-term investors, KSH International presents a strong structural growth story driven by electrification, EV adoption and infrastructure spending in India.
Investors with a long-term horizon and moderate risk appetite may consider the IPO as part of a diversified portfolio, keeping expectations realistic in the short term.
Choosing the right IPO is not just about numbers but about understanding risk, valuation and timing. Swastika Investmart, a SEBI registered entity, provides in-depth research, advanced trading tools, strong customer support and investor education to help retail investors make informed decisions.
If you are planning to apply for IPOs or build a long-term equity portfolio, opening an account with Swastika Investmart gives you access to professional insights and a tech-enabled investing experience.
What does KSH International do?
KSH International manufactures magnet winding wires used in motors, transformers, EVs and power equipment.
Is KSH International profitable?
Yes, the company reported a net profit of ₹67.99 crore in FY25 with an ROE of 22.77 percent.
What is the IPO price band?
The IPO price band is ₹365 to ₹384 per share.
Is the IPO good for listing gains?
Listing gains may be moderate as the valuation is fair but not cheap.
Is it suitable for long-term investors?
Yes, long-term investors may find value due to strong industry tailwinds and expansion plans.
The recent sell-off in India’s midcap and smallcap space sent shockwaves through the market. After months of outperformance, these segments corrected sharply as investors reacted to frothy valuations, regulatory caution from SEBI, and global uncertainty.
But the big question now is: Has the panic finally ended? There are early signs that the market may be stabilising — and possibly forming a short-term bottom.
Let’s break down what’s happening, what signals matter, and how investors should position themselves.
The correction didn’t happen in isolation. Multiple triggers set the tone:
Midcaps and smallcaps had rallied far beyond their historical averages. Many stocks were trading at 30–50% premiums despite modest earnings visibility.
This stretched the risk-reward equation, making the segment vulnerable to a correction.
SEBI issued cautionary comments regarding overheating in smaller companies, urging mutual funds to reassess risk frameworks.
While not a direct intervention, it created a sentiment shock, leading to profit-booking and fund rebalancing.
Concerns over US bond yields, geopolitical tensions, and FII outflows added fuel to the fire. With risk-off sentiment globally, smallcaps took the hardest hit.
Many schemes faced pressure to rebalance portfolios due to size restrictions and liquidity management rules, further accelerating the decline.
Now, the dust is beginning to settle — and several indicators suggest a bottom may be forming.
The pace of declines has slowed significantly. Earlier, deep cuts of 4–6% were common in a day; now, volatility has tapered.
This cooling-off reflects reduced panic and more measured trading activity.
The India VIX remains within a controlled range, signalling improving risk appetite. Historically, midcap recoveries begin when volatility stabilises first.
Despite sharp corrections, SIP contributions hit all-time highs, showing unwavering domestic investor faith.
Consistent inflows act as shock absorbers, reducing the likelihood of prolonged downturns.
Domestic institutional investors have started nibbling into quality smallcap and midcap names—especially in sectors like capital goods, defense, manufacturing, and financial services.
When institutions buy during corrections, it often marks the beginning of base formation.
Indian corporates have delivered stable earnings. Several smaller companies reported healthy margins, strong order books, or improved cash flows — not characteristics of a market in deep distress.
SEBI’s recent stance has shifted from caution to structured monitoring. Clear guidelines always reduce fear-driven volatility.
Once the overhang of regulatory uncertainty eases, quality stocks typically rebound sooner.
Past midcap–smallcap corrections (2013, 2018, 2020) show a similar pattern:
Markets seem to be entering the accumulation zone now.
A bottoming market can be a golden opportunity — but only with the right strategy.
Companies with:
… are likely to lead the recovery.
A rising tide won’t lift all boats. Many questionable smallcaps jumped in the rally but lack fundamentals.
Stay selective and avoid speculative bets.
Instead of trying to catch the exact bottom, stagger your entry over 4–6 months.
This cushions volatility and improves long-term returns.
Segments showing resilience include:
These sectors continue to receive policy support and strong domestic demand.
If your equity allocation has fallen due to the correction, rebalancing can boost long-term compounding.
Platforms with robust screening tools, research reports, and advisory support can help you avoid mistakes.
This is where a trusted financial partner becomes invaluable.
Swastika Investmart, a SEBI-registered financial services provider, offers:
In volatile markets, having a research-driven approach matters more than ever.
👉 Open an account today:
https://trade.swastika.co.in/?UTMsrc=HasTheMidcapSmallcapPanicFinallyEnded
1. Are midcap and smallcap stocks safe to invest in now?
They are safer than during the peak, but selectivity is essential. Focus on companies with strong fundamentals.
2. Has the market definitely bottomed?
Not guaranteed — but key indicators show stabilisation and early signs of accumulation.
3. Should I stop SIPs during a correction?
No. Corrections increase long-term returns by lowering average cost.
4. Which sectors look promising after this correction?
Manufacturing, capital goods, financial services, and defense are showing resilience.
5. How long do recoveries usually take?
Historically, midcap–smallcap recoveries take 3–6 months to gain momentum after major corrections.
The midcap–smallcap panic appears to be cooling, with several signals pointing towards a potential bottom. While uncertainty remains, disciplined investing, quality stock selection, and data-backed decisions can turn this volatility into opportunity.
If you’re looking to navigate this phase with expert guidance, Swastika Investmart’s research-driven tools and advisory support can help you make informed decisions.

Every December, a familiar question resurfaces among Indian market participants:
“Will we see a Santa Rally this year?”
The Santa Rally—a phase between December 20 and January 5—is historically known for delivering strong positive returns in global equity markets. While the concept originated from US markets, the pattern has quietly taken shape in India as well.
And the numbers speak for themselves.
Over the last 20 years, Nifty has shown an 80% win rate during this period. That means in 16 out of 20 years, markets ended flat or positive.
Before we explore whether this year can repeat history, let’s look at the Table.
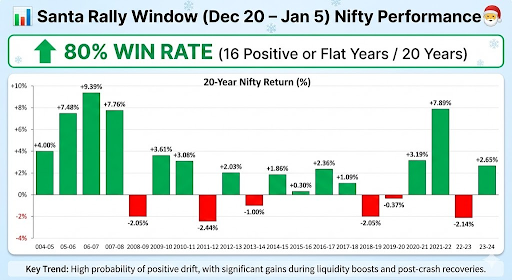
The Table highlights how often Nifty has delivered gains during this specific trading window. Notably big gains were observed in years following liquidity expansion phases or post-correction rebounds.
Some standout years include:
Even in difficult cycles such as 2011–12 or 2015–16, the dips remained relatively contained.
The data hints at something deeper:
Investor behaviour, liquidity conditions, and institutional rebalancing consistently influence year-end trends.
International markets often rally on:
Nifty mirrors this behaviour, especially when FIIs turn buyers.
India’s rising SIP culture—now over ₹20,000 crore per month—creates a dependable liquidity cushion. Even when FIIs stay cautious, domestic institutions and retail flows provide strong support.
By December:
This reduces uncertainty, which markets love.
With major policy decisions and earnings behind us, markets enter a quieter news cycle—ideal for rallies.
Whether the Santa Rally returns this year depends on several moving parts.
FIIs have been extremely sensitive to:
If global yields cool and India remains the preferred EM destination, FIIs could drive a meaningful rally.
Meanwhile, DIIs continue to provide steady inflows regardless of global conditions.
A neutral-to-dovish stance from the RBI generally:
If inflation stays within comfort levels, the backdrop improves for a year-end run-up.
For India, crude oil is the single biggest macro swing factor.
A stable or falling crude environment increases the probability of a Santa Rally.
If the US markets — especially S&P 500 and Nasdaq — carry momentum into the year-end, Nifty tends to follow suit.
Historically, India rarely rallies alone.
Nifty’s technical structure going into December matters:
A neutral–positive structure improves the setup.
While Santa Rallies are common, relying on them as guaranteed is risky.
Large caps tend to perform better due to stable liquidity.
If volatility emerges, staggered buying helps reduce timing risk.
Fed commentary, dollar index movement, and geopolitical risks can break the trend quickly.
Platforms like Swastika Investmart, with SEBI-registered research and actionable insights, help investors stay aligned with data—not emotions.
1. Does the Santa Rally always work in India?
No. While Nifty has delivered positive or flat returns in 80% of the last 20 years, external shocks or high valuations can offset historical patterns.
2. Why does Nifty usually rise between Dec 20 and Jan 5?
A mix of lower volatility, festive sentiment, portfolio rebalancing, and strong domestic flows often lifts markets.
3. Which sectors benefit the most during Santa Rallies?
Historically, banking, autos, consumer, and large-cap IT have shown stronger year-end momentum.
4. Is it safe to invest only for the Santa Rally?
Short-term bets are riskier. Long-term investors should view the rally as an opportunity, not a strategy.
5. What can break the Santa Rally this year?
Unexpected Fed remarks, Middle-East tensions, crude spikes, or heavy FII selling may cap returns.
The Santa Rally pattern in Nifty remains one of the most intriguing behavioural trends in the Indian market. Past data provides confidence—but not certainty. Whether this year repeats the 80% positive trend will depend on macro stability, global liquidity, and the market’s risk appetite.
For investors, the smartest approach is to stay data-driven and avoid knee-jerk decisions. Platforms like Swastika Investmart offer research-backed insights, strong customer support, and tech-enabled investing tools to help you navigate market opportunities confidently.
.png)
Silver has always been the quieter cousin of gold—less flashy, more volatile, and often overlooked until a big move happens. But the conversation is heating up again. Several analysts and commodity strategists believe that 2025 could be the start of a major silver supercycle, one strong enough to push prices to ₹2,00,000 per kg in India.
Is this realistic or just another hype cycle?
Let’s break it down using real-world data, global trends, and India-specific context.
A supercycle typically refers to a long, sustained rise in commodity prices caused by structural demand and limited supply. Historically, metals like copper, iron ore, and oil have experienced supercycles during periods of global expansion.
Silver is now entering a similar setup because of three major forces:
Silver is a critical input in:
The Solar Energy Industries Association estimates a gigantic jump in photovoltaic demand, potentially making silver one of the fastest-growing industrial metals in 2025.
If the US Federal Reserve and other central banks move toward easing monetary policy, precious metals like silver typically rise due to:
We saw this pattern during 2008–2011, when silver surged over 400%.
Mine production has lagged behind demand for years. Several major silver miners have reported:
This mismatch between supply and demand is a classic trigger for a supercycle.
Let’s look at the numbers.
Silver currently trades at approximately:
For silver to reach ₹2,00,000 per kg, we would need:
While this is not the base-case expectation for most analysts, it is possible under a high-stress macro environment, such as:
Think of it this way:
Silver has rallied 10x in past cycles, most notably between 2003–2011. When silver runs, it really runs.
But it also corrects sharply.
This is why investors need a balanced view, not blind optimism.
India is one of the world’s largest consumers of silver—both industrially and as jewellery. The effects of a supercycle would be mixed:
India imports most of its silver. A spike to ₹2 lakh/kg would put upward pressure on:
This could indirectly influence stock markets via FII sentiment.
Domestic companies in:
may face cost pressure but benefit from rising demand.
Indians traditionally buy silver during festivals and weddings. A price boom could push demand toward:
This aligns with India’s wider shift to formal financial instruments.
Jewellery players may see mixed results:
Before assuming a supercycle, track these triggers:
A weakening rupee can amplify silver prices far more than global moves.
Any change in customs duty on silver impacts price directly.
Rising volumes can indicate rising speculative interest.
Institutional money is the real driver of supercycles.
China consumes nearly 50% of global silver. Its industrial recovery will be crucial.
1. What is a silver supercycle?
It refers to a long-term surge in silver prices driven by strong structural demand and tight supply conditions across the global market.
2. Can silver really hit ₹2,00,000 per kg?
It’s an optimistic target. Achievable only if global liquidity, industrial demand, and supply disruptions align. Investors should consider it a possibility, not a certainty.
3. Is silver a better investment than gold in 2025?
Silver is more volatile but can deliver higher percentage returns during bull cycles. Gold, on the other hand, is more stable and defensive.
4. How should Indian investors buy silver?
Silver ETFs, MCX futures, and digital silver offer regulated and transparent access. Physical silver carries storage and purity risks.
5. Is now the right time to enter silver?
It depends on your risk profile. A staggered approach or SIP-style buying may help manage volatility.
The idea of a Silver Supercycle 2025 is exciting—and in many ways, credible. Industrial demand from solar and EVs is rising sharply, supply constraints are real, and global monetary cycles may turn favourable. But the jump to ₹2 lakh per kg requires an extraordinary combination of global events.
For Indian investors, the key is to stay informed, avoid speculative bets, and balance silver exposure within a diversified portfolio.
If you want expert guidance, market insights, and research-backed strategies, Swastika Investmart’s SEBI-registered advisory team and tech-enabled platforms can help you navigate commodity trends with confidence.
The US Federal Reserve’s decision to cut interest rates to 3.50%–3.75% marks one of the most important policy shifts of the year. Whenever the Fed moves, global markets listen. And for India — now one of the world’s most influential emerging market economies — such a decision has both direct and indirect consequences.
Investors often wonder:
Will this boost Nifty?
Will FIIs return?
Will the market rally or consolidate?
This blog simplifies the answer with data-driven insights, Indian context, and real-world examples — written in a clear, natural, and professional style.
The Fed’s move comes on the back of a slowing US economy, easing inflation, and a need to support consumption and business borrowing. This pivot toward rate cuts signals:
Any of these factors can quickly alter the risk appetite of global investors — especially FIIs who influence Indian equity markets significantly.
Let’s break it down into simple, relatable impacts:
Generally, when US interest rates drop:
For India, this is usually positive. Historically, we’ve seen this during:
If the current cut leads to a weaker dollar index, India could see:
However, India is no longer dependent only on FIIs — strong domestic inflows provide a cushion even during global uncertainty.
Nifty’s immediate reaction may be choppy because markets had partially priced-in the rate cut.
But over the next quarter:
…could create a healthy setup for Nifty to trend positively, barring external shocks.
A key indicator to watch:
Crude oil. If oil stays below $85, India benefits.
A Fed cut often reduces pressure on emerging market currencies. For the rupee:
IT companies may see mild margin pressure if the rupee strengthens, but the overall direction remains sector-specific.
Lower borrowing costs and better liquidity often support credit growth. Nifty Bank tends to benefit when yields soften globally.
A weaker US dollar can reduce rupee revenues, but improved US business activity typically boosts demand for Indian IT services.
This sector thrives in lower-rate environments. Home loans could become more competitive if Indian rates also follow a softening path.
Lower global rates help reduce financing costs and also soften commodity prices — a positive for auto manufacturers.
If global growth expectations rise due to Fed easing, metals could see revival.
Markets may react sharply in the first few sessions, but stability often follows.
Companies with resilient earnings, low leverage, and steady cash flows are better positioned to benefit from liquidity-driven rallies.
A mix of large caps, sectors with strong earnings visibility, and long-term SIP flows can help ride global cycles smoothly.
1. Will the Fed rate cut directly impact Indian interest rates?
Not immediately. The RBI considers domestic inflation and growth, though global cues like Fed policy indirectly influence its stance.
2. Will Nifty rise after the Fed rate cut?
Short-term volatility is possible, but medium-term sentiment tends to be positive due to better liquidity and improved risk appetite.
3. Are FIIs likely to return to Indian markets?
Yes, if global yields remain soft and the dollar cools, India becomes attractive due to strong economic fundamentals.
4. Which sectors will benefit the most?
Banks, NBFCs, real estate, IT, and autos could see improved sentiment depending on secondary macro factors.
5. Should retail investors make changes to their portfolios?
Only after evaluating risk tolerance and goals. Long-term investors should stay disciplined.
The Fed’s move to cut rates to 3.50%–3.75% is a significant turning point for global liquidity and market momentum. For India, the impact is likely to be constructive over the medium term — supported by strong domestic growth, healthy corporate earnings, and robust retail participation.
Investors who balance patience with informed decision-making stand to benefit the most.
If you're looking to analyze markets with expert guidance, real-time insights, and SEBI-registered research support, Swastika Investmart offers a tech-enabled platform to help you invest smarter.


Trust Our Expert Picks
for Your Investments!


.webp)
.png)

.png)


%20(2).png)