
Infosys Share Price Momentum And The Q1 FY27 Earnings Wave


Key Takeaways
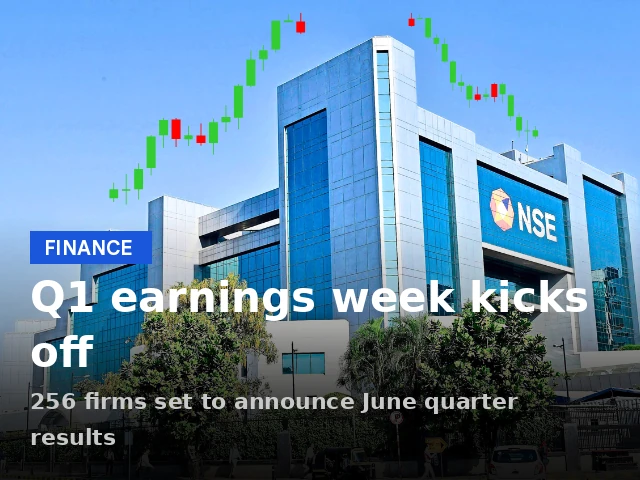
- Q1 FY27 earnings season gathers momentum with 256 companies set to announce June-quarter results.
- infosys quarterly results and major names drive early market sentiment as results flow in.
- Goldman Sachs expects the Nifty 50 to rebound to 26,500 by June 2027, signaling macro optimism for Indian equities.
- Swastika's Sarthi AI stock assistant offers deeper insights for retail investors.
The Q1 FY27 earnings season is gathering momentum as 256 companies are set to announce their April-June quarter results this week. For retail investors, that cadence matters: the direction of key names can tilt the broader market mood and inject volatility into swing trades. The infosys share price is particularly watched as a barometer of IT and market sentiment, given Infosys is one of the most prominent IT services names in the calendar. The first wave of results has already begun with Tata Consultancy Services reporting earlier this month, and now the rest of the calendar will reveal how demand and margins are tracking across sectors.
Infosys Share Price Outlook For Q1 FY27 And Market Momentum
Investors monitor the infosys share price as a bellwether for IT services and overall risk appetite. The IT-heavy portion of the market has been a leading indicator in recent sessions, and the current earnings cadence could either reinforce that leadership or expose pockets of weakness. TCS results provided early directional cues, and now traders will look for consistency in quarterly updates that feed into margins and guidance across peers. The market outlook remains cautiously constructive, with fresh updates from the earnings calendar shaping sector leadership and potential sector rotation.
The earnings calendar underscores a broad mix of names across sectors: Infosys, Eternal, Bajaj Auto, UltraTech Cement, Nestlé India, Adani Power, Paytm and TVS Motor are among the key names on the docket. As results flow in, price action in sub-sectors tied to IT, cement, consumer staples, energy, and financials will offer clues about the breadth of the recovery. The bajaj auto stock price and tvs motor stock price will be watched for autos-cycle signals and demand trends, while ultratech cement share price will reflect the health of the construction and infrastructure cycle. The nestlé india stock will provide a test of consumer staples resilience in a fluctuating macro backdrop. Investors should also keep an eye on infosys quarterly results as a potential trigger for IT peers and sentiment across risk assets.
According to Vinod Nair of Geojit Investments, market sentiment continues to be supported by encouraging Q1 FY27 business updates and growing optimism over a healthy earnings season.
Reference :
1 : Economictimes
The calendar also highlights a tight schedule of big names reporting through the week. On Monday, July 20, UltraTech Cement is set to report its Q1 FY27 results, with Paytm and Indian Overseas Bank also announcing their June-quarter earnings, along with Karur Vysya Bank, Shyam Metalics and Sobha. Tuesday, July 21, brings Bajaj Auto, Adani Energy Solutions, TVS Motor Company, Indian Hotels Company, JSW Infrastructure, Adani Gas, Mahindra & Mahindra Financial Services and Anthem Biosciences. On Wednesday, July 22, Eternal will report its June-quarter results, followed by Nestlé India, Adani Power, Adani Green Energy, BPCL, Oracle Financial Services Software, Dr. Reddy's Laboratories and United Spirits. Thursday, July 23, features Infosys, IndiGo, Cipla, Motilal Oswal Financial Services, Mphasis, Sona BLW Precision Forgings, Go Digit General Insurance and Chennai Petroleum Corporation. Finally, Friday, July 24, sees Shriram Finance, CG Power, Bank of Baroda, Jindal Steel & Power, Laurus Labs, Apar Industries, Welspun Corp and Container Corporation of India (CONCOR) announce results. These timings provide a framework for how the infosys share price and other major names may respond in the near term.
To put the calendar into perspective, market watchers also note the evolving macro narrative. Goldman Sachs expects the Nifty 50 to rebound to 26,500 by June 2027, a signal of growing constructive thinking around India’s macro backdrop as earnings settle in and macro indicators improve. Looking ahead, investors will closely track Japan's inflation data and India’s PMI readings for fresh glimpses into economic activity and business confidence–factors that can influence sector leadership and valuations across the market. Vinod Nair’s commentary underscores that broader optimism remains tethered to solid earnings progress and improving macro momentum.
Where does that leave the retail investor? The immediate takeaway is to align risk with the earnings calendar and keep a close watch on IT, cement, and consumer staples themes as results flow in. As price action unfolds around the infosys share price and related names, it’s important to separate macro-driven moves from stock-specific catalysts. For those seeking deeper, institution-grade research on any stock or index, Swastika's Sarthi AI stock assistant can help you interpret earnings signals and price action in real time. Swastika's Sarthi AI stock assistant can be a useful companion as you navigate this earnings-heavy week.
Market Outlook And The Nifty Target: A Global And Local Lens
The market’s direction in this earnings-heavy cycle will reflect both domestic earnings momentum and global macro cues. The first-quarter updates have implications for multiple sectors, including IT services, capital goods, and consumer staples. The consensus around a constructive path for Indian equities is supported by improving macroeconomic signals and a growing sense that earnings quality will be resilient enough to sustain multiple expansion, even as some firms show mixed margins. The Nifty’s path in the months ahead will likely hinge on the balance between corporate guidance, macro data, and external risk sentiment from global markets. Investors should be prepared for volatility around policy commentary, PMI prints, and quarterly results that reshape sector leadership narratives.
For those who want to calibrate price-action with more granular context, the Sarthi AI stock assistant can help parse earnings surprises, price-action patterns, and cross-asset signals to inform entry and exit decisions. The assistant provides institutional-grade research on any stock or index to retail investors, and you can explore it here: Swastika's Sarthi AI stock assistant.
Related Reads
- Infosys Share Price: A Retail Investor's Comprehensive Guide To Market Movements, Dividends, And Strategy
- Infosys Share Price Watch: Q1FY27 Earnings Week Across 260+ Indian Companies
- Infosys Share Price Trends And July 2026 Nifty F&O: A Retail Investor's Guide
Frequently Asked Questions
What is the Q1 FY27 earnings calendar?
256 companies are scheduled to announce their April-June quarter results, covering a wide mix of sectors and including names like Infosys, Eternal, Bajaj Auto, UltraTech Cement, Nestlé India, Adani Power, Paytm and TVS Motor.
Which major names are on the earnings calendar this week?
Key names include Infosys, Eternal, Bajaj Auto, UltraTech Cement, Nestlé India, Adani Power, Paytm and TVS Motor.
What is the market outlook for Q1 FY27?
Market sentiment is supported by encouraging Q1 FY27 business updates and growing optimism over a healthy earnings season, with macro cues remaining favorable.
What does Goldman Sachs say about the Nifty 50?
Goldman Sachs expects the Nifty 50 to rebound to 26,500 by June 2027, signaling constructive sentiment as macro conditions improve.
How can retail investors use Swastika's Sarthi AI stock assistant?
Swastika's Sarthi AI stock assistant provides institutional-grade research on stocks and indices to retail investors, helping interpret earnings signals and price moves. Visit the tool here:Swastika's Sarthi AI stock assistant.
Conclusion
In practice, this means structuring trades around verified price reactions to earnings data, rather than chasing headlines. If you want a more disciplined, data-driven approach, consider using price channels, earnings momentum scores, and cross-sector validation. The week ahead is a test of earnings resilience, macro-inflation dynamics, and investor appetite for growth versus value. With the right framework, you can translate the earnings cadence into a navigable path for your portfolio.
Latest Articles

Hdfc Bank Share Price Outlook After The June 2026 Quarter


Key Takeaways
- Total operating income rose 3.67% year over year to Rs 90,575.33 crore in the June 2026 quarter.
- Net profit rose 18.37% year over year to Rs 19,244.71 crore.
- Operating margin expanded to 35.64% in June 2026 from 26.18% in June 2025.
- PBDT stood at Rs 27,193.16 crore and PBT at Rs 20,849.83 crore, with about 30% year over year growth.
Could a single quarter move the dial on hdfc bank share price? In the June 2026 quarter, HDFC Bank reported a robust set of numbers that underscore its scale, efficiency, and resilience–metrics that matter for retail investors tracking price momentum and fundamental value. These results, reported directly by the bank, show a rising total operating income and a profitable engine that consistently expands margins. For investors watching the hdfc bank share price, the June 2026 quarter adds color to the valuation puzzle and clarifies the bank's trajectory in a competitive market.
According to the bank's quarterly results, Total Operating Income rose 3.67% year-on-year to Rs 90,575.33 crore, up from Rs 87,371.87 crore in the June 2025 quarter. Net profit rose 18.37% to Rs 19,244.71 crore in the quarter ended June 2026, as against Rs 16,257.91 crore in the prior-year quarter. This rise in profitability came alongside a notable improvement in margins, painting a constructive picture for the stock's upside potential. The bank's profitability metrics improved, reflecting an expansion of margins and efficient cost control.
Operating profit margin (OPM) expanded to 35.64% in June 2026, from 26.18% in June 2025, underscoring better operating leverage and cost discipline. PBDT stood at Rs 27,193.16 crore, while PBT was Rs 20,849.83 crore, with both showing a year-on-year growth of about 30%. The net profit growth of 18.37% sits on top of that margin expansion, reinforcing the case that the bank can translate top-line gains into meaningful earnings gains for shareholders. These numbers collectively point to a healthy profit engine and a better quality of earnings that could sustain a supportive trajectory for hdfc bank share price.
The revenue growth, while modest in percentage terms, reflects a resilient operating base in a rising-rate environment and a competitive loan growth scenario. The 3.67% growth in total operating income indicates that the bank is able to preserve and grow revenue streams even as lending margins face pressure in a dynamic rate cycle. The ability to grow operating income while sustaining margins is critical for long-term profitability and may contribute to a favorable re-rating of the hdfc bank share price for patient investors. The bank's ability to convert revenue into earnings is a key factor for investors to monitor.
To gain deeper insights tailored to your portfolio, consider Swastika's Sarthi AI stock assistant, which can tailor investment ideas for HDFC Bank and peers to your investment timeline.
Hdfc Bank Revenue Growth And Total Operating Income In June 2026 Quarter
The June 2026 quarter confirms that HDFC Bank's top-line growth remains resilient. The Total Operating Income of Rs 90,575.33 crore marks a 3.67% year-on-year gain over Rs 87,371.87 crore in the June 2025 quarter. While this is not a dramatic percentage move, it underlines a steady revenue generation capacity for a large private-sector bank with a diversified loan book and fee-generating businesses. The ability to grow operating income while sustaining margins is critical for long-term profitability and may contribute to a favorable re-rating of the hdfc bank share price for patient investors.
The quality of revenue matters as much as the level of revenue itself. A mix of net interest income and non-interest income sources–supported by a disciplined cost structure–helps the bank translate revenue into sustainable earnings. This mix matters for the hdfc bank share price because investors evaluate not only the size of the top line but the durability of earnings power. The bank's results suggest it can maintain a steady growth path without sacrificing profitability, a signal that bodes well for a measured re-rating of the stock over time.
The strong performance is not just a result of a single year's tailwinds; it reflects a multi-quarter path of improved efficiency, higher fee income, and prudent risk management. These elements help position HDFC Bank as a stock that could deliver steady equity returns for investors who prefer quality franchises with resilient earnings. For a more personalized read on how to position your portfolio, you can use Swastika's Sarthi AI stock assistant.
Net Profit Momentum And Its Implications For The Bank's Valuation
Net profit for the June 2026 quarter rose 18.37% year-on-year to Rs 19,244.71 crore from Rs 16,257.91 crore in the prior-year quarter. This improvement in profitability comes despite a competitive environment in Indian banking and rising expectations for efficiency. A higher net profit typically signals better cash generation and greater capacity for shareholder returns, which can influence the hdfc bank share price through both earnings-based valuation and sentiment-based shifts. The combination of revenue growth and improved margins underlines a more resilient earnings profile for the bank, a positive signal for long-hold investors and for those considering incremental exposure to the bank's equity.
From an investor's perspective, the level of net profit growth, alongside margin expansion, is a critical input into models that estimate intrinsic value, return on equity, and the sustainability of earnings. While 18.37% is an impressive improvement, the sustainability of this pace will depend on credit costs, reserve releases or additions, and macro variables that influence demand for loans. In this context, investors should monitor how the bank's profitability translates into free cash flow and how that might affect dividends and buybacks over time.
Operating Margin Expansion And What It Signals For Return On Equity
The June 2026 quarter shows an operating profit margin (OPM) of 35.64%, up from 26.18% in June 2025. This expansion reflects improved operating leverage, better cost management, and a mix of earnings catalysts that support profitability. A higher OPM means the bank can convert more of its revenue into operating profits, which is beneficial for returns on equity (ROE) and could translate into a higher multiple if investors view the story as sustainable. For the hdfc bank share price, margin expansion is a positive structural signal, though it must be weighed alongside the bank's credit quality and growth trajectory.
Margin improvements are often supported by a favorable product mix, disciplined expense management, and a favorable interest-rate environment that aids net interest income. If the bank can sustain an elevated OPM in the coming quarters while maintaining credit discipline, the combination could support an upward re-rating of the stock, particularly if value investors favor banks with strong operating leverage. As always, a steady rhythm of earnings beats and forward guidance can help anchor the price and reduce volatility around the hdfc bank share price in the near term.
PBDT, PBT And Other Profitability Levers In The June 2026 Quarter
Beyond net profit and operating margins, the June 2026 quarter highlighted profitability levers in the form of PBDT and PBT. PBDT stood at Rs 27,193.16 crore, with year-on-year growth around 30%, signaling strong earnings before depreciation and tax as a result of better top-line performance and cost management. PBT was Rs 20,849.83 crore, also showing about a 30% year-on-year increase. These numbers illustrate that the bank's core profitability, before the drag of non-cash items, is robust and capable of driving earnings power in an uncertain macro environment. For investors, this is a sign that the earnings base may support a healthier payout policy and potential capital returns, influencing the hdfc bank share price in a constructive way.
It is important to note that while these profitability metrics look favorable, the actual path of the hdfc bank share price will be influenced by broader macro factors, including rate trends, asset quality, and the bank's forward guidance. In a balanced view, the June 2026 quarter provides a credible platform for the stock, but potential investors should consider both the growth drivers and the risks that could affect future profitability and valuation.
What This Means For The Hdfc Bank Share Price And Investment Strategy
For the retail investor, the June 2026 quarter supports a constructive but cautious stance on the hdfc bank share price. The bank's ability to grow total operating income by 3.67% while driving net profit higher by 18.37% and expanding margins is a combination that typically supports a favorable earnings trajectory. In addition, the PBDT and PBT numbers–each showing around 30% YoY growth–indicate a strong underlying profitability engine that can weather some market volatility. These factors collectively point toward a stable-to-positive outlook for the stock from a fundamental standpoint, particularly for investors with a multi-quarter horizon.
Related Reads
- HDFC Bank Share Price And Q1 Earnings Preview: NII, NIM, GNPA And Provisions Across Major Banks
- Hdfc Bank Share Price: Q1 FY27 Highlights, NII Growth, And Outlook
- HDFC Bank Share Price: Q1 Earnings Preview And Sector Trends
Frequently Asked Questions
What was HDFC Bank's consolidated net profit in the June 2026 quarter?
HDFC Bank's consolidated net profit rose to Rs 19,244.71 crore in the quarter ended June 2026, up 18.37% from Rs 16,257.91 crore in the June 2025 quarter.
What was HDFC Bank's total operating income for the June 2026 quarter?
Total operating income for the June 2026 quarter stood at Rs 90,575.33 crore, up 3.67% from Rs 87,371.87 crore in the June 2025 quarter.
What was HDFC Bank's operating margin in June 2026?
Operating profit margin (OPM) for June 2026 was 35.64%, up from 26.18% in June 2025.
What were the PBDT and PBT figures in the June 2026 quarter?
Profit before depreciation and tax (PBDT) was Rs 27,193.16 crore, and profit before tax (PBT) was Rs 20,849.83 crore in the June 2026 quarter, with about 30% year-on-year growth for both.
How should retail investors interpret HDFC Bank's June 2026 results for the hdfc bank share price?
The results show a resilient revenue base, higher profit margins, and a solid profitability engine, which could support a constructive view on the hdfc bank share price. Price action will still depend on macro factors and broader market sentiment.
Conclusion
For the retail investor, HDFC Bank's June 2026 quarter confirms a robust earnings engine backed by revenue resilience and margin expansion. The bank delivered a 3.67% rise in total operating income to Rs 90,575.33 crore and an 18.37% jump in net profit to Rs 19,244.71 crore, supported by an OPM of 35.64% (vs 26.18% a year earlier). PBDT and PBT also strengthened, signaling a durable profitability framework. In light of these numbers, the hdfc bank share price could be positioned for upside, but any decision should account for macro shifts and risk factors inherent in the banking sector.
Open your trading and demat account here
Reference :
Idbi Bank Share Price: June 2026 Quarter Results And Outlook
Key Takeaways
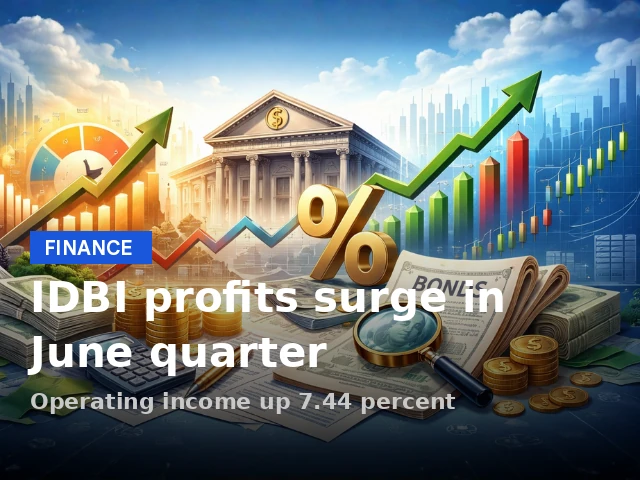
- IDBI Bank posted a 7.44% rise in total operating income to Rs 7,549.28 crore in the June 2026 quarter.
- Net profit grew 5.35% to Rs 2,127.14 crore, with operating profit margin at 76.80% year over year.
- PBDT and PBT stood at Rs 2,829.31 crore, up about 11% from the prior year quarter.
- For retail investors, idbi bank share price may react to this momentum; monitor ongoing updates and consider Swastika's Sarthi AI stock assistant for deeper insights.
Investors watching Indian banks will want to know how the idbi bank share price could react to the latest numbers from IDBI Bank. In the June 2026 quarter, IDBI Bank posted a total operating income of Rs 7,549.28 crore, up 7.44% from Rs 7,026.62 crore in the prior year's quarter. Net profit rose 5.35% to Rs 2,127.14 crore, as the bank reported improved margins and revenue growth. The operating profit margin climbed to about 76.80%, up from 70.25% a year ago, signaling efficiency gains across lending and treasury portfolios. These metrics reflect a strengthening earnings trajectory that could influence the idbi bank share price in the near term.
Idbi Bank Share Price After June 2026 Quarter: What The Numbers Signal For Investors
The June 2026 quarter confirms a resilient operating backdrop for IDBI Bank. Total Operating Income rose to Rs 7,549.28 crore, translating to a 7.44% year-over-year increase from Rs 7,026.62 crore in the June 2025 quarter. The improvement in revenue is paired with a solid net profit figure of Rs 2,127.14 crore, up 5.35% from Rs 2,019.18 crore in the same quarter last year. Margins expanded meaningfully, with the operating profit margin advancing to 76.80% from 70.25% a year earlier, underscoring greater efficiency in core operations. For investors, these dynamics suggest a healthier profitability runway that could influence the idbi bank stock price in the near term as markets reassess earnings quality.
To put it in perspective, the earnings momentum is not just about top-line growth. The bank also reported Rs 2,829.31 crore for both PBDT and PBT, a continuation of strong bottom-line performance that supports higher profitability on a sustained basis. Net profit, at Rs 2,127.14 crore, reflects a robust Q2 narrative that aligns with improving operating efficiency. This mix of revenue resilience and profit discipline is a positive signal for stakeholders monitoring the long-term trajectory of IDBI Bank.
June 2026 Quarter Highlights: Total Operating Income And Net Profit In Focus
While the headline numbers are compelling, they are most meaningful when viewed against the backdrop of cost management and asset quality. The 7.44% rise in total operating income demonstrates IDBI Bank's ability to grow core revenue streams despite a competitive banking environment. The net profit growth of 5.35% is supported by a favorable margin framework, with the OPM landing at 76.80% in this quarter versus 70.25% in the prior year's period. This margin expansion suggests better operating leverage as the bank scales its lending book and optimizes funding costs.
For retail investors evaluating the idbi bank stock price, the combination of higher operating income and improved margins provides a more sustainable earnings base. The 11% growth in PBDT and PBT signals that both the pre- and post-tax profitability lines benefited from the mix of revenue growth and efficiency gains. It is important to note that while these numbers are encouraging, the stock price is also influenced by external factors such as macroeconomics, liquidity conditions, and sector-wide sentiment. Nevertheless, the current quarter strengthens the bull case for earnings resilience and strategic execution by IDBI Bank.
Margin Expansion And Revenue Mix: How The OPM Moved In Q2
Operating Profit Margin (OPM) is a critical gauge of profitability that captures how effectively a bank converts revenue into profits after operating expenses. In Q2 2026, IDBI Bank achieved an OPM of 76.80%, up from 70.25% in the June 2025 quarter. This uptick points to improved efficiency, tighter cost control, and potentially a better product mix across lending, fee income, and treasury operations. Margin expansion like this can support a higher earnings base, which in turn can influence investor expectations for the idbi bank stock price as market dynamics adjust to the improved efficiency narrative.
Beyond margins, the revenue mix remains a strategic lever. A higher share of fee income, interest income from credit products, and treasury gains can cushion earnings against cyclicality in one particular line. IDBI Bank’s total operating income growth of 7.44% demonstrates that the bank is able to navigate competitive pressures while pursuing product-market expansion. For an investor analyzing growth drivers, it is worth watching strategic initiatives in retail and corporate segments, plus any risk-minded lending practices that could sustain this momentum in coming quarters. If you want a structured, institutional-level scan of such drivers, consider Swastika's Swastika's Sarthi AI stock assistant for deeper, stock-specific research.
Idbi Bank Stock Price Movement Following The June 2026 Results
Market participants will parse these fundamentals alongside other signals to form a view on the idbi bank stock price. The quarter’s strength in operating income and margins suggests potential upside, particularly if macro conditions remain supportive and the bank sustains its growth trajectory. Traders may look for confirmation signals such as sustained cost discipline, continued margin stability, and favorable asset quality trends before adjusting downside or upside expectations for the stock price. Retail investors should align any trading view with their risk tolerance and investment horizon, rather than chasing short-term moves alone.
Idbi Bank Quarterly Results: A Cleaner Look At Growth Drivers
The June 2026 quarter’s numbers shed light on what’s driving the improvement. A major driver appears to be revenue resilience across core banking operations, supported by margin-enhancing factors and disciplined cost management. The bank’s ability to convert revenue gains into margin expansion is crucial because it widens the earnings margin cushion in the face of potential rate shifts or competitive pressures. For retail investors, this combination–revenue growth plus margin expansion–can translate into more predictable earnings streams and a healthier balance sheet, both of which can influence the idbi bank stock price as market participants reassess value and growth potential.
Frequently Asked Questions
What were IDBI Bank's key numbers in the June 2026 quarter?
Total Operating Income: Rs 7,549.28 crore; Net Profit: Rs 2,127.14 crore; Operating Profit Margin (OPM): 76.80%; PBDT and PBT: Rs 2,829.31 crore each.
How did the June 2026 quarter compare with the June 2025 quarter?
Total Operating Income rose 7.44% to Rs 7,549.28 crore from Rs 7,026.62 crore; Net Profit increased 5.35% to Rs 2,127.14 crore from Rs 2,019.18 crore; OPM rose from 70.25% to 76.80% YoY; PBDT and PBT rose about 11% to Rs 2,829.31 crore.
What does the margin expansion imply for IDBI Bank's profitability?
Margin expansion to 76.80% indicates improved operating efficiency and better conversion of revenue into profits, supporting a stronger earnings base even in a competitive banking environment.
What should retail investors watch next for the idbi bank share price?
Investors should monitor follow-up quarterly results, macroeconomic factors, and market sentiment, as these will influence the idbi bank share price. Consider structured research tools like Swastika's Sarthi AI stock assistant for deeper stock-specific insights.
Where can I find more research on IDBI Bank?
Swastika offers research reports and access to Sarthi, an AI stock assistant that provides institutional-level research on stocks and indices for retail investors.
Conclusion
In practical terms, IDBI Bank’s June 2026 quarterly results portray a bank with stronger efficiency and a resilient revenue base, as reflected in a higher operating income and a robust margin. For the idbi bank share price, this is a positive signal that could translate into selective upside if market conditions cooperate and the bank maintains its growth trajectory. The takeaway for retail investors is to use this momentum as a stepping stone–focusing on consistent earnings quality, cost discipline, and risk controls as the core pillars for future decisions.
Next steps: monitor follow-up quarterly data, build a simple framework to assess price reactions to earnings quality, and consider using tailored research support like Swastika's Sarthi AI stock assistant to translate these numbers into actionable ideas aligned with your risk profile. The current momentum could offer opportunities for informed, methodical participation in the idbi bank stock price narrative rather than speculative trading.
Open your trading and demat account here
Reference :

RBI Polymer Notes: Investor Guide To The Polymer Shift In Indian Currency
Key Takeaways
- Retail investors should watch the rbi polymer notes plan as BRBNMPL opens a global EoI for polymer note substrates with embedded security features.
- The bid deadline is August 18, 2026, with eligibility criteria requiring prior central-bank collaborations and security clearances.
- Initial demand totals 68,000 reams, split roughly 34,000 reams per denomination, with field trials potentially paving the way for larger orders.
- Currency in circulation remains robust, with ₹41.23 lakh crore in value by end-March 2026 and ₹500 notes accounting for 86% of total value.
What Is RBI Polymer Notes And Why They Matter For Retail Investors
Retail investors are watching the rbi polymer notes plan as BRBNMPL opens a global expression of interest to supply polymer banknote substrate with embedded security features. This shift from nearly a century of paper notes signals not just a material change, but a rethinking of the cost, security, and logistics of India's currency regime. The question is whether polymer notes can extend note life, reduce replacement costs, and reshape the cash cycle. Note printing costs trended lower, falling nearly a quarter to ₹4,875 crore in 2025-26, hinting at potential long-run savings if polymer notes achieve durability gains. The polymer shift could also influence the currency-to-GDP ratio and cash usage dynamics even as digital payments grow. For investors tracking macro shifts, polymer notes are a real-world test of how policy, technology, and supplier networks intersect. Swastika's Sarthi AI stock assistant can help surface stocks tied to polymer substrates and security features as the ecosystem evolves.
The primary agency driving this initiative is BRBNMPL, the RBI’s currency printing arm. They are seeking global expressions of interest to supply polymer substrate sheets with embedded security features for printing polymer banknotes. The move would mark a notable departure from a long history of paper-based banknotes and could alter the economics of currency production, just as India continues to balance a cash-heavy segment with rising digital payments. Market participants should watch not only the tender itself but also how field trials might influence procurement scales and supplier selection in the months ahead.
Initial Polymer Note Tender Details: What Exactly Is On The Table
The tender envisions an initial procurement of 68,000 reams of polymer substrate, with an approximate 34,000 reams allocated to each denomination. This indicates an even split across two note types, though the EoI does not specify which denominations will be involved or the timeline for introducing polymer notes. The project is structured to allow larger procurements only after successful field trials, signaling a staged approach to scaling polymer note production. For investors, this means exposure to an evolving supply chain rather than an immediate, fully rolled-out transition.
| Parameter | Details |
|---|---|
| Initial Demand | 68,000 reams |
| Split By Denomination | Approximately 34,000 reams per denomination |
| Deadline | August 18, 2026 |
| Primary Agency | BRBNMPL (RBI Note Printing Arm) |
Who Can Bid: Eligibility And Capabilities For Polymer Substrate Suppliers
Eligibility criteria for the polymer substrate tender are explicit. Domestic and international manufacturers are invited, but they must have supplied polymer banknote substrate with security features to central banks or banknote printing organisations for at least the past three years. They must demonstrate the capacity to supply at least 20,400 reams, or 30% of the indicative requirement, and must secure government security clearance. In addition, bidders must ring-fence operations in China or Pakistan from the India contract and must avoid sourcing raw materials from China or Pakistan for India-specific banknote substrate. Importantly, bidders must not supply the India-specific substrate to any third country. These requirements are designed to ensure security, reliability, and geopolitical risk controls for a sensitive national asset.
Security Provisions And Supply Chain Guardrails For India-Polymer Substrates
The tender imposes strict guardrails: security clearance from the government, operational ring-fencing with respect to China and Pakistan, and restrictions on raw material sourcing for India-specific substrate from those two countries. While the EoI does not specify the denominations or a timetable for polymer note rollout, the security posture is clear. For investors, these constraints could affect supplier diversification and the pricing dynamics of polymer substrates, potentially influencing margins for manufacturers who can meet the security, supply, and geopolitical criteria. The emphasis on security clearance highlights the sovereign considerations embedded in any large-scale currency modernization effort.
Polymer Notes: The Economics Of Security, Longevity, And Printing Costs
Durable polymer notes are known to last longer than traditional cotton-paper notes, which means fewer replacements and potentially lower long-run printing costs. The trend in 2025-26 shows printing costs falling by about 25% to ₹4,875 crore, a data point that adds context to the cost calculus behind polymer adoption. If polymer notes deliver the anticipated durability and counterfeit resistance, the marginal cost of production per note could improve over time, even if upfront substrate costs are higher. Investors should track not only the tender’s progress but also how suppliers price durability, security features, and processing times into polymer substrates.
Currency In Circulation: The Current Cash Mix And What The Polymer Shift Could Change
As of end-March 2026, currency in circulation stood at ₹41.23 lakh crore, up from ₹36.86 lakh crore a year earlier, reflecting a 12% year-on-year growth. The ₹500 denomination accounted for 86% of the total currency value, amounting to ₹35.27 lakh crore, with more than 7 billion notes in circulation. In terms of volume, ₹500 notes represented about 41% of the total notes in circulation. The currency-to-GDP ratio was 12.1% at end-March 2026, a modest uptick from 11.7% in the previous year. This data underscores that cash usage remains robust even as digital payments rise, a crucial context for evaluating polymer notes as a strategic upgrade rather than a radical replacement. The demonetisation peak of 14.4% occurred in March 2021, illustrating the cyclical nature of cash usage and the ongoing role of physical notes in the economy.
Field Trials, Timelines, And The Roadmap For Polymer Adoption
The EoI does not specify exact denominations for printing or a formal timeline for introducing polymer notes. Instead, it sets the stage for a field-trial phase, after which larger procurements could be pursued if results are favorable. For investors, this implies a phased implementation with potential data-driven adjustments to supplier selection, note denominations, and field-trial metrics. The lack of a fixed schedule also introduces an element of flexibility in the rollout, which could influence how quickly polymer-substrate manufacturers ramp up capacity and how quickly banks align supply chains with polymer-era requirements.
Real-World Investor Takeaways: How To Interpret This Move In Your Portfolio
From an investment perspective, the RBI polymer notes plan is less about a single product and more about a shift in an entire ecosystem: a polymer-compatible substrate market, embedded security features, central-bank procurement discipline, and a field-trial-based scaling path. The security-centric approach suggests that the strongest beneficiaries will be polymer-substrate suppliers with proven experience in central-bank settings, as well as security-feature providers that can integrate robust anti-counterfeiting measures. Domestic players in India and select global players with long-standing central-bank collaborations stand to gain from early-stage contracts and potential follow-on procurement rounds. As always, geopolitical risk considerations loom large when the tender involves ring-fencing from China or Pakistan in any India-specific substrate supply chain. Whether you are evaluating banks as beneficiaries of a more secure currency supply chain or polymer-materials firms that could benefit from new demand, this plan signals a structural shift worth tracking over multiple quarters.
In practical terms, retail investors should connect the macro narrative to specific investment ideas. Areas worth monitoring include polymer-substrate manufacturers with central-bank credentials, security-feature technology providers, and banks that could benefit from a more resilient currency ecosystem. If you want deeper stock-level ideas tied to macro shifts like polymer notes, Swastika's Sarthi AI stock assistant can help surface and compare potential opportunities across this evolving landscape. This is especially relevant for investors who want to overlay currency modernization with existing holdings in payment infrastructure, fintech, and materials sectors.
Related Reads
Frequently Asked Questions
What Is The RBI Polymer Notes Plan And The EoI Deadline?
BRBNMPL is issuing a global expression of interest to supply polymer banknote substrate sheets with embedded security features for printing polymer banknotes. The bid deadline is August 18, 2026.
Who Can Bid For The Polymer Substrate Tender?
Domestic and international manufacturers with a three-year track record supplying polymer banknote substrate with security features to central banks or banknote printing organisations; must demonstrate capacity to supply at least 20,400 reams (or 30% of the indicative requirement); security clearance from government; must ring-fence operations in China or Pakistan from India contract; must not source raw materials from those countries for India-specific substrate; must not supply India-specific substrate to any third country.
What Is The Initial Demand For The Polymer Substrate?
Initial requirement is 68,000 reams, roughly split about 34,000 reams per denomination.
What Are The Key Data Points On Currency In Circulation?
End-March 2026 currency in circulation value was ₹41.23 lakh crore, up from ₹36.86 lakh crore at end-March 2025 (12% YoY). ₹500 notes accounted for 86% of total currency value (₹35.27 lakh crore) with more than 7 billion notes in circulation (41% by volume). Currency-to-GDP ratio was 12.1% at end-March 2026, up from 11.7% a year earlier.
What About The Printing Cost Trend?
Note printing costs fell nearly a quarter to ₹4,875 crore in 2025-26 from a year earlier.
What Is The Significance Of The Polymer Shift For Investors?
A successful pivot to polymer notes implies longer-lasting notes, potential changes in the cost structure of currency printing, and a different supplier landscape, affecting players in polymer substrates and security features.
Conclusion
The polymer shift represents a material evolution in how India handles cash, not merely a cosmetic upgrade. Even as digital payments expand, the persistence of cash in circulation–and the outsized role of the ₹500 note–makes a polymer transition strategically meaningful for the currency ecosystem. For retail investors, the key takeaway is to watch how BRBNMPL’s tender and subsequent field trials unfold, and to assess which suppliers emerge as credible long-run beneficiaries of central-bank collaboration and secure, scalable production capacity. A prudent mental model is to treat this as a multi-year structural upgrade rather than a one-off project, with opportunities emerging in polymer substrates, security features, and the broader note-production value chain.
Next steps: map the supplier landscape, monitor the field-trial outcomes, and consider exposure to polymer-substrate and security-technology players as part of a broader view on infrastructure and currency resilience. As you evaluate these dynamics, use Swastika's Sarthi AI stock assistant to refine stock-level ideas and risk profiles around polymer-era winners and competitors. The polymer notes journey is still in its early stages, but the potential implications for cost, durability, and security could shape profitability and strategic positioning for related players over the coming years.
Open your trading and demat account here
Reference :
1 : Economictimes

Alphabet Share Price: Decoding The Alphabet Price Chart For Indian Investors
Key Takeaways
- alphabet share price movements reveal tech momentum and risk appetite.
- A quick look at the alphabet price chart shows trend shifts and potential entry points.
- alphabet stock news can drive near-term swings, even as the long-term narrative remains intact.
- As a retail investor in India, align trades with your risk tolerance and time horizon.
In a year when tech megacaps swing global markets, the alphabet share price moves have become a focal point for Indian retail investors tracking high-growth names. The alphabet share price action isn't just a number on a screen–it's a barometer of how investors price AI leadership, ad revenue resilience, and macro headwinds. By learning to read the alphabet price chart and tying it to concrete catalysts, you can separate noise from signal and protect your capital. This guide unpacks the key drivers, interprets price movements, and provides practical steps to use Alphabet's stock price as a tool in a diversified Indian portfolio. Swastika's Sarthi AI stock assistant can help tailor insights to your holdings.
Alphabet Share Price And Market Cycles: What Retail Investors Should Know
Alphabet share price doesn’t move in a vacuum. It tracks a confluence of tech sector momentum, earnings quality from Google’s core businesses, the pace of AI investments, and broader macroeconomic signals such as interest rates and consumer spending. For Indian retail investors, the key is to map price action to a framework rather than chasing headlines. In practice, you’ll notice that extended upward moves often coincide with improving ad revenue growth and AI deployment visibility, while pullbacks can reflect rising rates or soft demand in ad spends. By connecting price moves to these fundamentals, you build a narrative that helps you avoid knee-jerk reactions and focus on longer-term alignment with your financial goals.
Alphabet Price Chart: Reading Trends Across Timeframes
The alphabet price chart is your first screen for trend direction. Use multiple timeframes–daily, weekly, and monthly–to distinguish between short-term noise and persistent shifts in momentum. When the price trades above a rising 50-day moving average, you often see a constructive drift; when it breaks below, a period of consolidation or potential risk-off sentiment can follow. Candlestick patterns, volume confirmation, and price clusters near historical support can help you validate a setup. Remember, price charts summarize expectations about revenue growth, AI leadership, and competitive dynamics, not the exact execution of quarterly results.
Alphabet Stock News: How Catalysts Shape Short-Term Swings
Alphabet stock news can inject sharp volatility in the near term. Positive catalysts–like stronger AI product adoption, cloud growth, or improved monetization in YouTube–can push the alphabet stock price higher in a climate of optimism. Negative headlines–regulatory scrutiny, antitrust discussions, or softer ad demand–can produce rapid pullbacks or sideways movement. For your portfolio, treat alphabet stock news as a short-term noise filter: focus on whether the price trend and updated earnings trajectory still align with your longer-term investment thesis. In the Indian retail context, this means assessing how a global tech giant’s performance translates into risk-adjusted returns for your own holdings.
Practical Investment Strategies For Indian Retail Investors Navigating Alphabet Share Price
Build a simple framework to manage Alphabet share price exposure. Start with clear time horizons–short, medium, and long-term–and use position sizing to limit risk. If you’re new to equities, consider allocating a modest portion of your portfolio to a high-quality tech mega-cap and balance it with diversified holdings. Use stop-loss orders or mental stop levels to protect against defined downside, and use trailing stops to lock in gains when momentum strengthens. Regularly re-visit your thesis: what growth drivers support the Alphabet share price in the coming quarters, and how could regulatory or competitive pressures alter that thesis? Finally, use a credible research companion such as Swastika's Sarthi AI stock assistant to tailor insights to your holdings and investment plan.
Alphabet Share Price Risks And Considerations For Indian Investors
Even in a strong market, Alphabet share price can be sensitive to external shocks. The company’s performance hinges on ad revenue resilience, AI product monetization, and the competitive dynamics of tech platforms. Regulators’ actions around data privacy, antitrust policy, and cross-border commerce could influence investor sentiment and therefore price levels. A disciplined approach–anchored in diversification, risk management, and a clear investment thesis–helps investors avoid overreliance on short-term moves and supports steadier, more repeatable outcomes in a volatile market.
Related Reads
- Alphabet Share Price: A Practical Guide For Indian Retail Investors
- Alphabet Share Price And Dow Inclusion: What Retail Investors Should Know
Frequently Asked Questions
What is Alphabet share price?
Alphabet share price is the market price of Alphabet's publicly traded shares on major stock exchanges.
What factors influence Alphabet share price movement?
Alphabet share price is influenced by revenue growth, advertising performance, AI initiatives, product mix, regulatory developments, macroeconomic conditions, and broader tech sector momentum.
Does Alphabet pay a dividend?
Alphabet has not paid a regular cash dividend; returns to shareholders have historically come through price appreciation.
Where can I track Alphabet share price and charts?
You can track Alphabet share price and charts on major stock exchanges, financial portals, and trading platforms such as Swastika's Sarthi AI stock assistant.
How should Indian retail investors approach Alphabet share price?
Indian retail investors should assess Alphabet share price within a diversified portfolio, align trades with risk tolerance and investment horizon, and avoid trying to time short-term swings.
Conclusion
The Alphabet share price landscape for retail investors is shaped by a blend of fundamentals, catalysts, and macro conditions. The best approach is to anchor decisions in a well-defined thesis, monitor the alphabet price chart for trend confirmation, and maintain a diversified portfolio that aligns with your risk tolerance and horizon. By using a structured framework and tools like Swastika's Sarthi AI stock assistant, you can translate market noise into actionable steps and stay true to your long-term plan.
Next steps: define your risk budget, set up a repeatable review process, and rehearse your decision rules before you trade. A practical mental model to adopt is the 'trend and validate' approach: follow the price trend, validate with catalysts and earnings signals, and adjust only when your thesis changes. This disciplined method helps retail investors harness Alphabet share price dynamics rather than be overwhelmed by them.
Open your trading and demat account here
Reference :
1 : Google
Tata Technologies Share Price Outlook From Q1 FY27 Results: Growth, Margins, And AI-Driven Expansion
Key Takeaways
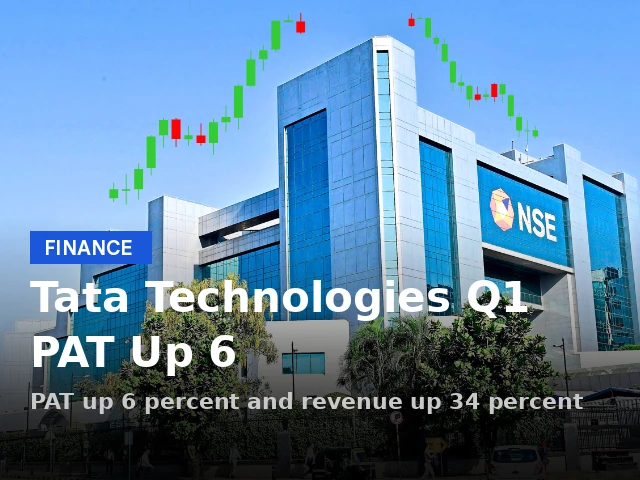
- Tata Technologies reported Q1 FY27 revenue of Rs 1,664.6 crore, up 33.77% YoY and 5.88% QoQ, with net profit of Rs 180.8 crore (YoY 6.17%; QoQ 11.26%).
- Services revenue Rs 1,296.9 crore with a 30.5% gross margin; Technology Solutions contributed Rs 367.7 crore revenue.
- Cash and cash equivalents stood at $118.7 million and free cash flow rose to Rs 247.9 crore, signaling strong liquidity.
- Management guides for double-digit organic revenue growth in FY27, backed by AI investments and a $100 million partnership with Tenneco.
For investors tracking tata technologies share price, Q1 FY27 results illuminate a path of robust expansion across services and technology solutions. Tata Technologies reported consolidated net profit of Rs 180.8 crore for the quarter ended 30 June 2026, up 6.17% YoY and 11.26% QoQ. Revenue from operations rose 33.77% YoY to Rs 1,664.6 crore in the June 2026 quarter, while gross profit climbed 44.16% YoY to Rs 460 crore, lifting gross margin to 27.6% from 25.6% in Q1 FY26 and 27.2% in Q4 FY26. Profit before tax stood at Rs 251.7 crore in Q1 FY27, up 10.78% vs Q4 and 8.23% vs Q1 FY26. Operating EBITDA increased 33.63% YoY and 6.07% QoQ to Rs 267.4 crore, while the operating EBITDA margin stood at 16.1%, flat YoY and up 10 basis points QoQ. EBIT rose 31.17% YoY and 8.26% QoQ to Rs 238.6 crore. The EBIT margin stood at 14.3% compared with 14.6% in Q1 FY26 and 14.0% in Q4 FY26.
The Services segment revenue Rs 1,296.9 crore, up 34.6% YoY and 6.3% QoQ. Services gross profit Rs 395.8 crore, up 48.5% YoY and 10.8% QoQ. Services gross margin: 30.5% (from 27.7% in Q1 FY26 and 29.3% in Q4 FY26).
Technology Solutions segment revenue Rs 367.7 crore, up 31.0% YoY and 4.3% QoQ. Technology Solutions gross profit Rs 64.2 crore, up 22.3% YoY and down 8.9% QoQ. Technology Solutions gross margin: 17.5% (vs 18.7% in Q1 FY26 and 20.0% in Q4 FY26).
Headcount stood at 12,579. Voluntary attrition improved to 16.0% from 16.2% in Q4 FY26. Days sales outstanding (DSO) increased to 97 days from 95 days in Q4 FY26. Cash and cash equivalents stood at $118.7 million. Free cash flow increased to Rs 247.9 crore from Rs 234.9 crore in the previous quarter.
During the quarter, Tata Technologies secured a $100 million strategic partnership with Tenneco spanning engineering, digital and business process transformation. The company also won multiple large engagements from leading automotive OEMs across Japan, Europe and North America, covering vehicle engineering, digital engineering, software-defined platforms, PLM, manufacturing, supply chain and electrification programs, strengthening its order pipeline and global delivery footprint.
"The strong execution seen in the second half of FY26 continued into Q1 FY27, with healthy demand across strategic growth areas, an improving deal pipeline and greater visibility across key customer programmes. The company expects to deliver strong double-digit organic revenue growth in FY27, supported by investments in AI, operational efficiency and portfolio diversification," stated Warren Harris, Chief Executive Officer and Managing Director. Uttam Gujrati, Chief Financial Officer, added that the demand environment remains constructive for engineering, digital transformation and next-generation mobility while the company maintains disciplined execution and prudent capital allocation.
Shares of tata technologies fell 1.03% to settle at Rs 757.70 on Friday, 17 July 2026.
For investors seeking deeper stock-level insights, consider Swastika's Sarthi AI stock assistant: Swastika's Sarthi AI stock assistant.
Tata Technologies Share Price Drivers After Q1 FY27 Results
The quarter confirms strong top-line growth driven by both Services and Technology Solutions. Services revenue rose to Rs 1,296.9 crore with a robust gross margin of 30.5%, while Technology Solutions contributed Rs 367.7 crore with a margin of 17.5%. The consolidated gross margin of 27.6% reflects a favorable mix and ongoing pricing power, even as Tech Solutions faced a QoQ margin contraction from prior levels. Revenue growth of 33.77% YoY and 5.88% QoQ indicates sustained demand for engineering, digital transformation and next-generation mobility capabilities across geographies.
Operational profitability improved as PBT rose to Rs 251.7 crore (+10.78% vs Q4 FY26; +8.23% vs Q1 FY26) and EBIT reached Rs 238.6 crore (+31.17% YoY; +8.26% QoQ), signaling efficient cost controls and portfolio leverage. EBITDA rose 33.63% YoY to Rs 267.4 crore with a margin of 16.1%, unchanged on a YoY basis and up slightly QoQ. These metrics support a narrative of strong execution and a favorable demand environment.
| Metric | Value | YoY | <QoQ |
|---|---|---|---|
| Consolidated Revenue | Rs 1,664.6 crore | 33.77% | 5.88% |
| Net Profit | Rs 180.8 crore | 6.17% | 11.26% |
| Gross Profit | Rs 460 crore | 44.16% | 7.57% |
| Gross Margin | 27.6% | To be announced | To be announced |
| EBITDA | Rs 267.4 crore | 33.63% | 6.07% |
| EBIT | Rs 238.6 crore | 31.17% | 8.26% |
| Services Revenue | Rs 1,296.9 crore | 34.6% | 6.3% |
| Tech Solutions Revenue | Rs 367.7 crore | 31.0% | 4.3% |
| Services Gross Margin | 30.5% | To be announced | To be announced |
| Tech Solutions Gross Margin | 17.5% | To be announced | To be announced |
| Headcount | 12,579 | To be announced | To be announced |
| DSO | 97 days | To be announced | To be announced |
| Cash & Equivalents | $118.7 million | To be announced | To be announced |
| Free Cash Flow | Rs 247.9 crore | To be announced | To be announced |
Key strategic catalysts include the $100 million partnership with Tenneco and continued engagements across automotive OEMs in Japan, Europe and North America, covering vehicle engineering, digital engineering, PLM, manufacturing and electrification. These initiatives bolster the order pipeline and global delivery footprint, which can support tata technologies share price stability as execution remains robust.
Tata Technologies Share Price And Segment Wise Performance: Services And Technology Solutions
The Services segment remains the growth engine, delivering Rs 1,296.9 crore in revenue and a healthy margin of 30.5%, up from prior-year levels. The Services gross profit of Rs 395.8 crore marks a 48.5% YoY increase and 10.8% QoQ, underscoring a favorable mix and pricing discipline in engineering services, digital transformation and PLM services. Technology Solutions contributed Rs 367.7 crore in revenue, marking a YoY rise of 31.0% and QoQ growth of 4.3%. However, Technology Solutions gross profit rose 22.3% YoY but declined 8.9% QoQ to Rs 64.2 crore, with margins at 17.5%. This divergence suggests deeper investment in next-gen capabilities and services that may weigh on margin in the near term while enabling stronger revenue growth over cycles.
The combined effect is a diversified revenue profile with a persistent services moat and rising contribution from technology-enabled offerings. The mix tilt toward Services supports higher gross margins relative to Technology Solutions, but the latter remains critical for long-term upside in AI-enabled engineering and digital platforms.
Liquidity, Cash Flows And The Outlook For Tata Technologies Share Price
Liquidity remains solid with cash and cash equivalents at $118.7 million. Free cash flow of Rs 247.9 crore, up from Rs 234.9 crore in the previous quarter, indicates healthy cash conversion and potential capital allocation headroom. The DSO of 97 days, up from 95 days in Q4 FY26, points to a slightly extended receivables cycle, which management may address through improved billing and collections discipline. Headcount of 12,579 suggests continued investment in capabilities to support growth and AI-led initiatives, aligned with the management's stated emphasis on operational efficiency and portfolio diversification.
The quarter also showcased strategic expansion through new partnerships and wins, notably the $100 million Tenneco engagement. These wins across key geographies, including Japan, Europe and North America, span vehicle engineering, digital engineering, software-defined platforms, PLM, manufacturing, supply chain and electrification programs, expanding the global delivery footprint and strengthening the order pipeline. All of this lays a foundation for the company to sustain growth as it scales its AI and digital transformation capabilities. The balance of cash generation against working capital needs and high-value contracts could play a meaningful role in shaping the tata technologies share price trajectory in FY27.
According to Warren Harris of Tata Technologies, the strong execution seen in the second half of FY26 continued into Q1 FY27, with healthy demand across strategic growth areas, an improving deal pipeline and greater visibility across key customer programmes. He added that the company expects to deliver strong double-digit organic revenue growth in FY27, supported by investments in AI, operational efficiency and portfolio diversification.
Reference :
The CFO, Uttam Gujrati, affirmed that constructive demand supports ongoing investments while disciplined capital allocation remains a priority. The market has responded with cautious attention to the quarter’s numbers and the growth runway ahead, with the stock price reacting to the overall positive trend in margins and the acceleration in services-led revenue growth.
Strategic initiatives beyond the quarter, including AI-driven engineering, digital transformation, and next-generation mobility programs, are expected to fuel a continued recovery in the tata technologies share price over the coming quarters. Investors should watch order intake, project win rates, and the pace of AI-enabled offering rollouts as key indicators of sustainable growth. For retail investors, the combination of margin stability in Services, growth in Technology Solutions, robust cash generation, and a strategic growth agenda supports a constructive longer-term view of the stock.
Growth Catalysts And FY27 Outlook For Tata Technologies Share Price
Looking ahead, management is guiding for double-digit organic revenue growth in FY27, a signal of ongoing expansion across core businesses and new opportunities in AI-enabled engineering and digital platforms. The partnership with Tenneco is a clear demonstration of the ability to win large, strategic engagements with major OEMs, potentially expanding the company's global footprint and revenue visibility. The company’s investments in AI and operational efficiency are intended to unlock higher productivity, create more value for clients, and ultimately support favorable margins as the revenue base broadens across Services and Technology Solutions.
As retail investors assess the tata technologies share price, the key question is whether the growth trajectory remains supported by a cadence of high-value contracts and steady cash generation. The quarter’s numbers suggest resilience across the services portfolio, with margin expansion in Services and a strong services-led revenue base. While Technology Solutions delivered solid growth, margins there may take time to normalize if AI-enabled platforms displace some traditional offerings. The next few quarters will reveal how effectively the company translates large contract wins and AI investments into sustained profitability and cash generation. The stock’s path will hinge on the ability to convert deal pipelines into recurring revenue and maintain discipline in capital allocation while seeding new growth engines.
Frequently Asked Questions
What were Tata Technologies' consolidated revenue and net profit in Q1 FY27?
Consolidated revenue was Rs 1,664.6 crore and net profit was Rs 180.8 crore; revenue grew 33.77% year-on-year and 5.88% quarter-on-quarter, while net profit rose 6.17% YoY and 11.26% QoQ.
How did the Services and Technology Solutions segments perform in Q1 FY27?
Services revenue was Rs 1,296.9 crore with a gross margin of 30.5%; Technology Solutions revenue was Rs 367.7 crore with a gross margin of 17.5%.
What were the key cash flow and liquidity metrics for Tata Technologies in Q1 FY27?
Cash and cash equivalents stood at $118.7 million; free cash flow was Rs 247.9 crore. DSO rose to 97 days, from 95 days in the prior quarter.
What strategic partnerships or new contracts did Tata Technologies announce in Q1 FY27?
The company secured a $100 million strategic partnership with Tenneco spanning engineering, digital and business process transformation, along with multiple large engagements from leading automotive OEMs across Japan, Europe and North America.
What is the FY27 growth outlook for Tata Technologies?
Management expects double-digit organic revenue growth in FY27, supported by AI investments, operational efficiency and portfolio diversification.
Did Tata Technologies' share price move around July 17, 2026, and if so how?
Yes. Shares of Tata Technologies fell 1.03% to settle at Rs 757.70 on Friday, 17 July 2026.
Conclusion
For retail investors, Tata Technologies’ Q1 FY27 results paint a picture of a company with a diversified, services-led growth engine and a meaningful strategy to invest in AI and digital transformation. The combination of revenue growth, improved services margins, strong cash generation, and strategic partnerships creates a supportive backdrop for the tata technologies share price in FY27. The key next steps for investors are to monitor order flow, ensure continued margin discipline, and gauge the impact of AI initiatives on pricing power and contract rationalization. In the near term, a measured approach to evaluating cash flow generation and the pipeline will be essential to interpreting the stock’s trajectory. If you want a deeper, AI-powered stock research assistant to tailor this analysis to your portfolio, explore Swastika's Sarthi AI stock assistant.
In sum, the quarter reinforces a constructive outlook for the business, underpinned by a strong services base, expanding technology offerings, and strategic partnerships that can uplift the order book and profitability over time. Retail investors should stay tuned to the continuation of growth momentum, the cadence of new contracts, and the company’s ability to convert growth into reliable cash flow, all of which will be the main drivers of the tata technologies share price in the quarters ahead.

Pnb Quarterly Results: Punjab National Bank's June 2026 Profit Surge Analyzed
Key Takeaways
- Punjab National Bank's June 2026 quarter shows net profit at Rs 5814.72 crore, up 174.29% YoY.
- Total Operating Income rose 3.12% to Rs 33589.17 crore from Rs 32572.33 crore.
- OPM improved to 75.40% from 71.76%, indicating stronger operating efficiency.
- Key takeaways for retail investors: sustained earnings growth and margin expansion signal a constructive start.
Pnb Quarterly Results: June 2026 Overview And What It Means For Retail Investors
In this pnb quarterly results update, punjab national bank posted a robust June 2026 quarter, with metrics that catch the eye of risk managers and retail investors alike. Net profit rose 174.29% year-on-year to Rs 5814.72 crore, from Rs 2119.88 crore in the quarter ended June 2025. Total Operating Income rose 3.12% to Rs 33589.17 crore, compared with Rs 32572.33 crore in the year-ago period. The bank’s operating efficiency also improved as the operating profit margin (OPM) expanded to 75.40% from 71.76%. All figures cited reflect the bank's consolidated numbers for the quarter ended June 2026, the first quarter reported in the new fiscal cycle.
From a retail investor perspective, the pace of earnings growth matters as much as the quality of the earnings. A net profit of Rs 5814.72 crore is a strong signal, supported by a rising topline and a more efficient cost structure. The year-on-year improvement in OPM suggests better control over operating expenses and revenue mix, helping the bank sustain profitability amid a competitive Indian banking landscape. The numbers above come from punjab national bank results for the June 2026 quarter, providing a clear snapshot of how the bank is executing its strategic priorities.
Key numbers at a glance (as reported by the bank) show a quarterly cadence that emphasizes margin discipline and revenue growth. Total Operating Income of Rs 33589.17 crore in June 2026 compares with Rs 32572.33 crore in June 2025, marking a 3.12% ascent. OPM’s rise to 75.40% from 71.76% signals a notable improvement in operating profitability. Net profit of Rs 5814.72 crore translates to a substantial year-on-year uplift from Rs 2119.88 crore. PBDT and PBT are both reported at Rs 7108.06 crore, underscoring the strength of pre-tax cash generation and pre-tax profits in the reported quarter.
Total Operating Income And Margin Expansion: Analyzing Punjab National Bank's June 2026 Quarter
Delving deeper into the mix, the figure of 33589.17 crore becomes a microcosm of how the bank is generating revenue. The 3.12% rise in total operating income is a signal of resilience, aided by growth in core lending and fee-based income across segments such as retail, SME, and corporate. The margin expansion to 75.40% from 71.76% demonstrates tighter cost control and favorable operating leverage. The combination of higher income and more efficient operations is what drives a healthier bottom line and improved return on assets for the quarter ended Jun 2026.
To put it into context for investors: a higher OPM in a phase of uncertain macro conditions implies that the bank is better able to convert revenue into profits. The data is consolidated, reflecting the performance across all segments. While the quarter ends on 30 June, the sequential improvement is consistent with improved profitability and profitability returns relative to the same quarter last year. All numbers are from punjab national bank results release for the quarter ended Jun 2026.
June 2026 PBDT And PBT Trends For Pnb: What Investors Should Know
PBDT and PBT both stand at Rs 7108.06 crore in the June 2026 quarter. This mirroring suggests that the pre-tax profitability is robust and the bank does not rely on unusual one-off items for this period. When guided by the primary source numbers, it indicates that the core profitability remains strong even after allowable expenses. The net profit result of Rs 5814.72 crore benefits from that margin stability, with the YoY growth of 174.29% deeper due to a weaker base in the previous year's quarter.
From an investment viewpoint, this is a sign that PNB's earnings power is not solely a function of one-off events but a sustained trend in the quarter. The PBDT and PBT numbers align with a strong operating performance that supports continued earnings potential in the ensuing quarters. For retail investors, the message is to monitor revenue growth and margin sustainability, rather than relying on a single snapshot. The numbers again come from punjab national bank results.
Impact On Punjab National Bank Stock Price And Pnb Share Price
As numbers improve, the market will reflect this in the pnb bank stock price and pnb share price, though the actual movement depends on multiple factors, including macroeconomic cues, credit quality, and management commentary. The June 2026 quarter's stronger earnings mix and margin expansion could provide support for a positive re-rating if guidance is favorable. Investors tracking punjab national bank stock price should consider the reported PBDT, PBT, and NP figures alongside asset quality trends and the bank's plan for future growth. The numbers let you compare performance across quarters and assess if the current stock prices already price in these improvements.
For references, current market price data for the pnb bank stock price and punjab national bank stock price should be checked on a live feed. Always cross-check with the latest market quotes before making trading decisions. If you want a quick, scenario-based analysis of potential price moves, explore Swastika's Sarthi AI stock assistant.
Use the Sarthi stock assistant to tailor scenarios around these results: Swastika's Sarthi AI stock assistant.
Risks And Outlook: What Retail Investors Should Watch After The June 2026 Quarter
While the quarter delivers good news, investors must consider risks and the outlook. The margin expansion and top-line growth provide a favorable base, but the year ahead holds macro uncertainties that could influence credit growth, liquidity, and demand for loans. Watch for NIM dynamics, asset quality metrics, and any revisions to guidance by Punjab National Bank management. The bank’s ability to sustain high OPM will depend on cost control and revenue mix, including potential changes in interest rates and competitive pressures. The data in this article is drawn from punjab national bank results for the June 2026 quarter, and no external commentary is included beyond this source's numbers.
Frequently Asked Questions
What were the key numbers in pnb quarterly results for June 2026?
Net profit rose to Rs 5814.72 crore, up 174.29% from Rs 2119.88 crore in the June 2025 quarter. Total Operating Income rose 3.12% to Rs 33589.17 crore, from Rs 32572.33 crore. OPM was 75.40% (vs 71.76%), PBDT and PBT were both Rs 7108.06 crore, and NP stood at Rs 5814.72 crore.
How did punjab national bank earnings perform in the June 2026 quarter?
Punjab National Bank earnings reached Rs 5814.72 crore, up 174.29% YoY, driven by a 3.12% rise in Total Operating Income to Rs 33589.17 crore and an OPM of 75.40%.
What does the June 2026 pnb quarterly results imply for punjab national bank stock price and pnb share price?
The stronger earnings and efficiency metrics can support a positive re-rating for punjab national bank stock price and pnb share price, though actual movements depend on guidance, credit quality and macro factors in the coming quarters.
Which metrics stood out in the June 2026 quarter and why?
Net profit surged 174.29% YoY to Rs 5814.72 crore, while Total Operating Income rose 3.12% to Rs 33589.17 crore. OPM expanded to 75.40% from 71.76%, and PBDT and PBT were Rs 7108.06 crore, highlighting improved operating efficiency and profitability.
What should a retail investor watch in the next quarter after these pnb quarterly results?
Watch for credit growth, interest income, cost controls, NIM trends, and any guidance revisions from Punjab National Bank management. The Sarthi AI stock assistant can help tailor scenarios.
Conclusion
In the June 2026 quarter, Punjab National Bank delivered a compelling pnb quarterly results narrative: a strong net profit surge, continued top-line growth, and a notable margin expansion that reflects better operating discipline. For retail investors, the result suggests that the bank is translating higher revenue into sustainable profitability, a positive sign for punjab national bank earnings and pnb earnings in the near term. The takeaway is to watch the trajectory of margins and revenue growth as you evaluate the stock's risk-reward in the next quarter and beyond.
Next steps: treat this as a starting point for a disciplined investment thesis. Compare these results with guidance and peer performance, test scenarios with Sarthi AI stock assistant, and keep attention on credit quality and capital adequacy going forward. The underlying message is clear: strong earnings power, if sustained, can support a favorable and durable investment thesis for the pnb share price and punjab national bank stock price in the longer run.
Open your trading and demat account here
Reference :
Big Budget


Popular Articles


.avif)
.avif)

.avif)


START YOUR INVESTMENT JOURNEY
Get personalized advice from our experts
- Dedicated RM Support
- Smooth and Fast Trading App
