Information


Short-Term vs Long-Term Capital Gains Tax on Shares
.webp)

Short Term vs Long Term Capital Gains Tax on Shares
Investing in the stock market can help build long term wealth, but every investor must understand the tax implications of their investments. One of the most important aspects of stock market taxation in India is the difference between short term and long term capital gains tax on shares.
Whether you are an active trader or a long term investor, knowing how gains are taxed can help you plan your investments better and avoid surprises during tax filing.
The taxation rules for capital gains on shares are governed under the Income Tax Act 1961, which clearly defines how profits from equity investments are classified and taxed.
Quick Takeaways
• Short term capital gains apply when shares are sold within one year of purchase.
• Long term capital gains apply when shares are held for more than one year.
• Short term gains on listed shares are taxed at a fixed rate.
• Long term gains above a certain limit are taxed at a concessional rate.
• Smart tax planning can improve overall investment returns.
Understanding Capital Gains in the Stock Market
Capital gains refer to the profit earned when an investor sells shares at a price higher than the purchase price.
For example, suppose you buy shares of a company for ₹1 lakh and sell them later for ₹1.3 lakh. The ₹30,000 profit is considered a capital gain and is subject to taxation.
The tax treatment depends on how long you hold the shares before selling them.
What Is Short Term Capital Gains Tax on Shares
Short term capital gains arise when listed equity shares are sold within 12 months of purchase.
Under current tax rules, short term gains on listed shares are taxed under Section 111A.
Tax Rate on Short Term Capital Gains
Short term capital gains on equity shares are taxed at a flat rate of 15 percent, provided that the transaction is executed through a recognized stock exchange and Securities Transaction Tax has been paid.
Example of Short Term Capital Gains
Imagine an investor buys shares of a listed company for ₹2 lakh and sells them after six months for ₹2.5 lakh.
The ₹50,000 profit is treated as short term capital gain and taxed at 15 percent, excluding surcharge and cess.
This means the investor will pay approximately ₹7,500 as tax on the gain.
What Is Long Term Capital Gains Tax on Shares
Long term capital gains occur when shares are held for more than one year before selling.
The taxation of these gains is covered under Section 112A.
Tax Rate on Long Term Capital Gains
Long term capital gains on listed equity shares are taxed at 10 percent if the total gains exceed ₹1 lakh in a financial year.
If the total gains remain within the ₹1 lakh exemption limit, no tax is payable.
Example of Long Term Capital Gains
Suppose an investor buys shares worth ₹3 lakh and sells them after two years for ₹4.5 lakh.
The total gain is ₹1.5 lakh.
Since the first ₹1 lakh of long term gains is exempt, tax applies only to the remaining ₹50,000 at 10 percent.
In this case, the investor pays ₹5,000 as tax.
Key Differences Between Short Term and Long Term Capital Gains
Holding Period
Short term gains apply when shares are sold within one year.
Long term gains apply when shares are held for more than one year.
Tax Rate
Short term gains are taxed at 15 percent.
Long term gains above ₹1 lakh are taxed at 10 percent.
Tax Planning Opportunities
Long term investing offers better tax efficiency because of the exemption limit and lower tax rate.
Impact on Investment Strategy
Understanding capital gains tax is important because taxes directly affect net returns.
For example, frequent traders who buy and sell stocks within months may face higher tax liabilities due to short term taxation.
Long term investors, on the other hand, benefit from the lower tax rate and exemption threshold.
This is one reason why many financial experts encourage long term investing in equities.
Market Perspective and Investor Behavior
Tax rules often influence how investors approach the stock market.
Many investors hold quality stocks for longer periods to take advantage of favorable long term tax treatment. This behavior supports stability in the market and encourages disciplined investing.
For instance, investors who held shares of major Indian companies over multiple years have historically benefited from both price appreciation and tax efficiency.
Practical Tips to Manage Capital Gains Tax
Investors can take a few practical steps to manage their tax liabilities.
Track Your Holding Period
Always check whether the investment qualifies for long term treatment before selling.
Plan Profit Booking
If your long term gains are close to the ₹1 lakh exemption limit, you can plan partial profit booking to minimize tax.
Maintain Proper Records
Keep records of purchase price, sale price, brokerage charges, and taxes paid to ensure accurate reporting during tax filing.
How the Right Investment Platform Can Help
Successful investing is not only about selecting stocks but also about managing taxes and maintaining proper records.
Platforms that provide strong research tools, portfolio tracking, and investor education can make this process easier.
Frequently Asked Questions
What is the holding period for long term capital gains on shares?
For listed equity shares, the holding period must be more than 12 months to qualify as long term capital gains.
What is the tax rate for short term capital gains on shares?
Short term capital gains on listed shares are taxed at 15 percent when transactions are executed through a recognized stock exchange.
Is there any exemption for long term capital gains?
Yes, long term capital gains up to ₹1 lakh in a financial year are exempt from tax.
Do intraday trades attract capital gains tax?
No. Intraday trading profits are considered speculative business income and are taxed according to the individual’s income tax slab.
Can losses from stocks be adjusted against gains?
Yes, capital losses can generally be adjusted against capital gains according to income tax rules, subject to specific conditions.
Conclusion
Understanding the difference between short term and long term capital gains tax on shares is essential for every stock market investor. Taxes can significantly influence the final return from investments, so planning ahead is crucial.
Short term gains come with higher tax rates, while long term investing offers better tax efficiency and exemption benefits. By aligning investment decisions with tax rules, investors can improve their overall portfolio performance.
Platforms like Swastika Investmart make investing simpler with research driven insights, technology enabled tools, and investor focused services.
If you are ready to begin your investment journey or want a smarter trading platform, you can open your account here

Best Ways to Save Income Tax Under Section 80C
Best Ways to Save Income Tax Under Section 80C
Tax planning is an important part of financial management for salaried individuals and investors in India. One of the most popular provisions that helps taxpayers legally reduce their tax liability is Section 80C under the Income Tax Act 1961.
Section 80C allows taxpayers to claim deductions of up to ₹1.5 lakh per financial year by investing in specific financial instruments or making eligible payments. For many individuals, this section forms the backbone of tax planning strategies.
The key is to choose options that not only reduce taxes but also help build long term wealth.
Quick Takeaways
• Section 80C allows tax deductions of up to ₹1.5 lakh annually.
• Popular options include ELSS mutual funds, PPF, life insurance premiums, and tax saving fixed deposits.
• Some investments offer higher returns but involve market risk.
• Smart tax planning combines safety, liquidity, and long term growth.
• Choosing the right investment depends on financial goals and risk tolerance.
Understanding Section 80C of the Income Tax Act
Section 80C is one of the most widely used deductions available to individual taxpayers. It allows deductions from taxable income for certain investments and expenses.
For example, if your annual taxable income is ₹10 lakh and you invest ₹1.5 lakh in eligible Section 80C instruments, your taxable income effectively reduces to ₹8.5 lakh.
This deduction can significantly lower the total tax payable, especially for individuals in higher tax brackets.
However, it is important to remember that the deduction limit is capped at ₹1.5 lakh per financial year.
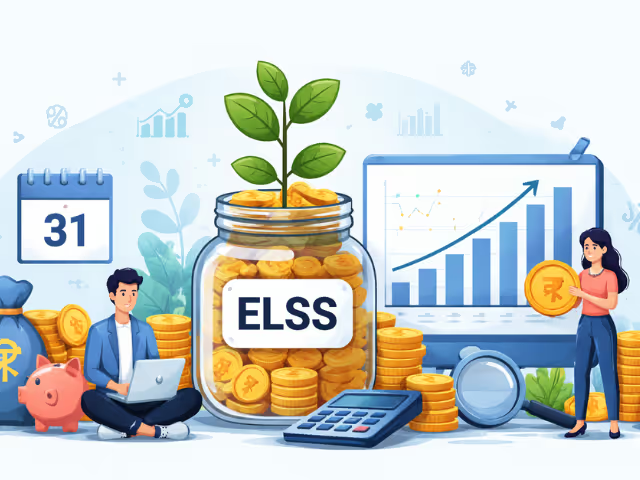
Equity Linked Savings Scheme
One of the most popular tax saving investments under Section 80C is the Equity Linked Savings Scheme.
ELSS mutual funds invest primarily in equities and have the shortest lock in period among Section 80C options, which is three years.
Why investors prefer ELSS
ELSS funds offer the potential for higher returns compared to traditional tax saving instruments. Since these funds invest in the stock market, they can benefit from long term equity growth.
For example, during strong market cycles, many ELSS funds have historically delivered returns that outperform fixed income instruments.
However, investors should also understand that returns are market linked and may fluctuate in the short term.
Public Provident Fund
Another popular option is the Public Provident Fund.
PPF is a government backed savings scheme that offers stable returns and tax benefits.
Key benefits of PPF
It provides guaranteed returns declared annually by the government. Contributions, interest earned, and maturity proceeds are all tax free under existing rules.
The main limitation is the lock in period of 15 years, which makes it suitable for long term goals such as retirement planning.
Tax Saving Fixed Deposits
Many conservative investors prefer tax saving fixed deposits offered by banks.
These deposits typically have a lock in period of five years and provide fixed interest income.
Although returns may be lower than market linked investments, they offer predictability and capital protection.
For individuals who prefer stability over volatility, tax saving FDs remain a reliable choice.
Life Insurance Premiums
Premiums paid toward eligible life insurance policies also qualify for deductions under Section 80C.
Life insurance not only provides tax benefits but also ensures financial protection for family members in case of unforeseen events.
However, investors should avoid purchasing insurance purely for tax savings. The primary purpose of life insurance should always be financial protection.
National Savings Certificate
Another traditional option under Section 80C is the National Savings Certificate.
This government backed instrument offers fixed returns and is commonly used by risk averse investors.
The lock in period typically ranges around five years, and interest earned is considered taxable.
Real Life Example of Section 80C Tax Planning
Consider a salaried professional earning ₹12 lakh annually.
If this individual invests ₹1.5 lakh in Section 80C eligible instruments such as ELSS or PPF, their taxable income reduces to ₹10.5 lakh.
Depending on the tax slab, this could translate into substantial tax savings every year.
Over time, if these investments generate returns, the taxpayer not only saves tax but also builds long term wealth.
Choosing the Right Section 80C Investment
Selecting the best tax saving option depends on several factors including age, financial goals, and risk tolerance.
Younger investors often prefer equity linked options such as ELSS because they have a longer investment horizon and can benefit from market growth.
Investors closer to retirement may prefer safer instruments like PPF or tax saving fixed deposits.
A balanced strategy may include a mix of equity and fixed income investments to manage risk while pursuing growth.
Why Market Linked Investments Are Gaining Popularity
In recent years, many investors have shifted toward market linked tax saving instruments.
Equity based investments have historically delivered higher long term returns compared to traditional fixed income products.
As financial awareness grows, investors are increasingly focusing on tax planning strategies that combine tax efficiency with wealth creation.
This shift is also supported by better access to investment platforms, research insights, and digital trading tools.
Smart Investing Requires the Right Platform
Tax saving investments should be part of a larger financial plan rather than a last minute decision before the tax filing deadline.
Investors benefit from platforms that offer strong research tools, reliable customer support, and investor education resources.
Frequently Asked Questions
What is the maximum deduction allowed under Section 80C?
Taxpayers can claim deductions of up to ₹1.5 lakh per financial year for eligible investments and expenses under Section 80C.
Which investment under Section 80C offers the highest return?
Equity Linked Savings Schemes often have the potential for higher returns because they invest in the stock market, though returns are not guaranteed.
Is PPF better than ELSS for tax saving?
PPF offers safety and guaranteed returns, while ELSS offers higher growth potential but involves market risk. The best option depends on the investor’s risk tolerance.
Can life insurance premiums be claimed under Section 80C?
Yes, eligible life insurance premiums paid for policies covering self, spouse, or children can be claimed under Section 80C.
Are tax saving fixed deposits risk free?
Tax saving fixed deposits provide predictable returns and capital protection, but interest earned is taxable.
Conclusion
Section 80C remains one of the most effective tools for reducing income tax liability in India. From ELSS mutual funds and PPF to life insurance and tax saving fixed deposits, taxpayers have several options to choose from.
The key is to align tax saving investments with long term financial goals rather than focusing solely on deductions. A well planned approach can help investors reduce taxes while building wealth over time.
With strong research capabilities, technology driven platforms, and dedicated investor education initiatives, Swastika Investmart supports investors in making smarter financial decisions.
If you are planning to begin your investment journey or optimize your tax saving strategy, you can open your account here

Why Indian Stock Markets Had Their Worst Week in 3 Years
Why Indian Stock Markets Had Their Worst Week in 3 Years
The Indian stock market recently experienced its sharpest weekly fall in more than three years. Benchmark indices such as the Nifty 50 and BSE Sensex declined significantly, wiping out nearly ₹34 lakh crore in investor wealth within days.
While market corrections are not unusual, the scale and speed of this fall raised several questions among investors. What triggered such a steep decline? Was it purely global events or were domestic factors also involved?
Understanding the reasons behind the recent market slump can help investors make more informed decisions and avoid reacting emotionally during periods of volatility.
Key Takeaways
• Indian stock markets recorded their steepest weekly decline in over three years.
• Rising global crude oil prices triggered inflation concerns and investor nervousness.
• Foreign investors pulled money out of Indian equities amid global uncertainty.
• Several sectors such as aviation, chemicals, and oil marketing companies came under pressure.
• Defensive sectors like FMCG and pharmaceuticals showed relative resilience.
Global Geopolitical Tensions Shook Investor Confidence
One of the biggest triggers behind the market fall was rising geopolitical tensions in the Middle East involving the United States, Iran, and Israel.
Whenever conflicts emerge in energy producing regions, global markets react quickly. Investors worry about potential disruptions to oil supply, rising commodity prices, and economic instability.
In this case, the conflict pushed global crude oil prices sharply higher. At one point, oil prices surged close to $120 per barrel. For a country like India that imports most of its energy needs, this becomes a major concern.
Higher oil prices increase the import bill, weaken the currency, and can raise inflation levels across the economy.
Why Rising Oil Prices Hurt the Indian Economy
India imports nearly 85 percent of its crude oil requirements. Because of this dependence, changes in global oil prices have a direct impact on the Indian economy.
When oil prices rise sharply, multiple challenges emerge simultaneously.
First, the country’s import bill increases. This can widen the current account deficit and put pressure on the Indian rupee.
Second, inflation risks increase. Higher fuel costs push up transportation expenses and manufacturing costs, which eventually affect retail prices.
Third, government finances can come under pressure if fuel subsidies rise.
Because of these risks, stock markets often react negatively to sudden oil price spikes.
A Rare Technical Signal Added to the Fear
Apart from global events, technical indicators also played a role in accelerating the decline.
The Nifty 50 recently slipped below its 100 week moving average. Many traders and institutional investors consider this level an important long term trend indicator.
Historically, such breaks have occurred during periods of extreme stress. During the COVID market crash in 2020, for instance, the market also broke key technical levels before recovering later.
When important support levels break, algorithmic trading systems often trigger automatic selling. This increases volatility and can push markets down faster than usual.
Foreign Investors Increased Selling Pressure
Another major factor behind the worst week for Indian markets was aggressive selling by foreign portfolio investors.
When global risks increase, international investors typically move capital from emerging markets to safer assets such as US government bonds or the US dollar.
This shift in capital flows puts additional pressure on markets like India.
In recent sessions, foreign investors sold thousands of crores worth of Indian equities. Such selling not only impacts prices but also influences market sentiment, causing domestic investors to become cautious.
Which Sectors Were Hit the Most
Certain industries tend to suffer more when oil prices rise sharply.
Oil marketing companies face margin pressure because they purchase crude oil at higher prices but cannot always pass on the full increase to consumers immediately.
The aviation sector also struggles because aviation turbine fuel is one of the largest operating costs for airlines.
Chemical companies, paint manufacturers, and tyre makers are also affected since many of their raw materials are derived from petroleum products.
As a result, these sectors witnessed some of the sharpest declines during the recent market correction.
Defensive Sectors Provided Stability
Not all sectors experienced heavy selling.
Defensive industries such as consumer goods and pharmaceuticals remained relatively stable. These sectors tend to perform better during uncertain economic conditions because demand for essential goods and medicines usually remains consistent.
Companies with strong balance sheets and stable cash flows also tend to attract investor interest during volatile market phases.
This rotation toward defensive stocks is a common pattern seen in global markets whenever uncertainty increases.
What Investors Should Watch Going Forward
The direction of Indian markets now depends on several factors.
Global oil prices remain the most important variable. If crude prices stabilize and move lower, investor confidence could return quickly.
Geopolitical developments in the Middle East will also play a major role in shaping market sentiment. Any escalation could increase volatility further.
Foreign investor flows are another key indicator. When global risk levels decline, foreign institutional investors often return to emerging markets such as India.
Finally, domestic economic indicators such as inflation, interest rates, and corporate earnings will influence the long term trajectory of the market.
The Importance of Research Driven Investing
Periods of market volatility often test investor patience. Many investors panic during corrections and exit positions at the wrong time.
Having access to reliable research and market insights can make a big difference during such phases. Investors who understand the broader economic context are better prepared to navigate market fluctuations.
Frequently Asked Questions
Why did Indian stock markets fall sharply recently?
The market decline was mainly driven by rising global oil prices, geopolitical tensions, foreign investor selling, and technical breakdowns in key indices.
How do oil prices impact Indian stock markets?
Higher oil prices increase India’s import bill, raise inflation risks, and weaken the currency, which can negatively affect market sentiment.
Which sectors suffer the most when oil prices rise?
Industries such as aviation, oil marketing, chemicals, paints, and tyre manufacturing usually face higher costs during oil price spikes.
Why do foreign investors sell during global uncertainty?
During periods of global risk, investors often move funds into safer assets like US bonds and the US dollar.
Are market corrections normal?
Yes. Corrections are a natural part of market cycles and often help remove excessive speculation before the next phase of growth.
Conclusion
The recent decline that led to the worst week for Indian stock markets in three years highlights how closely financial markets are linked to global events. Rising oil prices, geopolitical tensions, and foreign capital flows can quickly influence market direction.
However, experienced investors know that volatility is a normal part of long term investing. Periods of uncertainty also create opportunities for disciplined investors who focus on fundamentals rather than short term noise.
With strong research tools, investor education initiatives, and technology enabled trading platforms, Swastika Investmart helps investors make informed decisions in both stable and volatile markets.
If you are looking to begin or strengthen your investment journey, consider opening a trading account with Swastika Investmart today.

India’s LPG Supply at Risk? Understanding the Impact of Global Shipping Disruptions
India’s LPG Supply at Risk? Understanding the Impact of Global Shipping Disruptions
India’s energy security often depends on events happening thousands of kilometers away. Recently, disruptions in global shipping routes have raised concerns about the country’s LPG supply chain. A single choke point in global energy trade can create ripple effects that impact households, industries, and even the stock market.
The situation highlights how vulnerable India can be to geopolitical tensions and maritime disruptions. With a large portion of LPG imports moving through the Strait of Hormuz, even a short-term disturbance can create supply anxiety across the country.
Understanding how this works helps investors, businesses, and consumers make better financial and operational decisions.
Quick Takeaways
• India imports nearly 60 percent of its LPG, and most shipments pass through the Strait of Hormuz.
• Shipping disruptions can quickly increase import costs and create supply pressure.
• Oil marketing companies like Indian Oil Corporation, Bharat Petroleum, and Hindustan Petroleum may face higher logistics and procurement costs.
• Panic buying can worsen shortages even when actual supply remains manageable.
• Diversifying import sources is critical for India’s long-term energy security.
Why the Strait of Hormuz Matters for India
The Strait of Hormuz is one of the most important energy shipping lanes in the world. A significant share of global oil and LPG shipments pass through this narrow waterway that connects the Persian Gulf with international markets.
For India, the route is especially crucial. Nearly 90 percent of LPG imports travel through this channel. When tensions rise in the region or maritime traffic slows, energy shipments can be delayed. Even a temporary halt can affect supply chains within days.
For example, if tankers are forced to reroute or wait for safe passage, delivery schedules get disrupted. Import costs also rise due to higher insurance premiums and shipping charges. These costs eventually pass through the entire supply chain.
How Global Disruptions Affect Domestic LPG Supply
When global shipping faces disruptions, the impact is not limited to international trade. It directly influences India’s domestic distribution network.
Commercial LPG cylinders are widely used by restaurants, hotels, catering businesses, and food processing units. If supplies tighten, these industries face higher costs and operational uncertainty.
To stabilize the situation, the Ministry of Petroleum and Natural Gas has increased distribution efforts across the country. Authorities have also encouraged digital booking systems to avoid hoarding and ensure fair access.
At the same time, government agencies are monitoring stock levels and supply chains to prevent unnecessary shortages.
The Role of Oil Marketing Companies
India’s LPG ecosystem relies heavily on three major oil marketing companies.
These include Indian Oil Corporation, Bharat Petroleum, and Hindustan Petroleum.
These companies handle large-scale LPG imports, manage storage facilities, and coordinate nationwide distribution networks. During global supply disruptions, their operational responsibilities become even more complex.
Higher freight rates, fluctuating import prices, and inventory management challenges can put pressure on margins. In extreme cases, companies may also face subsidy-related adjustments if LPG prices rise significantly.
For stock market participants, these developments are closely monitored because energy logistics costs can influence profitability in the oil marketing sector.
Panic Buying and Supply Pressure
Another challenge during supply disruptions is consumer behavior. Even when supply is stable, panic buying can create artificial shortages.
Recent data showed LPG bookings surged dramatically in a short period. A sudden increase in demand forced distributors to manage higher delivery volumes while maintaining normal supply cycles.
Fortunately, bookings have started to stabilize after the initial surge. This suggests that the situation is more about temporary anxiety rather than a prolonged structural shortage.
Still, such episodes reveal how sensitive the energy supply chain can be to public sentiment.
Impact on the Indian Economy and Markets
Energy supply disruptions rarely remain confined to a single sector. They often have wider economic implications.
If LPG import costs rise significantly, the government may face higher subsidy requirements. This can influence fiscal planning and public spending.
Industries that rely on LPG as a fuel source may also experience rising operational costs. For example, restaurants, small manufacturers, and food processing units may see higher production expenses.
These changes can contribute to inflation in certain sectors. When energy prices rise, they often influence transportation costs, production costs, and retail prices.
From a market perspective, investors often track energy logistics closely because it can affect oil marketing companies and energy-related stocks.
How India Is Responding
India has been actively working to reduce energy vulnerability through diversification.
Instead of relying heavily on a single region, the country is expanding LPG imports from multiple markets. Potential suppliers include North America, Europe, and Russia. Diversifying shipping routes and suppliers reduces dependency on one geopolitical hotspot.
The government is also encouraging domestic energy infrastructure development and expanding storage capacity to manage supply disruptions more effectively.
Over time, these measures can strengthen India’s energy resilience.
What Investors Should Watch
Energy supply disruptions are not just policy issues. They also influence financial markets.
Investors should monitor global crude and LPG prices, shipping disruptions, and geopolitical tensions in key energy regions. These factors can influence inflation expectations, currency movements, and sector-specific stock performance.
Having access to reliable research and market insights becomes crucial during such periods. Platforms that offer strong analytics, investor education, and responsive customer support help investors navigate uncertainty more effectively.
Investors looking for research-backed insights and technology-driven trading tools can explore the offerings available at Swastika Investmart.
Open an account here:
https://trade.swastika.co.in/?UTMsrc=LPGSupplyRisk
Frequently Asked Questions
Why is the Strait of Hormuz important for India’s LPG supply?
A large share of India’s LPG imports passes through this route. Any disruption can delay shipments and increase import costs.
Which companies handle LPG supply in India?
Major oil marketing companies responsible for LPG distribution include Indian Oil Corporation, Bharat Petroleum, and Hindustan Petroleum.
Can shipping disruptions increase LPG prices in India?
Yes. Higher freight costs and delayed shipments can increase procurement expenses, which may influence retail LPG prices over time.
Does panic buying affect LPG availability?
Yes. Sudden spikes in bookings can strain distribution networks even when overall supply remains sufficient.
How is India reducing its energy vulnerability?
India is diversifying import sources, expanding storage capacity, and strengthening supply chain resilience to reduce reliance on a single shipping route.
Conclusion
Global energy supply chains are deeply interconnected. A disruption in a distant shipping lane can quickly affect domestic supply conditions, industrial operations, and investor sentiment in India.
The recent concerns around LPG availability highlight the importance of diversified energy imports and strong supply chain planning. While short-term disruptions can create anxiety, strategic policy decisions and improved infrastructure can help reduce long-term risks.
For investors, these developments reinforce the need to track global energy markets and geopolitical developments closely. Reliable research, robust trading technology, and investor education play a key role in making informed decisions.
Swastika Investmart provides a technology-driven platform, strong research insights, and dedicated customer support to help investors navigate complex market conditions with confidence.
.avif)
Stocks in News India Today 10 March 2026: Ramky Infra, JSW Steel, VA Tech Wabag and Data Patterns stocks
Summary
• Ramky Infra’s arm signed a ₹3,000 crore pharma park concession with MIDC.
• JSW Steel announced a coking coal mining project in Mozambique.
• VA Tech Wabag secured a water infrastructure project in Chennai.
• Data Patterns received an IMD contract for Doppler weather radar systems.
• These developments highlight opportunities across infrastructure, metals, water management, and defense technology sectors.
Ramky Infra, JSW Steel, VA Tech Wabag & Data Patterns Stocks in News Today : 16 March 2026
Stock market movements are often influenced by company announcements, new project wins, or strategic expansions. On 16 March 2026, several companies including Ramky Infrastructure, JSW Steel, VA Tech Wabag, and Data Patterns are attracting investor attention due to important developments.
For investors tracking daily market triggers, such announcements provide insight into sector momentum and potential future earnings growth. Understanding the context behind these updates helps investors move beyond headlines and make informed decisions.
Let’s examine the key developments and what they could mean for the Indian stock market.
Ramky Infrastructure in Focus After ₹3,000 Crore Pharma Park Project
Infrastructure developer Ramky Infrastructure announced that its subsidiary Maha Integrated Life Sciences (MILES) has signed a concession agreement with the Maharashtra Industrial Development Corporation (MIDC) to develop a high-tech pharmaceutical park worth ₹3,000 crore.
Why This Project Matters
India is rapidly expanding its pharmaceutical manufacturing ecosystem. Government initiatives promoting bulk drug parks and pharma clusters aim to strengthen domestic production and reduce import dependence.
Large scale infrastructure projects such as this pharma park create long term development opportunities for companies involved in planning, construction, and industrial infrastructure.
Potential Market Impact
Investors often view such project announcements positively because they strengthen a company’s order book and revenue visibility. If executed efficiently, the project could support Ramky Infra’s growth pipeline for the coming years.
It also reflects broader momentum in India’s pharmaceutical and industrial infrastructure ecosystem.
JSW Steel Expands Resource Security with Mozambique Coal Project
JSW Steel announced the development of a coking coal mining project in Mozambique, giving the company access to premium hard coking coal reserves.
Strategic Importance for Steel Producers
Coking coal is an essential raw material used in steel production. India imports a significant portion of its coking coal requirements, exposing steel companies to global price volatility.
By securing overseas coal reserves, JSW Steel strengthens its raw material supply chain and reduces exposure to global price fluctuations.
What Investors Should Watch
Vertical integration strategies help steel producers improve operational efficiency and manage costs more effectively during commodity cycles.
Given India’s strong infrastructure spending and manufacturing growth, steel demand is expected to remain robust. Companies that secure raw materials may gain a competitive advantage in the long term.
VA Tech Wabag Wins Chennai Water Infrastructure Contract
Water technology company VA Tech Wabag announced that it has secured an order from the Chennai Metropolitan Water Supply and Sewerage Board.
The project involves building a water transmission network for Greater Chennai City as part of a joint venture.
Growing Importance of Water Infrastructure
India’s urban centers are facing increasing water management challenges due to population growth and climate variability.
Cities are investing heavily in water treatment systems, desalination plants, and distribution networks to ensure sustainable water supply.
Impact for the Company
Projects like this strengthen VA Tech Wabag’s order book and reinforce its expertise in municipal water infrastructure.
For investors, the water management sector is emerging as an important theme as Indian cities upgrade critical utilities.
Data Patterns Secures Doppler Radar Order from IMD
Defense electronics company Data Patterns has received a contract from the Indian Meteorological Department (IMD) for the supply of 32 Doppler Weather Radar units.
Why Doppler Radars Matter
Doppler weather radars play a crucial role in weather forecasting, cyclone tracking, and disaster preparedness. Expanding India’s radar network improves early warning systems for extreme weather events.
Growth Opportunity in Defense Electronics
Data Patterns operates in the high technology defense and aerospace electronics space. Government contracts like this support long term revenue growth and strengthen India’s domestic electronics manufacturing ecosystem.
Initiatives such as Atmanirbhar Bharat continue to boost opportunities for Indian companies involved in strategic technologies.
What These Developments Indicate for the Indian Market
Looking at these announcements together reveals broader economic trends shaping India’s growth story.
Industrial Infrastructure Expansion
Projects like the Ramky pharma park highlight the push toward manufacturing ecosystems and industrial clusters.
Commodity Supply Security
JSW Steel’s overseas mining initiative shows how companies are strengthening supply chains amid global commodity volatility.
Urban Infrastructure Modernization
Water infrastructure projects reflect rising investments in sustainable urban development.
Technology and Strategic Manufacturing
Defense electronics orders indicate continued government spending on advanced technology and climate monitoring systems.
These trends are important for investors building long term portfolios around India’s structural growth sectors.
How Investors Should Interpret Stocks in News
Daily stock news can trigger short term market reactions, but disciplined investors look beyond immediate price movements.
Instead of reacting instantly to headlines, investors should evaluate:
• Whether the announcement strengthens long term revenue visibility
• Whether the development aligns with government policy trends
• Whether the company has strong execution capability and financial stability
Research driven platforms can make this process easier.
Swastika Investmart, a SEBI registered stockbroker, provides investors with detailed research insights, advanced trading technology, and strong customer support to help interpret market developments effectively.
Frequently Asked Questions
Which stocks are in news today 16 March 2026?
Ramky Infrastructure, JSW Steel, VA Tech Wabag, and Data Patterns are among the key stocks in focus today due to project announcements and new contracts.
Why do stock prices react to corporate announcements?
Announcements such as new orders, project wins, or strategic expansions can influence future earnings potential, which may impact investor sentiment.
Are infrastructure project announcements positive for companies?
Large infrastructure contracts can strengthen a company’s order book and improve revenue visibility, although execution and financial health remain important factors.
What sectors are gaining attention from today’s news?
Infrastructure development, steel manufacturing, water management, and defense technology sectors are currently attracting investor interest.
How can investors track important stock market developments?
Investors can use research driven platforms and brokerage tools that provide curated insights, market updates, and analysis of company announcements.
Conclusion
Corporate developments often provide valuable signals about sector momentum and economic activity. The latest announcements involving Ramky Infra, JSW Steel, VA Tech Wabag, and Data Patterns highlight opportunities across infrastructure, commodities, water management, and advanced technology sectors.
However, successful investing requires more than reacting to daily headlines. Combining market news with strong research and disciplined portfolio strategies can help investors navigate market volatility more effectively.
With its SEBI registration, advanced trading platforms, strong research team, and investor education initiatives, Swastika Investmart helps investors stay ahead of market developments and make informed investment decisions.
If you want to track stocks in news and act on market opportunities with expert insights, you can begin your investing journey today.
.avif)
Indian Stock Market Outlook for Today 16 March 2026: Global Cues, FII Activity and Key Levels
Summary
• Global markets remain mixed while Dow futures indicate a positive start.
• FIIs continue selling in cash markets while derivatives positioning looks cautious.
• Nifty has slipped below 23300 and key supports are placed at 23000 and 22750.
• Bank Nifty shows weakness below 54500 with 53500 acting as immediate support.
• Market participants should stay selective and focus on risk management.
Indian Stock Market Outlook for 16 March 2026: Global Cues, FII Activity and Key Levels
Indian equity markets are entering the week with a cautious tone as global cues remain mixed and institutional flows continue to influence short term sentiment. Traders and investors are closely monitoring derivative positioning, volatility indicators, and global market movements to gauge the likely direction of benchmark indices.
As of 16 March 2026, early indicators suggest that the market may open slightly positive due to strength in Dow futures and the Gift Nifty. However, underlying technical signals indicate that the broader trend remains fragile, especially after benchmark indices slipped below important support zones.
Understanding the key triggers for the day can help traders make better decisions. Let us break down the market setup, derivative data, and technical outlook for the Indian markets.
Global Market Signals and Their Impact
Global market cues continue to play a crucial role in shaping investor sentiment in India.
The US markets ended the previous session lower, with the Dow Jones Industrial Average closing about 119 points down. Weakness in the US market often influences emerging markets like India as foreign investors tend to adjust their risk exposure globally.
However, Dow futures were trading higher by about 145 points in early trade, indicating that global risk appetite may improve during the day.
Asian markets opened on a mixed note, reflecting uncertainty around global economic growth, interest rate expectations, and geopolitical developments. Mixed Asian cues typically result in range bound movements for Indian markets in the initial hours of trading.
Another important indicator for Indian traders is Gift Nifty, which was trading around 60 points higher. Gift Nifty often provides an early signal for the opening direction of the NSE Nifty index.
Overall, global cues are mildly supportive but not strong enough to confirm a sustained rally.
Institutional Activity and Market Liquidity
Institutional flows remain one of the biggest drivers of Indian equity markets.
Foreign Institutional Investors continued to remain net sellers in the cash market, with selling worth approximately ₹10,716 crore. On the other hand, Domestic Institutional Investors provided some support with buying worth about ₹9,977 crore.
This resulted in a net institutional outflow of around ₹739 crore.
When foreign investors reduce exposure in equities, markets often face short term pressure. This is especially visible during global uncertainty or when US bond yields rise.
Domestic institutions such as mutual funds, insurance companies, and pension funds often cushion this impact by providing liquidity support. This balance between foreign selling and domestic buying is currently preventing deeper corrections in the market.
For long term investors, these phases often create opportunities to accumulate quality stocks at better valuations.
Derivatives Data and Market Sentiment
Derivative data provides valuable insight into how professional traders are positioning themselves.
Recent FII activity in index derivatives shows a mixed to slightly negative bias.
Key positioning changes include:
Futures long positions increased by around 1,819 contracts while short positions increased significantly by more than 36,000 contracts. This suggests that traders are hedging their positions or expecting volatility.
Call options saw heavy activity with both long and short positions rising sharply. Put options also witnessed increased participation.
Such derivative activity generally indicates uncertainty rather than a strong directional trend.
The Nifty Put Call Ratio stands near 0.75 compared to 0.86 earlier, which signals a cautious sentiment in the market.
Meanwhile, the India VIX jumped above 22, reflecting higher expected volatility in the coming sessions.
A rising volatility index usually indicates that traders are preparing for sharp market moves.
Key Options Data Levels for Traders
Options data helps identify important support and resistance zones for indices.
For the upcoming expiry:
Highest Open Interest on the call side is near the 25000 strike, indicating a strong resistance zone.
On the put side, the highest open interest is near the 21500 strike, which acts as a long term support base.
The Max Pain level currently stands near 23500. Max Pain represents the strike price where option sellers experience the least loss and often acts as a magnet for the index during expiry weeks.
This suggests that the market may attempt to stabilize around the mid range levels before a directional move.
Technical Outlook for Nifty
The technical structure of Nifty has weakened after the index slipped below the 23300 support zone.
Once a major support is broken, it often becomes a resistance in subsequent sessions.
Important levels traders should watch today include:
Immediate support near 23000
Next support around 22750
If the index holds above 23000, short covering could push it higher toward resistance levels.
Key resistance levels remain:
23300
23640
A sustained move above 23640 may trigger fresh buying momentum.
Until that happens, traders may continue adopting a sell on rise approach.
Technical Outlook for Bank Nifty
Bank Nifty is also showing signs of weakness after slipping below the 54500 mark.
Banking stocks often lead the broader market trend, so their movement becomes crucial for the Nifty as well.
Important support levels include:
53500 as immediate support
52500 as the next major support
Resistance levels are placed near:
54500
55500
If Bank Nifty manages to reclaim 54500, short covering could push the index toward 55500.
However, continued weakness in banking stocks may keep the market under pressure in the near term.
What Traders and Investors Should Do
In the current environment, markets are likely to remain volatile with stock specific movements dominating the trend.
Short term traders should focus on:
Strict stop losses
Range trading strategies
Monitoring global market cues
Long term investors should view market corrections as opportunities to gradually build positions in fundamentally strong companies.
Diversification across sectors and disciplined investing remains essential in volatile market phases.
Why Research Driven Platforms Matter for Investors
Market volatility highlights the importance of reliable research and advisory services.
Platforms like Swastika Investmart, a SEBI registered brokerage, provide investors with structured market insights, technical research, and advanced trading platforms that help navigate complex market conditions.
From real time market analysis to investor education initiatives, such support systems help investors make informed decisions rather than reacting emotionally to market movements.
Frequently Asked Questions
Why did the Nifty fall below 23300?
The decline was mainly due to foreign institutional selling, global market uncertainty, and weakness in key sectors such as banking and IT.
What does India VIX above 22 indicate?
A higher India VIX suggests that traders expect increased volatility and larger price swings in the market.
What is Max Pain in options trading?
Max Pain is the price level where option sellers incur the least loss at expiry. Markets often gravitate toward this level during expiry week.
Is this a good time to invest in the market?
Market corrections often provide opportunities to accumulate quality stocks for long term investors, provided investments are aligned with financial goals.
Why are FII flows important for Indian markets?
Foreign Institutional Investors bring significant liquidity into the market. Their buying or selling activity can strongly influence short term market trends.
Conclusion
The Indian stock market on 16 March 2026 begins the week with mixed global cues and cautious derivative positioning. While Gift Nifty signals a slightly positive start, technical indicators suggest that the market may remain volatile unless key resistance levels are reclaimed.
Traders should closely track institutional flows, volatility indicators, and global developments before taking aggressive positions.
For investors looking to navigate such market conditions with expert guidance, Swastika Investmart offers research backed insights, advanced trading tools, and investor education to help build long term wealth.
If you want to take advantage of market opportunities with professional support, you can start your investing journey here:
What is ELSS Mutual Fund — Complete Beginner's Guide
What is ELSS Mutual Fund: Complete Beginner's Guide
Quick Insights
• ELSS mutual funds are equity based tax saving mutual funds under Section 80C.
• Investors can claim tax deduction up to ₹1.5 lakh per financial year.
• ELSS has the shortest lock in period of three years among tax saving options.
• These funds invest mainly in equities for long term wealth creation.
• Investors can invest through SIP or lumpsum depending on financial goals.
What is ELSS Mutual Fund: Complete Beginner's Guide
Tax saving and wealth creation are two goals that many investors try to achieve at the same time. In India, one investment option that helps achieve both objectives is the ELSS mutual fund.
Equity Linked Saving Scheme, commonly called ELSS, is a mutual fund category that allows investors to claim tax deductions while participating in the growth potential of the stock market.
For beginners who are starting their investment journey, understanding how ELSS works can help in building a tax efficient portfolio.
What is ELSS Mutual Fund
An ELSS mutual fund is a diversified equity mutual fund that primarily invests in stocks and equity related instruments.
These funds qualify for tax deductions under Section 80C of the Income Tax Act, making them a popular tax saving investment option.
Investors can claim deductions of up to ₹1.5 lakh per financial year by investing in ELSS funds.
Unlike traditional tax saving options such as fixed deposits or Public Provident Fund, ELSS funds invest in equities, which means returns depend on stock market performance.
Because of this equity exposure, ELSS funds offer the potential for higher long term returns.
Key Features of ELSS Mutual Funds
Understanding the features of ELSS helps investors decide whether this investment fits their financial goals.
Shortest Lock in Period
ELSS funds have a lock in period of three years, which is the lowest among tax saving investment instruments available under Section 80C.
For example, Public Provident Fund has a lock in of fifteen years and tax saving fixed deposits have a lock in of five years.
This shorter lock in period gives investors relatively better liquidity.
Equity Market Exposure
Since ELSS funds invest mainly in equities, they can benefit from long term growth in the Indian stock market.
Over the past decades, Indian equities have delivered strong long term returns due to economic growth, rising consumption, and corporate earnings expansion.
Professional Fund Management
ELSS funds are managed by professional fund managers who select stocks based on research and market analysis.
This provides diversification and reduces the need for individual investors to analyze every stock themselves.
How ELSS Mutual Funds Work
When you invest in an ELSS fund, your money is pooled with other investors and invested in a diversified portfolio of stocks.
The fund manager may invest across sectors such as banking, IT, consumer goods, pharmaceuticals, or infrastructure.
For example, an ELSS fund portfolio may include shares of large companies, emerging mid cap businesses, and high growth sectors.
The performance of the fund depends on the performance of these underlying stocks.
Investors can invest in ELSS funds through two main methods.
SIP Investment
A Systematic Investment Plan allows investors to invest a fixed amount regularly, such as monthly investments.
This approach helps reduce market timing risk and encourages disciplined investing.
Lumpsum Investment
In lumpsum investing, the investor invests a larger amount at once, usually near the end of the financial year to claim tax benefits.
Both methods are commonly used depending on the investor’s cash flow and financial planning approach.
Tax Benefits of ELSS Funds
The main reason many investors choose ELSS is the tax advantage.
Section 80C Deduction
Investments in ELSS qualify for deduction up to ₹1.5 lakh per year under Section 80C of the Income Tax Act.
This deduction can help reduce taxable income and overall tax liability.
Long Term Capital Gains Tax
After the three year lock in period, profits from ELSS investments are treated as long term capital gains.
Currently, long term capital gains on equities above ₹1 lakh in a financial year are taxed at ten percent.
Despite this tax, ELSS funds remain attractive due to their growth potential and tax deduction benefits.
ELSS vs Other Tax Saving Investments
Investors often compare ELSS funds with other tax saving instruments such as PPF, tax saving fixed deposits, or National Savings Certificate.
Return Potential
ELSS funds offer market linked returns, which may be higher over the long term compared with fixed income products.
Lock in Period
ELSS has a three year lock in period, which is significantly shorter than many other tax saving instruments.
Risk Level
Since ELSS invests in equities, it carries market risk. However, this risk is also the reason why ELSS has the potential to generate higher returns.
Investors with a long term investment horizon often consider ELSS funds as part of their financial planning strategy.
Real Life Example of ELSS Investment
Suppose a salaried professional invests ₹12,500 every month in an ELSS fund through SIP.
Over one year, the total investment becomes ₹1.5 lakh, which qualifies for the full Section 80C tax deduction.
If the equity markets perform well over time, the investor may benefit from both tax savings and capital appreciation.
Many investors use this strategy to combine tax planning with long term wealth creation.
Impact on Indian Financial Markets
ELSS funds play an important role in channeling household savings into the equity markets.
As more investors allocate funds toward ELSS investments, mutual funds receive larger inflows which are then invested in listed companies.
This helps improve liquidity and participation in the Indian capital markets.
Over the past decade, rising awareness about mutual funds and tax efficient investing has increased the popularity of ELSS among retail investors.
Things Investors Should Consider Before Investing
Before investing in ELSS funds, investors should evaluate a few key factors.
Investment Horizon
Although the lock in period is three years, investors should ideally stay invested longer to benefit from equity market growth.
Fund Performance
Comparing historical performance, portfolio composition, and fund manager track record can help identify quality funds.
Risk Tolerance
Since ELSS funds invest in equities, investors should be comfortable with short term market fluctuations.
Conducting proper research is important before making investment decisions.
Platforms that provide research tools and investment insights can help investors analyze options more effectively.
Swastika Investmart, a SEBI registered stock broker, offers research driven insights, technology enabled trading platforms, and investor education resources that help individuals make informed financial decisions.
Frequently Asked Questions
What is ELSS mutual fund?
ELSS mutual funds are equity based tax saving funds that allow investors to claim deductions under Section 80C while investing in the stock market.
What is the lock in period for ELSS?
ELSS funds have a mandatory lock in period of three years from the date of investment.
How much tax deduction can I claim through ELSS?
Investors can claim deductions up to ₹1.5 lakh per financial year under Section 80C.
Can beginners invest in ELSS funds?
Yes, ELSS funds are suitable for beginners who want to start investing in equities while also saving tax.
Are ELSS mutual funds risky?
Since they invest in equities, ELSS funds carry market risk, but they also offer the potential for higher long term returns.
Conclusion
ELSS mutual funds have become one of the most popular tax saving investment options in India because they combine tax benefits with the growth potential of equities.
With a relatively short lock in period, professional fund management, and the ability to invest through SIP or lumpsum, ELSS funds can be a useful addition to many investors’ portfolios.
However, like all equity investments, they require a long term perspective and careful selection of funds.
Investors who want access to research insights, market analysis, and technology driven investment platforms can consider opening an account with Swastika Investmart.

SIP in ELSS vs Lumpsum — Which is Better for Tax Saving?
Quick Takeaways
• ELSS funds allow tax deduction up to ₹1.5 lakh under Section 80C.
• SIP in ELSS spreads investment across market cycles and reduces timing risk.
• Lumpsum investing can work well when markets are undervalued.
• ELSS comes with the shortest lock in period among tax saving instruments.
• The right choice depends on income pattern, market outlook, and risk appetite.
SIP in ELSS vs Lumpsum: Which is Better for Tax Saving?
Tax planning is an important part of personal finance in India. Many investors look for options that help reduce tax liability while also creating long term wealth. Equity Linked Saving Schemes, commonly known as ELSS funds, are one of the most popular investment options under Section 80C of the Income Tax Act.
However, investors often face one key question. Should they invest in ELSS through a Systematic Investment Plan or invest the entire amount as a lumpsum?
Understanding the difference between SIP in ELSS vs lumpsum investing can help investors make better decisions for both tax saving and long term wealth creation.
What is ELSS and Why Investors Use It for Tax Saving
Equity Linked Saving Schemes are diversified equity mutual funds that provide tax benefits under Section 80C.
Investors can claim a deduction of up to ₹1.5 lakh per financial year by investing in ELSS funds. Compared with other tax saving options such as PPF, tax saving fixed deposits, or life insurance policies, ELSS funds offer three key advantages.
Shortest Lock in Period
ELSS has a lock in period of only three years, which is the shortest among tax saving investment options.
Equity Market Exposure
Since ELSS funds invest primarily in equities, they offer the potential for higher returns over the long term compared to traditional fixed income tax saving instruments.
Professional Fund Management
ELSS funds are managed by experienced fund managers who invest across sectors and companies.
Because of these features, ELSS funds have become a preferred tax saving option for many salaried and self employed investors.
Understanding SIP in ELSS
A Systematic Investment Plan allows investors to invest a fixed amount regularly in a mutual fund.
For example, instead of investing ₹1.5 lakh at once, an investor may invest ₹12,500 every month in an ELSS fund.
Benefits of SIP in ELSS
Rupee Cost Averaging
Markets move up and down over time. SIP helps investors buy more units when prices are low and fewer units when prices are high.
This averaging effect reduces the risk of investing at the wrong market level.
Disciplined Investing
SIP encourages regular investing and builds financial discipline.
Many investors find it easier to invest smaller amounts monthly rather than a large amount once a year.
Reduced Market Timing Risk
Even experienced investors find it difficult to time the market perfectly. SIP reduces the impact of market timing mistakes.
For investors with regular income such as salaried professionals, SIP in ELSS is often the most practical tax saving strategy.
Understanding Lumpsum Investment in ELSS
In a lumpsum approach, the investor invests the entire amount at once.
For example, an investor may invest ₹1.5 lakh in an ELSS fund before the end of the financial year to claim tax benefits.
Advantages of Lumpsum Investing
Potential for Higher Returns in Bull Markets
If the market is undervalued and enters a strong uptrend, lumpsum investments may generate higher returns because the entire amount participates in the rally.
Simpler Investment Process
Lumpsum investing requires only a single transaction instead of multiple monthly contributions.
However, lumpsum investing comes with higher exposure to market timing risk.
Real Market Example
Consider two investors investing ₹1.5 lakh in an ELSS fund during a volatile market period.
Investor A chooses SIP and invests ₹12,500 monthly. Investor B invests ₹1.5 lakh as a lumpsum.
If the market falls initially and recovers later, the SIP investor benefits from buying units at lower prices during the market decline.
On the other hand, if the market rises immediately after the lumpsum investment, the lumpsum investor may earn higher returns.
This example shows that the performance difference between SIP and lumpsum depends largely on market conditions.
Impact of Market Cycles on Investment Strategy
Indian equity markets have experienced significant volatility in recent years due to global interest rate changes, geopolitical tensions, and economic developments.
Despite short term fluctuations, the long term growth trend of Indian equities remains strong due to factors such as rising consumption, infrastructure spending, and digital transformation.
Because of this long term growth story, ELSS funds continue to attract investors seeking both tax savings and wealth creation.
For investors who are uncertain about short term market direction, SIP provides a balanced approach.
Tax Rules Investors Should Know
ELSS investments qualify for deduction under Section 80C of the Income Tax Act.
Key tax rules include
• Maximum deduction allowed is ₹1.5 lakh per financial year
• Lock in period is three years from the date of each investment
• Long term capital gains above ₹1 lakh are taxed at 10 percent
Since SIP investments are treated as separate investments, each SIP installment has its own three year lock in period.
Understanding these tax rules helps investors plan their investments more effectively.
SIP vs Lumpsum: Which Strategy Works Better?
The choice between SIP in ELSS vs lumpsum depends on the investor’s financial situation.
SIP may be better suited for
• Salaried individuals with regular monthly income
• Investors who want to reduce market timing risk
• Beginners entering the equity market
Lumpsum investment may suit
• Investors with surplus funds available at once
• Individuals investing during market corrections
• Experienced investors with higher risk tolerance
In practice, many investors combine both approaches depending on their cash flow and market outlook.
Why Research Matters Before Choosing Investments
Selecting the right ELSS fund requires careful evaluation of fund performance, portfolio quality, expense ratios, and risk levels.
Retail investors often benefit from professional research and investment tools when making these decisions.
Swastika Investmart, a SEBI registered stock broker, offers technology driven investment platforms, research insights, and dedicated customer support to help investors analyze financial products more effectively.
With investor education initiatives and research backed insights, platforms like Swastika Investmart help investors navigate tax saving and wealth creation strategies with greater confidence.
Frequently Asked Questions
What is the lock in period for ELSS funds?
ELSS funds have a mandatory lock in period of three years from the date of investment.
Can I invest in ELSS through SIP?
Yes, investors can invest in ELSS through a Systematic Investment Plan with monthly contributions.
Is SIP better than lumpsum for ELSS?
SIP helps reduce market timing risk and is suitable for investors with regular income, while lumpsum investments may work better when markets are undervalued.
How much tax deduction can I claim through ELSS?
Investors can claim deductions up to ₹1.5 lakh per financial year under Section 80C.
Are ELSS funds risky?
Since ELSS funds invest in equities, they carry market risk, but they also offer potential for higher long term returns.
Conclusion
When comparing SIP in ELSS vs lumpsum investing, there is no single strategy that works for every investor. The right choice depends on income pattern, market conditions, and personal risk tolerance.
SIP offers a disciplined and less risky approach to investing in equities for tax saving, while lumpsum investing can be beneficial when markets present attractive opportunities.
Regardless of the approach, the key is to stay consistent with long term investing goals and make informed decisions based on research.
Investors looking for reliable research tools, market insights, and a technology driven trading experience can consider opening an account with Swastika Investmart.
JSW Energy Fundamental Analysis 2025 — Buy, Hold or Avoid?
Key Takeaways
• JSW Energy is rapidly expanding in renewable energy and power generation capacity.
• Strong demand for electricity in India supports long term growth prospects.
• Debt levels and aggressive expansion require close monitoring.
• Renewable energy investments could improve future profitability.
• Investors should evaluate valuation and growth visibility before making decisions.
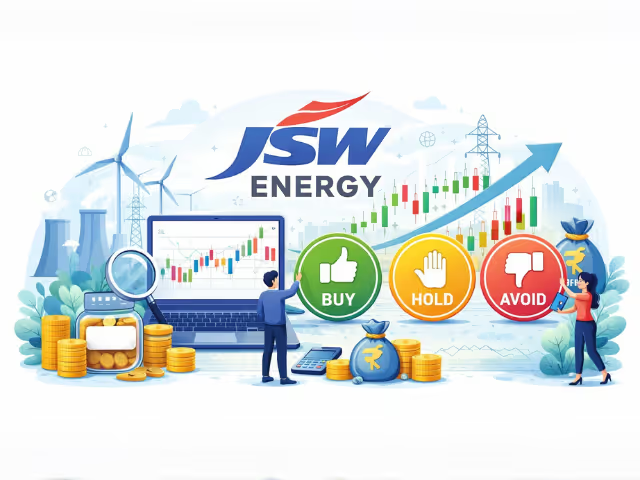
JSW Energy Fundamental Analysis 2025
India’s power sector is entering a transformation phase driven by rising electricity demand, renewable energy adoption, and government policy support. One company that has been actively expanding in this space is JSW Energy.
In this JSW Energy Fundamental Analysis 2025, we evaluate the company’s business model, financial performance, growth strategy, and future prospects to help investors decide whether the stock is worth buying, holding, or avoiding.
Understanding JSW Energy’s Business Model
JSW Energy is part of the well known JSW Group, which has interests in steel, infrastructure, and energy. The company operates in power generation and focuses on both conventional and renewable energy sources.
Its power portfolio includes:
Thermal Power Plants
Coal based plants continue to form a major part of the company’s capacity and help generate stable base load electricity.
Hydropower
Hydropower assets provide clean energy generation and long term operational stability.
Renewable Energy
JSW Energy has been aggressively investing in solar and wind energy projects as part of India’s transition toward clean energy.
India’s power demand has been growing steadily due to industrial expansion, urbanization, and increasing electricity consumption. This structural demand provides a favorable backdrop for power generation companies.
Power Sector Outlook in India
India is one of the fastest growing electricity markets in the world. According to government targets, the country aims to significantly increase renewable energy capacity by 2030.
Several factors are driving this growth:
• Rapid industrialization
• Growth in electric vehicles
• Rising air conditioning demand
• Government focus on renewable energy
Power generation companies that expand capacity and improve operational efficiency may benefit from this long term demand trend.
JSW Energy Financial Performance
A key aspect of any fundamental analysis is evaluating the company’s financial health.
JSW Energy has shown relatively stable revenue growth in recent years as electricity demand improved across India. Its diversified generation portfolio helps maintain steady cash flows.
Revenue Growth
The company has expanded revenue through:
• Increased power generation capacity
• Long term power purchase agreements
• Renewable energy projects
Long term power contracts with utilities and industrial customers provide predictable revenue streams.
Profitability
Profit margins in the power sector depend heavily on fuel costs, plant utilization, and operational efficiency.
JSW Energy has been working to improve efficiency and reduce costs through technology upgrades and renewable capacity additions.
However, investors should note that profitability in the power sector can fluctuate depending on coal prices and regulatory policies.
Debt and Capital Expansion
Large infrastructure businesses such as power generation require significant capital investment.
JSW Energy has been investing heavily to expand its generation capacity. While this supports long term growth, it also increases debt levels.
Higher debt can create risks if:
• Interest rates rise
• Power demand weakens
• Project execution delays occur
Investors should therefore monitor the company’s debt to equity ratio and cash flow generation closely.
Renewable Energy Strategy
One of the most important elements in the JSW Energy Fundamental Analysis 2025 is its renewable energy expansion.
The company has announced ambitious plans to expand solar, wind, and hydro capacity over the coming years.
This strategy aligns with India’s broader clean energy transition.
Renewable energy offers several advantages:
• Lower long term operating costs
• Reduced exposure to fuel price volatility
• Government policy support and incentives
If executed well, this shift could strengthen JSW Energy’s long term competitiveness.
Competitive Landscape
The Indian power sector includes several major listed companies.
Large players such as NTPC, Tata Power, and Adani Power operate extensive power generation portfolios and continue to invest in renewable energy.
Compared with these companies, JSW Energy is still expanding its scale but has shown strong ambition in renewable investments.
Investors evaluating power stocks should compare:
• Generation capacity
• Renewable energy mix
• Financial strength
• Return on capital
Such comparisons help determine whether a company’s valuation is justified.
Valuation Perspective
Valuation is a crucial factor when deciding whether to invest in a stock.
Even strong businesses may deliver limited returns if purchased at excessively high valuations.
Investors typically examine:
• Price to earnings ratio
• Price to book value
• Return on equity
• Earnings growth outlook
If the market prices in overly optimistic expectations, the stock may face consolidation even if the company performs well operationally.
Real World Example of Power Demand Growth
India’s electricity demand has seen consistent growth in recent years. During peak summer months, record power consumption levels have been observed across several states.
Industrial sectors such as steel, cement, and manufacturing require reliable power supply to operate efficiently.
Companies that can deliver stable electricity generation while expanding renewable capacity may benefit from this demand trend.
JSW Energy’s strategy to diversify its generation mix positions it to capture part of this opportunity.
Risks Investors Should Consider
While the long term outlook for the power sector remains positive, investors should also be aware of potential risks.
Regulatory Risks
Power tariffs and environmental regulations are closely monitored by government authorities.
Policy changes can affect profitability and project approvals.
Fuel Price Volatility
Thermal power plants depend on coal and other fuels. Price fluctuations can impact operating margins.
Capital Intensive Industry
Large infrastructure investments require substantial funding. Companies must maintain healthy balance sheets to support expansion.
Why Research Matters Before Investing
Stock market investing requires careful analysis of financial statements, industry trends, and valuation levels.
Retail investors often benefit from research insights provided by professional brokerage firms.
Swastika Investmart, a SEBI registered stock broker, offers research driven market insights, advanced trading platforms, and strong customer support to help investors make informed investment decisions.
Its technology enabled tools and investor education initiatives allow traders and investors to analyze opportunities with greater confidence.
Frequently Asked Questions
What does JSW Energy do?
JSW Energy operates in power generation and produces electricity through thermal, hydro, and renewable energy projects.
Is JSW Energy a renewable energy company?
The company operates both conventional and renewable power assets but is increasingly investing in solar and wind energy.
What are the key growth drivers for JSW Energy?
Rising electricity demand, renewable energy expansion, and long term power purchase agreements are major growth drivers.
What risks should investors consider?
Investors should monitor debt levels, fuel price volatility, regulatory policies, and project execution risks.
Is the power sector a good long term investment in India?
India’s rising electricity demand and energy transition create long term opportunities, but investors must evaluate company fundamentals carefully.
Conclusion
JSW Energy is positioning itself as a growing player in India’s evolving power sector, particularly through its renewable energy expansion strategy.
The company benefits from rising electricity demand and a diversified power generation portfolio. At the same time, investors must consider factors such as debt levels, valuation, and project execution risks before making investment decisions.
A disciplined, research driven approach can help investors identify opportunities while managing risks.
For investors who want access to professional research tools, market insights, and a technology driven trading platform, opening an account with Swastika Investmart can be a valuable step.

Why We Are Avoiding GSP Crop Science IPO — A Data-Driven Analysis
Why We Are Avoiding GSP Crop Science IPO: A Data-Driven Analysis
India’s primary market continues to see a steady flow of IPOs across sectors such as manufacturing, technology, and agrochemicals. While new listings often create excitement among retail investors, not every IPO offers an attractive investment opportunity.
The GSP Crop Science IPO is one such issue that has generated interest among investors due to its presence in the agrochemical sector. However, when we closely analyze the company’s financial performance, valuation metrics, and industry dynamics, several concerns emerge.
In this detailed review, we break down the numbers, compare the company with industry peers, and explain why investors may want to stay cautious about this IPO.
TL;DR
• GSP Crop Science IPO appears expensive compared to industry peers on valuation metrics.
• Profit growth has slowed sharply despite revenue expansion.
• Agrochemical businesses face regulatory, raw material, and commodity cycle risks.
• Based on financial ratios and sector outlook, the IPO may not offer attractive risk-reward.
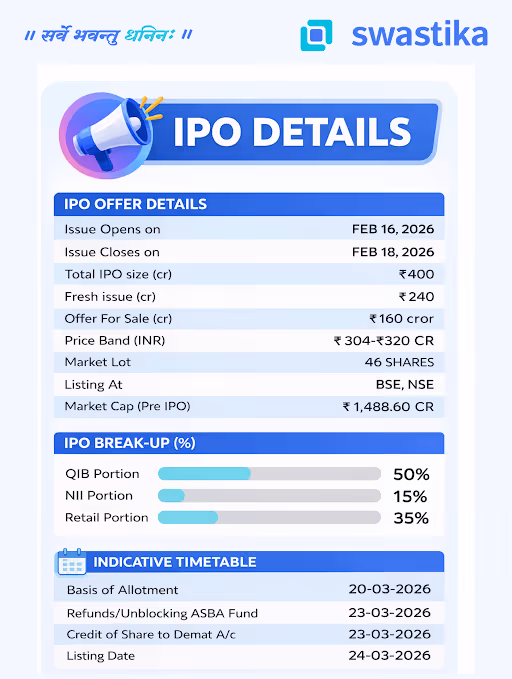
IPO Snapshot
About GSP Crop Science
GSP Crop Science is a research-driven agrochemical company involved in manufacturing crop protection products such as insecticides, herbicides, fungicides, and plant growth regulators.
The company operates across two key segments:
- Formulations – Finished agrochemical products used directly by farmers.
- Technicals – Concentrated active ingredients that serve as the base for formulations.
Its products are sold across domestic and international markets, targeting agricultural customers who require solutions to improve crop yields and manage pest control.
Over the years, the company has focused on expanding its product portfolio through research and development while strengthening manufacturing capabilities.
Financial Performance
A closer look at the company’s financials reveals a mixed picture.
Revenue growth has been visible, but profitability has deteriorated significantly in recent years.
Revenue Growth
- FY23 Revenue: ₹1,301 crore
- FY24 Revenue: ₹1,158 crore
- FY25 Revenue: ₹1,206 crore
While the business has maintained revenue above the ₹1,000 crore mark, growth has been inconsistent.
Profit Decline
The company’s profit trend is more concerning.
- FY23 Net Profit: ₹81.42 crore
- FY24 Net Profit: ₹55.54 crore
- FY25 Net Profit: ₹17.57 crore
This represents a sharp drop in profitability.
Margins have also contracted.
- EBITDA Margin FY23: 12.61%
- EBITDA Margin FY24: 11.26%
- EBITDA Margin FY25: 6.74%
Declining margins often signal cost pressures, pricing competition, or operational inefficiencies. For investors evaluating IPOs, weakening profitability is a major red flag.
Valuation Concerns
The biggest concern with the IPO lies in its valuation.
Based on FY25 earnings, the company is expected to list at a Price to Earnings ratio of about 15.34 times.
At first glance, this may appear cheaper compared to some listed agrochemical companies.
However, the issue is that the earnings base itself has declined sharply. When profits fall dramatically, even moderate valuations can become risky.
Peer Comparison
When compared with listed agrochemical companies, the valuation appears stretched relative to growth prospects.
For example:
- PI Industries trades at around 28 times earnings
- Sumitomo Chemical India around 39 times
- Bharat Rasayan roughly 4 times
- Excel Industries about 13 times
However, many of these companies have stronger profitability, better margins, or established export networks.
In contrast, GSP Crop Science currently faces declining margins and volatile earnings.
Therefore, the valuation does not provide a sufficient margin of safety.
Industry Risks
The agrochemical industry has strong long-term potential due to rising food demand and the need to improve crop productivity. However, it also comes with structural risks.
Regulatory Challenges
Crop protection products require approvals from multiple regulatory authorities in India and international markets. Any delays or restrictions can impact product launches and sales.
Raw Material Volatility
Many agrochemical inputs are derived from chemical intermediates. Fluctuations in raw material prices can directly impact operating margins.
Agricultural Cycles
The sector is closely tied to monsoon patterns, crop cycles, and farmer income levels. Poor rainfall or weak rural demand can affect product sales.
Competitive Pressure
The agrochemical industry is highly competitive with both domestic players and global giants. Price competition often squeezes margins for smaller companies.
Key Strengths
Despite the concerns, the company does have certain strengths.
- Diversified product portfolio across insecticides, herbicides, fungicides, and growth regulators
- Integrated business model with both technicals and formulations
- Established manufacturing presence in India
- Focus on research and product registrations
These strengths indicate that the company has built a functional agrochemical platform.
However, strong fundamentals must translate into stable profitability to justify a public listing valuation.
Key Concerns
Several issues make the IPO less attractive.
First, profitability has declined sharply over the last three years.
Second, margins have almost halved, indicating operational pressure.
Third, revenue growth remains inconsistent despite operating in a growing sector.
Fourth, the agrochemical industry itself is cyclical and heavily regulated.
Finally, the IPO valuation does not offer enough comfort given the current earnings profile.
Should Investors Subscribe?
IPO investing requires a balance between growth potential and valuation comfort.
In the case of GSP Crop Science, the numbers suggest that investors should adopt a cautious approach.
While the company operates in a promising sector, declining profitability and margin pressure raise concerns about earnings sustainability.
For long-term investors, it may be wiser to wait and observe the company’s performance after listing before considering an investment.
How Investors Can Approach IPO Opportunities
For retail investors, IPO excitement often leads to quick decisions. A better approach is to evaluate three key aspects:
- Financial stability
- Industry outlook
- Valuation compared to peers
Using research tools and expert insights can make a big difference in identifying quality opportunities.
Platforms like Swastika Investmart help investors analyze IPOs through research reports, market insights, and easy-to-use trading platforms.
Frequently Asked Questions
Is GSP Crop Science a good IPO to apply for?
Based on current financials and valuation, the IPO appears less attractive compared to peers. Investors may consider staying cautious.
What is the price band of the GSP Crop Science IPO?
The price band is ₹304 to ₹320 per share with a lot size of 46 shares.
When will GSP Crop Science IPO list?
The tentative listing date is March 24, 2026 on BSE and NSE.
What sector does the company operate in?
GSP Crop Science operates in the agrochemical industry producing crop protection products such as insecticides, herbicides, and fungicides.
Why are analysts cautious about this IPO?
Key concerns include declining profit margins, inconsistent revenue growth, and valuation risks compared with listed peers.
Conclusion
IPO markets often create opportunities for wealth creation, but careful analysis is essential before investing.
The GSP Crop Science IPO highlights why numbers matter more than hype. Despite operating in a promising agrochemical sector, the company’s declining profitability and margin pressures raise questions about its near-term growth trajectory.
For investors, patience can often be the best strategy.
If you are looking for expert IPO analysis, powerful trading tools, and reliable customer support, Swastika Investmart provides a technology-driven investing platform backed by strong research and SEBI-registered expertise.

How to Use Basic Exemption Limit to Save LTCG Tax
How to Use Basic Exemption Limit to Save LTCG Tax
Key Highlights
• The basic exemption limit can be used to reduce or eliminate long term capital gains tax for certain investors.
• If your total income is below the exemption threshold, LTCG can be adjusted against the remaining limit.
• This strategy is useful for retirees, students, and individuals with low taxable income.
• Proper planning before the financial year ends can help investors legally reduce their tax burden.
• Understanding Indian tax rules and capital gains provisions helps investors maximize after tax returns.
How to Use Basic Exemption Limit to Save LTCG Tax
Many investors focus heavily on market returns but overlook an equally important aspect of wealth creation: tax planning.
In India, long term capital gains tax on equities applies when profits exceed ₹1 lakh in a financial year. However, there is a lesser known provision that can help investors reduce or even eliminate their tax liability in certain situations.
This provision involves using the basic exemption limit available under the Income Tax Act.
For beginners and even experienced investors, understanding how to use the basic exemption limit can significantly improve after tax returns. The strategy is completely legal and widely used by tax aware investors.
Let us explore how it works.
Understanding the Basic Exemption Limit in India
Every individual taxpayer in India is entitled to a basic exemption limit. This is the portion of income that is not subject to income tax.
Under the current tax rules, the basic exemption limit generally applies as follows for individuals below 60 years of age.
₹2.5 lakh under the old tax regime.
If a person's total taxable income is below this limit, they do not need to pay income tax.
What many investors do not realize is that long term capital gains from equity investments can also be adjusted against the unused portion of this limit.
This rule becomes particularly useful for individuals with lower taxable income.
How LTCG Tax Works on Equity Investments
To understand the benefit of the exemption limit, it is important to first understand how long term capital gains are taxed.
For listed shares and equity mutual funds:
If the investment is held for more than one year, the profit is classified as long term capital gain.
Currently, long term capital gains exceeding ₹1 lakh in a financial year are taxed at 10 percent.
However, if the investor's total taxable income is below the basic exemption limit, a portion of the LTCG can be adjusted against that limit before applying tax.
This can significantly reduce the taxable amount.
A Simple Example
Consider the case of Riya, a young investor who recently started investing in the stock market.
Her annual salary income is ₹2 lakh. She also sold equity shares during the year and earned a long term capital gain of ₹1.2 lakh.
Here is how the tax calculation works.
The basic exemption limit is ₹2.5 lakh.
Riya's salary income is ₹2 lakh, leaving ₹50,000 of unused exemption.
This remaining ₹50,000 can be adjusted against her long term capital gain.
After adjustment, her taxable LTCG becomes ₹70,000.
Since the tax rule allows the first ₹1 lakh of LTCG to be exempt, Riya ends up paying zero tax on her gains.
This example highlights how proper planning can significantly reduce tax liability.
Who Can Benefit the Most from This Strategy
Using the basic exemption limit to save LTCG tax works best for certain categories of investors.
Retired Individuals
Many retirees rely on investments rather than active income. Their taxable income may fall below the basic exemption limit, allowing them to use this strategy effectively.
Students and Young Investors
Young investors who earn modest income from internships or part time work often fall below the tax threshold.
They can use the exemption limit to reduce taxes on long term gains.
Homemakers with Investments
In many families, investments are held in the name of multiple members. If one member has little or no taxable income, capital gains can sometimes be realized in their account to utilize the exemption limit.
Important Tax Rules Investors Should Know
While this strategy can reduce taxes, investors should understand the relevant tax provisions.
First, the exemption adjustment applies only if the individual's total income excluding capital gains is below the basic exemption limit.
Second, this rule is primarily applicable under the old tax regime. Taxpayers choosing the new tax regime should review the latest provisions carefully.
Third, proper documentation of transactions is essential. Investors must maintain records of purchase price, sale price, and holding period.
Regulatory bodies such as the Securities and Exchange Board of India emphasize transparency in market transactions, and accurate reporting of capital gains is important while filing income tax returns.
Impact on Investment Planning
Tax efficient strategies like this can influence how investors structure their portfolios.
For example, investors may plan the timing of stock sales to ensure gains fall within favorable tax limits.
Similarly, families may distribute investments across different members to make optimal use of exemption limits.
However, tax planning should always complement long term investment goals rather than drive them entirely.
Market fundamentals, company performance, and portfolio diversification should remain the primary focus.
Why Research and Technology Matter
Managing investments while keeping track of taxes, holding periods, and capital gains can become complex over time.
Modern investment platforms simplify this process through portfolio analytics and real time tracking.
Brokerage platforms such as Swastika Investmart, a SEBI registered brokerage firm, provide investors with advanced trading tools, research insights, and dedicated customer support.
Technology driven investing solutions help investors monitor portfolio performance while staying informed about regulatory and tax related developments.
Equally important is investor education. Understanding tax rules, market behavior, and risk management helps individuals make smarter financial decisions.
Common Mistakes Investors Should Avoid
Many investors unintentionally miss out on tax saving opportunities.
Some common mistakes include selling stocks without reviewing tax implications, ignoring exemption limits, and failing to plan transactions before the financial year ends.
Another frequent mistake is focusing entirely on taxes while ignoring the overall investment strategy.
A balanced approach that combines tax efficiency with long term wealth creation usually produces the best outcomes.
Frequently Asked Questions
What is the basic exemption limit in India?
The basic exemption limit is the portion of income that is not subject to income tax. For individuals under the old tax regime, it is generally ₹2.5 lakh for individuals below 60 years.
Can LTCG be adjusted against the basic exemption limit?
Yes. If a taxpayer's income excluding capital gains is below the basic exemption limit, the remaining portion can be adjusted against long term capital gains.
What is the current LTCG tax rate on equities?
Long term capital gains exceeding ₹1 lakh in a financial year are taxed at 10 percent without indexation.
Who benefits most from this tax saving strategy?
Retirees, students, homemakers, and individuals with low taxable income can benefit the most from using the basic exemption limit.
Is this strategy legal under Indian tax rules?
Yes. This method is fully compliant with the Income Tax Act when used correctly and reported properly in tax filings.
Conclusion
Tax planning plays an important role in maximizing investment returns. Understanding how to use the basic exemption limit to save LTCG tax can help investors reduce unnecessary tax payments while staying compliant with regulations.
For individuals with lower taxable income, this strategy can significantly improve after tax returns from equity investments.
However, tax planning should always be combined with disciplined investing, proper diversification, and long term financial goals.
If you want access to reliable research, powerful trading platforms, and investor education resources, you can start your investment journey with Swastika Investmart.

Tax-Efficient Investing: A Beginner's Guide
Tax Efficient Investing: A Beginner's Guide
Quick Summary
• Tax efficient investing helps investors keep more of their returns by reducing unnecessary tax liabilities.
• Understanding capital gains tax, holding periods, and tax saving instruments is essential for long term wealth creation.
• Investments like ELSS mutual funds, tax harvesting strategies, and long term holding can improve after tax returns.
• Regulatory rules from SEBI and tax provisions under the Income Tax Act influence investment decisions in India.
• Smart investors combine tax planning with disciplined investing and reliable research.
Tax Efficient Investing: A Beginner's Guide
Most investors focus on one thing when building wealth: returns. But there is another factor that quietly eats into profits if ignored. Taxes.
Imagine two investors who earn the same market return. One plans investments in a tax efficient way, while the other does not. Over time, the difference in their wealth can be significant simply because one investor kept more of the gains.
Tax efficient investing is not about avoiding taxes. Instead, it is about structuring investments so that legally applicable taxes are minimized while staying fully compliant with regulations.
For beginners in India, understanding this concept early can make a meaningful difference in long term wealth creation.
What Is Tax Efficient Investing?
Tax efficient investing refers to strategies that help investors reduce the tax impact on their investment returns.
Every investment generates income in some form. It could be capital gains from shares, dividends from stocks, or interest from bonds and fixed income products.
These earnings are subject to taxation under the Income Tax Act in India.
By selecting the right investment vehicles and holding periods, investors can improve their after tax returns.
A simple example illustrates this concept.
If an investor sells a stock within a year of buying it, the gain is treated as short term capital gain and taxed at a higher rate. But if the same stock is held for more than a year, the gain qualifies as long term capital gain and is taxed more favorably.
That small difference in holding strategy can significantly influence net returns.
Understanding Capital Gains Tax in India
One of the most important aspects of tax efficient investing is understanding how capital gains are taxed.
Short Term Capital Gains
If equity shares or equity mutual funds are sold within one year, the profit is classified as short term capital gain.
This gain is currently taxed at 15 percent, excluding surcharge and cess.
Frequent trading can therefore increase tax liability.
Long Term Capital Gains
If equity investments are held for more than one year, the profit becomes long term capital gain.
Currently, long term gains exceeding ₹1 lakh in a financial year are taxed at 10 percent without indexation.
For many investors, simply holding investments longer can significantly reduce taxes.
Tax Saving Investment Options in India
India offers several investment instruments that help investors reduce tax liability while building wealth.
Equity Linked Savings Scheme
Equity Linked Savings Schemes are among the most popular tax saving mutual funds.
They offer deductions under Section 80C of the Income Tax Act, allowing investors to claim up to ₹1.5 lakh in tax deductions annually.
ELSS funds also have the shortest lock in period among tax saving investments at three years.
Because these funds invest primarily in equities, they offer potential for long term wealth creation along with tax benefits.
Public Provident Fund
The Public Provident Fund is another widely used tax efficient investment.
Contributions qualify for deductions under Section 80C, and the interest earned is tax free. The maturity amount is also exempt from tax.
This makes it one of the few investments in India with EEE tax treatment, meaning exemption at investment, growth, and withdrawal stages.
National Pension System
The National Pension System is designed to support retirement planning while offering tax benefits.
Investors can claim deductions under Section 80C and an additional deduction under Section 80CCD(1B), which allows an extra ₹50,000 tax benefit.
For long term retirement investors, this combination can be quite powerful.
Tax Loss Harvesting: A Smart Strategy
Tax loss harvesting is a strategy where investors sell loss making investments to offset gains from profitable ones.
For example, suppose an investor earns ₹1.5 lakh in capital gains from stocks during the year but also holds another stock that is currently showing a loss of ₹50,000.
By selling the loss making stock before the financial year ends, the investor can offset part of the gain and reduce the taxable amount.
This strategy is commonly used by professional investors and portfolio managers to improve after tax performance.
How Tax Planning Influences the Indian Stock Market
Tax policies can influence investor behavior and market participation.
For instance, the introduction of long term capital gains tax in 2018 affected trading strategies for many equity investors.
Similarly, tax incentives for retirement products encourage long term savings in financial markets.
Regulators such as the Securities and Exchange Board of India focus on improving transparency and protecting investors while ensuring that markets remain efficient.
For investors, understanding these rules helps align investment strategies with regulatory frameworks.
The Role of Research and Technology in Tax Efficient Investing
Planning taxes effectively requires careful monitoring of portfolios, holding periods, and market opportunities.
Modern investment platforms simplify this process by providing portfolio analytics, tax insights, and research based recommendations.
Brokerage platforms such as Swastika Investmart provide investors with tools that help track investments, analyze market trends, and access professional research.
Being a SEBI registered brokerage, Swastika Investmart focuses on technology driven investing combined with strong customer support and investor education initiatives.
These resources help investors make informed decisions rather than reacting to market noise.
Common Mistakes Investors Should Avoid
Many beginners unintentionally increase their tax liability by ignoring simple strategies.
Some common mistakes include:
Frequent trading without considering tax impact.
Ignoring the benefits of long term holding.
Not utilizing deductions available under Section 80C.
Selling investments without planning capital gains offsets.
Avoiding these mistakes can significantly improve overall portfolio returns.
Frequently Asked Questions
What is tax efficient investing?
Tax efficient investing involves structuring investments to minimize tax liability while remaining compliant with tax regulations.
How are capital gains taxed on equities in India?
Short term capital gains on equities held for less than one year are taxed at 15 percent. Long term gains above ₹1 lakh are taxed at 10 percent.
What are the best tax saving investments in India?
Popular tax saving investments include ELSS mutual funds, Public Provident Fund, and the National Pension System.
What is tax loss harvesting?
Tax loss harvesting is a strategy where investors sell loss making investments to offset capital gains and reduce overall tax liability.
Why is tax planning important for investors?
Tax planning helps investors maximize after tax returns and avoid unnecessary tax payments.
Conclusion
Building wealth is not just about earning higher returns. It is also about keeping more of what you earn.
Tax efficient investing helps investors improve their after tax performance through smart strategies such as long term holding, tax saving investments, and capital gains planning.
In India’s evolving financial markets, understanding tax rules and investment structures can make a meaningful difference over time.
If you want access to research backed insights, advanced trading tools, and investor education resources, you can start your investment journey with Swastika Investmart.

From War Zones to Kitchen Cylinders: How Global Conflicts Affect Domestic LPG Availability
From War Zones to Kitchen Cylinders: How Global Conflicts Affect Domestic LPG Availability
Key Takeaways
• Global conflicts can disrupt LPG supply chains and increase international energy prices.
• India imports a large portion of its LPG requirement, making it sensitive to global energy shocks.
• Rising LPG costs can affect household budgets and inflation.
• Government policies and subsidies often play a key role in stabilizing domestic LPG prices.
• Investors should monitor energy trends as they influence inflation, markets, and economic stability.
From War Zones to Kitchen Cylinders: How Global Conflicts Affect Domestic LPG Availability
For most households in India, the kitchen gas cylinder is a routine necessity. Millions of families rely on LPG for cooking every day. Yet, few people realize how events thousands of kilometers away in conflict zones can influence the price and availability of the cylinder delivered to their homes.
Global energy markets are deeply interconnected. When geopolitical tensions rise in major oil and gas producing regions, the impact travels through supply chains, shipping routes, and commodity markets. Eventually, it reaches domestic energy supplies such as LPG.
Understanding this connection is important not only for consumers but also for investors and market watchers who want to track how global conflicts influence the Indian economy.
Why Global Conflicts Influence LPG Availability
Liquefied Petroleum Gas is largely produced as a byproduct of crude oil refining and natural gas processing. As a result, any disruption in oil and gas production or transportation can affect LPG supply.
When conflicts erupt in energy-rich regions such as the Middle East, markets react quickly. Oil prices often spike, shipping routes may become risky, and supply chains tighten.
Countries that rely heavily on energy imports, including India, feel the ripple effects.
India consumes more than 28 million tonnes of LPG annually, and a significant portion of this demand is met through imports. When global supply tightens, domestic prices and availability can come under pressure.
The Role of the Middle East in Global LPG Supply
The Middle East plays a central role in global LPG production and exports. Countries such as Saudi Arabia, Qatar, and the United Arab Emirates are among the largest suppliers of LPG to Asian markets.
Any instability in the region can create uncertainty in energy markets.
For example, tensions involving Iran, the United States, or Israel often raise concerns about the security of energy transport routes in the Persian Gulf. This is particularly important because a large share of global oil and gas shipments pass through the Strait of Hormuz.
Even the possibility of disruptions in this narrow maritime corridor can push up energy prices worldwide.
Higher crude prices often translate into higher LPG costs because both markets are closely linked.
How Higher LPG Prices Affect Indian Households
For millions of Indian households, LPG is an essential part of daily life. A rise in cylinder prices can quickly affect monthly household budgets.
Consider a typical middle-class family that consumes one LPG cylinder every month. If international energy prices rise and domestic LPG prices increase by even ₹50 to ₹100 per cylinder, the annual household expenditure rises noticeably.
For lower-income households, this impact can be even more significant.
Government schemes such as the Pradhan Mantri Ujjwala Yojana have expanded LPG access across rural India. While these programs improve clean cooking adoption, they also make price stability even more important for household affordability.
Government Policies That Stabilize LPG Supply
The Indian government actively intervenes in LPG pricing and distribution to protect consumers from sudden price shocks.
Public sector oil marketing companies such as Indian Oil Corporation, Bharat Petroleum, and Hindustan Petroleum manage most of the LPG distribution network in the country.
These companies import LPG, manage storage infrastructure, and distribute cylinders across India.
In times of global price volatility, the government may take several steps such as:
Subsidy Support
Targeted subsidies can help lower-income households manage rising cylinder costs.
Strategic Procurement
Oil marketing companies often diversify import sources to reduce dependence on a single region.
Price Adjustments
Sometimes the government absorbs part of the cost increase to maintain affordability.
These mechanisms help ensure that even during global energy shocks, LPG supply remains stable across the country.
Impact on Inflation and the Indian Economy
Energy prices have a direct influence on inflation. When LPG and fuel costs rise, household expenses increase and transportation costs go up.
This has a cascading effect across the economy.
Food distribution becomes more expensive, manufacturing costs rise, and service sectors also feel the pressure. As a result, inflation indicators such as the Consumer Price Index can move higher.
The Reserve Bank of India closely monitors energy prices while setting monetary policy. Persistent energy inflation may influence interest rate decisions and economic forecasts.
Market Impact: What Investors Should Watch
Energy shocks caused by global conflicts can also influence stock market trends.
Certain sectors tend to react strongly to changes in energy prices.
Oil marketing companies may experience margin pressure if international prices rise faster than domestic retail prices. Transportation and aviation sectors may also face cost increases.
On the other hand, upstream oil exploration companies may benefit from higher global energy prices.
Investors often track energy prices, global geopolitical developments, and government policy decisions to understand how markets may react.
Reliable research and timely insights become particularly valuable during such uncertain periods.
This is where research-driven platforms like Swastika Investmart can play a meaningful role. As a SEBI registered brokerage, Swastika Investmart provides investors with advanced trading tools, market insights, and dedicated support. The platform also focuses on investor education, helping individuals understand how macroeconomic events such as global conflicts can affect markets.
The Bigger Picture: Energy Security and India’s Future
Events like geopolitical conflicts remind policymakers about the importance of energy security.
India has been gradually expanding its energy strategy through measures such as:
• Diversifying energy import sources
• Expanding strategic petroleum reserves
• Increasing renewable energy capacity
• Promoting alternative fuels and clean energy
These initiatives aim to reduce dependence on volatile global energy markets in the long run.
However, in the short term, international developments will continue to influence domestic energy prices and supply chains.
For consumers, this means staying aware of global developments. For investors, it means understanding how macroeconomic events translate into market opportunities and risks.
Frequently Asked Questions
Why do global conflicts affect LPG prices in India?
India imports a significant portion of its LPG requirement. When global oil and gas prices rise due to geopolitical tensions, import costs increase, which can influence domestic LPG prices.
Does India produce its own LPG?
Yes, India produces LPG through domestic refineries and gas processing plants. However, domestic production is not enough to meet total demand, so imports are necessary.
How does the government control LPG prices?
The government uses subsidy programs, policy adjustments, and public sector oil marketing companies to manage LPG distribution and pricing.
Can global conflicts cause LPG shortages in India?
While supply disruptions are possible globally, India maintains diversified import sources and storage infrastructure to ensure consistent LPG availability.
How do energy price changes impact stock markets?
Energy price changes affect sectors differently. Companies dependent on fuel may face higher costs, while energy producers can benefit from rising prices.
Conclusion
The connection between global conflicts and the LPG cylinder in your kitchen may seem distant, but the link is very real. Energy markets are interconnected, and geopolitical tensions often ripple through global supply chains before reaching domestic consumers.
For India, which relies heavily on energy imports, monitoring global developments is essential for economic stability.
For investors, such developments offer valuable signals about inflation trends, sectoral shifts, and potential market opportunities.
If you want to navigate markets with better insights, reliable research, and powerful trading tools, consider opening an account with Swastika Investmart. With SEBI registration, strong customer support, and technology driven investing solutions, the platform helps investors stay informed in a rapidly changing global environment.

Could Oil Really Hit $200? How the Iran–US–Israel Conflict Is Shaking Global Energy Markets
Could Oil Really Hit $200? How the Iran–US–Israel Conflict Is Shaking Global Energy Markets
key Takeaways
• Rising geopolitical tensions in the Middle East are creating supply fears in global oil markets.
• Oil prices could spike sharply if the conflict disrupts key shipping routes like the Strait of Hormuz.
• India, which imports nearly 85% of its crude oil, is highly sensitive to such price shocks.
• Higher oil prices may increase inflation, pressure the rupee, and impact sectors like aviation, paints, and logistics.
• Investors should monitor energy trends and sectoral shifts closely during such geopolitical events.
Reliance Industries’ $300 Billion US Refinery Deal: Impact on Stock, Energy Markets and Investors
Reliance Industries has never been a company that thinks small. From building the world’s largest refining complex in Jamnagar to transforming India’s telecom industry with Jio, the conglomerate has repeatedly taken bold strategic bets.
Now, reports about a potential $300 billion refinery project in the United States have sparked widespread interest among investors and energy market participants. If the deal materializes, it could become one of the largest energy infrastructure investments ever attempted by an Indian company abroad.
For investors, the key question is simple. What does this move mean for Reliance Industries’ stock, global energy markets, and Indian investors?
Let’s break it down.
Understanding the Proposed US Refinery Deal
The proposed refinery investment reportedly involves developing a large scale refining and petrochemical complex in the United States. Such projects typically involve massive capital expenditure, advanced refining technology, and long term supply agreements.
Reliance Industries already operates the Jamnagar refinery complex in Gujarat, which is widely considered the largest refining hub in the world. This facility processes crude oil and exports petroleum products across multiple continents.
Expanding into the US could allow Reliance to:
• Access North American energy markets
• Strengthen global refining capabilities
• Diversify revenue streams beyond India
It also reflects a broader strategy of positioning Reliance as a global energy and petrochemical powerhouse.
Why the US Energy Market Matters
The United States remains one of the largest energy markets in the world. It also plays a critical role in global crude oil production and refining.
Investing in refining capacity within the US offers several advantages:
Access to Large Consumer Markets
North America has strong demand for refined petroleum products such as gasoline, diesel, and jet fuel. Establishing local refining capacity allows companies to serve these markets more efficiently.
Proximity to Crude Supply
The US has become one of the world’s largest crude producers, especially due to shale oil production. A refinery located closer to production hubs can benefit from lower transportation costs.
Export Opportunities
Refineries in the US often export refined products to Latin America and Europe. This could help Reliance expand its global trading footprint.
Potential Impact on Reliance Industries Stock
Whenever Reliance Industries announces a large investment plan, the market response tends to be immediate. Investors closely track whether the move enhances long term earnings potential.
Positive Market Signals
A large refinery project could strengthen Reliance’s leadership in the global energy sector. Investors may view this as a long term growth driver, particularly if the project delivers strong export revenues.
Reliance has historically demonstrated strong execution capabilities. The Jamnagar refinery is a prime example of how strategic investments can generate long term value.
Short Term Concerns
At the same time, a $300 billion investment raises questions about capital allocation and project timelines.
Large infrastructure projects typically require years of construction, regulatory approvals, and financing arrangements. Investors may initially react cautiously until more clarity emerges regarding funding structure and expected returns.
Impact on Global Energy Markets
If the project moves forward, it could influence refining dynamics worldwide.
Increased Refining Capacity
A large refinery in the US could increase global refining capacity. This may affect margins for refining companies across Asia, Europe, and North America.
Competitive Pressure
Major energy companies such as ExxonMobil, Chevron, and BP already operate extensive refining networks. Reliance entering the US refining landscape could intensify competition.
However, Reliance’s expertise in complex refining and petrochemicals could help it compete effectively in global markets.
What It Means for Indian Markets
Reliance Industries carries significant weight in India’s equity market. The company is among the largest constituents of benchmark indices such as the Nifty 50 and Sensex.
Because of this, any major development related to Reliance can influence overall market sentiment.
Index Impact
If investors interpret the deal as a strong long term growth opportunity, it could support Reliance’s stock performance and indirectly benefit benchmark indices.
Energy Sector Sentiment
The news also highlights India’s increasing role in global energy investments. This could improve investor perception toward Indian energy companies operating internationally.
Foreign Investment Narrative
Large overseas investments by Indian corporates demonstrate financial strength and strategic ambition. Such developments often attract global investor attention toward Indian markets.
Risks Investors Should Consider
Every large investment carries risks, and investors should evaluate them carefully.
Capital Intensity
Refinery projects require enormous upfront capital. Any delays or cost overruns could affect financial returns.
Energy Transition
Global energy markets are gradually shifting toward renewable sources. Over the long term, refining demand may face structural changes.
Regulatory Complexity
Energy infrastructure projects in the US must comply with multiple regulatory and environmental requirements, which can extend project timelines.
Despite these challenges, Reliance has shown the ability to manage complex industrial projects successfully.
Real World Context: Reliance’s Track Record
Reliance Industries has repeatedly demonstrated its ability to transform industries.
The company built the Jamnagar refinery complex, which processes over a million barrels of crude oil per day. It also disrupted the telecom market through Reliance Jio, which became one of the largest digital networks in India within a few years.
These examples show that Reliance is comfortable making large bets when it sees long term opportunity.
For investors, this track record often provides confidence that ambitious projects can eventually translate into shareholder value.
What Investors Should Watch Next
As more details emerge about the potential refinery project, investors should focus on several factors:
• Funding structure and partnerships
• Construction timeline and regulatory approvals
• Expected refining capacity and export markets
• Impact on Reliance’s balance sheet
Monitoring these factors will help investors assess whether the project strengthens Reliance’s long term earnings potential.
Frequently Asked Questions
What is Reliance Industries’ proposed US refinery deal?
The proposal involves building a large scale refining and petrochemical complex in the United States, potentially worth around $300 billion.
How could the deal impact Reliance stock?
If executed successfully, the project could strengthen Reliance’s global energy presence and support long term growth, although large capital investments may create short term market caution.
Why is the US attractive for refinery investments?
The US offers strong energy demand, proximity to crude oil production, and export opportunities to international markets.
Will this project affect Indian stock markets?
Reliance Industries has significant weight in major indices. Any major strategic development can influence overall market sentiment.
What risks should investors consider?
Key risks include high capital expenditure, regulatory approvals, project execution timelines, and long term changes in global energy demand.
Conclusion
The potential $300 billion US refinery project by Reliance Industries reflects the company’s ambition to expand its influence in global energy markets. While the scale of the investment is massive, Reliance’s history of executing large projects gives investors reason to watch developments closely.
For long term investors, the key lies in understanding how such strategic moves can shape the company’s future earnings and market position.
If you are an investor looking to track market opportunities and invest with confidence, platforms like Swastika Investmart provide SEBI registered services, advanced research tools, technology driven trading platforms, and strong investor support.
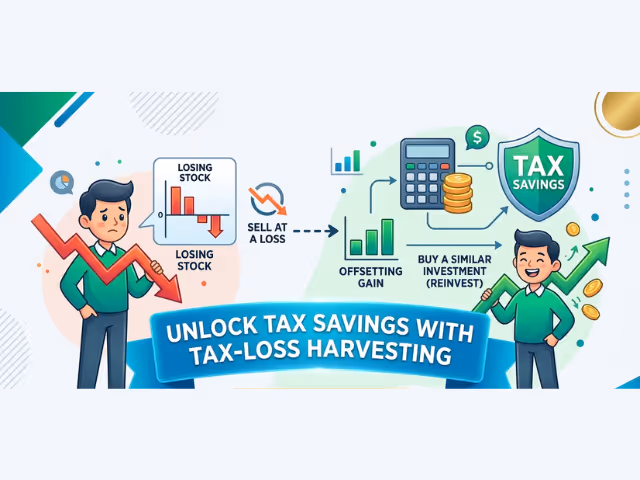
Tax Loss Harvesting Explained: How to Save on Capital Gains Legally
Summary
- Tax loss harvesting allows investors to offset capital gains by selling underperforming assets.
- It helps reduce taxable income legally, improving overall portfolio efficiency.
- Applicable to stocks, mutual funds, and ETFs, with rules guided by Indian tax laws.
- Swastika Investmart offers research-backed tools to implement these strategies effectively.
- Regular monitoring and planning are key to maximizing tax benefits without harming long-term growth.
Tax Loss Harvesting Explained: How to Save on Capital Gains Legally
Investing in the stock market or mutual funds often brings profits—but also tax implications. For Indian investors, capital gains tax can eat into returns if not managed smartly. One powerful yet underutilized strategy is tax loss harvesting. Let’s explore how it works, its benefits, and how platforms like Swastika Investmart can help you implement it efficiently.
What is Tax Loss Harvesting?
Tax loss harvesting is the practice of selling financial assets, such as stocks or mutual funds, that have declined in value to realize a loss. This loss can then be used to offset capital gains from other profitable investments. Essentially, you are converting paper losses into tax savings, all within the legal framework provided by the Income Tax Act of India.
For example, suppose you bought 100 shares of a stock at ₹1,500 each, and the current market price drops to ₹1,200. Selling these shares would lock in a ₹30,000 loss (100 x ₹300). This loss can then offset gains made elsewhere in your portfolio, reducing your taxable capital gains.
How Tax Loss Harvesting Works in India
In India, capital gains are categorized into short-term and long-term:
- Short-Term Capital Gains (STCG): Profits on assets held for less than 12 months (for stocks and equity funds) taxed at 15%.
- Long-Term Capital Gains (LTCG): Profits on assets held for more than 12 months, taxed at 10% for gains exceeding ₹1 lakh.
By strategically realizing losses, investors can reduce the taxable amount, ensuring they pay only what is legally required.
Real-World Example
Consider an investor, Ramesh, who has the following portfolio:
- Stock A: Gain of ₹50,000
- Stock B: Loss of ₹20,000
- Mutual Fund C: Gain of ₹30,000
Ramesh can sell Stock B to realize the ₹20,000 loss, which offsets part of the gains from Stock A and Mutual Fund C. His net taxable gain becomes ₹60,000 instead of ₹80,000, effectively saving on taxes.
Platforms like Swastika Investmart allow investors to track such opportunities seamlessly using their research tools and portfolio analytics, helping make informed decisions without compromising long-term growth.
Benefits of Tax Loss Harvesting
- Legal Tax Reduction: Directly reduces taxable capital gains.
- Portfolio Rebalancing: Opportunity to adjust holdings without extra cost.
- Cash Flow Management: Lower taxes can free up funds for reinvestment.
- Risk Management: Allows trimming underperforming assets strategically.
Important Considerations
While tax loss harvesting is beneficial, investors must follow certain Indian regulatory guidelines:
- Avoid “wash sale” scenarios: Selling and repurchasing the same security within a short period may not yield tax benefits.
- Maintain long-term investment objectives: Realizing losses should not compromise future gains.
- Keep accurate records: The Income Tax Department may request documentation.
How Swastika Investmart Can Help
Swastika Investmart, a SEBI-registered broker, offers tools and guidance to optimize tax loss harvesting strategies:
- Research-backed insights to identify underperforming assets.
- Advanced portfolio tracking to calculate potential tax-saving opportunities.
- Tech-enabled investing with minimal hassle for busy investors.
- Customer support and education to help understand tax and investment implications.
By integrating these features, Swastika Investmart ensures investors maximize tax efficiency without compromising portfolio health.
Frequently Asked Questions
1. Can tax loss harvesting be applied to mutual funds in India?
Yes, both equity and debt mutual funds are eligible for tax loss harvesting, following short-term and long-term capital gains rules.
2. How often should I practice tax loss harvesting?
Ideally, review your portfolio annually or during major market corrections to identify potential losses to realize.
3. Will selling assets for tax benefits impact my long-term growth?
If done strategically, tax loss harvesting can reduce taxes without significantly affecting long-term returns. Planning and re-investment are key.
4. Is tax loss harvesting legal in India?
Absolutely. It is a completely legal strategy governed by the Income Tax Act, provided guidelines such as avoiding wash sales are followed.
5. Can I offset short-term and long-term gains differently?
Yes, losses can first offset gains of the same type (short-term against short-term, long-term against long-term) and any remaining losses can be carried forward for up to 8 years.
Conclusion
Tax loss harvesting is a smart, legal, and strategic tool for reducing capital gains tax in India. By carefully planning and executing this strategy, investors can improve portfolio efficiency and retain more wealth. Platforms like Swastika Investmart make it easy with SEBI-registered safety, strong research tools, and tech-enabled portfolio management.
Start leveraging tax-efficient investing today by opening an account with Swastika Investmart:

LTCG vs STCG on Stocks in India: Tax Rules Every Investor Should Know
Key Takeaways
• Short term capital gains on stocks are taxed at 15 percent if shares are sold within one year.
• Long term capital gains above ₹1 lakh are taxed at 10 percent when stocks are held for more than one year.
• Proper tax planning can significantly improve long term investment returns.
• Understanding LTCG and STCG rules is essential for equity investors in India.
LTCG vs STCG on Stocks in India: Tax Rules Every Investor Should Know
For many investors, the focus while investing in stocks is usually on returns. But taxation plays an equally important role in determining how much profit you actually keep. In India, capital gains from stocks are classified into two categories. These are short term capital gains (STCG) and long term capital gains (LTCG).
Understanding the difference between LTCG vs STCG on stocks in India can help investors plan their trades more efficiently and avoid surprises during tax filing.
Let’s break down how these tax rules work and what they mean for investors.
Understanding Capital Gains in Stock Market Investments
Whenever you sell a stock for a price higher than your purchase cost, the profit you earn is called a capital gain. The tax treatment of that gain depends mainly on the holding period of the stock.
If the stock is sold within one year of purchase, it falls under short term capital gains. If the holding period exceeds one year, the gain is considered long term.
These tax rules apply to equity shares listed on recognized stock exchanges in India where Securities Transaction Tax has been paid.
What Is Short Term Capital Gain on Stocks
Short term capital gains arise when equity shares are sold within twelve months from the purchase date.
STCG Tax Rate in India
Under Section 111A of the Income Tax Act, short term capital gains on listed equities are taxed at 15 percent plus applicable surcharge and cess.
Example of STCG Tax
Suppose an investor buys shares of a company worth ₹2 lakh and sells them after six months for ₹2.5 lakh.
Profit earned: ₹50,000
Tax at 15 percent: ₹7,500
This tax is payable irrespective of the investor’s income tax slab.
Short term trading strategies such as swing trading or momentum trading often fall under this category.
What Is Long Term Capital Gain on Stocks
Long term capital gains arise when listed equity shares are held for more than one year before selling.
LTCG Tax Rate in India
Long term capital gains on equities are taxed at 10 percent without indexation, but only on gains exceeding ₹1 lakh in a financial year.
Example of LTCG Tax
Imagine an investor purchases shares worth ₹3 lakh and sells them after two years for ₹5 lakh.
Total profit: ₹2 lakh
Exemption limit: ₹1 lakh
Taxable gain: ₹1 lakh
Tax payable at 10 percent: ₹10,000
This tax rule was introduced in the Union Budget 2018, replacing the earlier exemption on long term capital gains.
Key Differences Between LTCG and STCG
Holding Period
Short term capital gains apply when stocks are sold within one year. Long term capital gains apply when stocks are held for more than one year.
Tax Rate
STCG is taxed at 15 percent, while LTCG is taxed at 10 percent on gains exceeding ₹1 lakh.
Tax Planning Advantage
Long term investors enjoy a tax exemption on the first ₹1 lakh of gains each financial year, making long term investing more tax efficient.
Why the Government Introduced LTCG Tax
Before 2018, long term gains on listed equities were completely tax free in India. However, the government introduced LTCG tax to ensure fair taxation and increase revenue from financial markets.
Despite this change, equities remain one of the most tax efficient investment options compared to several other asset classes.
For example, real estate gains can attract tax rates up to 20 percent with indexation benefits, while fixed deposits are taxed according to the investor’s income slab.
How Taxes Influence Investment Strategies
Understanding LTCG vs STCG on stocks in India can influence how investors structure their portfolios.
Long Term Investors
Investors who follow a buy and hold strategy often benefit from LTCG tax rules because they can take advantage of the ₹1 lakh exemption each year.
Active Traders
Short term traders frequently incur STCG tax on profits. While the tax rate is fixed at 15 percent, frequent trading can increase the overall tax burden.
Portfolio Rebalancing
Many investors plan their portfolio rebalancing after completing the one year holding period to reduce tax liability.
Real World Example from the Indian Market
Consider two investors who buy shares of a large company listed on the NSE.
Investor A sells the stock after eight months and earns a ₹1 lakh profit. Since the holding period is less than a year, the profit is taxed as STCG at 15 percent.
Investor B holds the same stock for eighteen months and earns a ₹1.2 lakh profit. After applying the ₹1 lakh LTCG exemption, only ₹20,000 is taxable at 10 percent.
The difference in tax treatment significantly affects net returns.
Regulatory Framework in India
Capital gains taxation on stocks falls under the Income Tax Act, while trading activities in the equity market are regulated by the Securities and Exchange Board of India (SEBI).
Stock exchanges such as the NSE and BSE ensure that securities transaction tax is collected during trades, which is a requirement for the applicable LTCG and STCG tax rules.
Understanding these regulatory aspects helps investors remain compliant and plan their investments efficiently.
Impact on the Indian Stock Market
Tax rules can influence investor behavior in financial markets.
Lower taxes on long term holdings encourage investors to remain invested for longer periods. This promotes stability in equity markets and reduces excessive speculation.
At the same time, a moderate STCG tax rate keeps active trading viable for market participants.
Overall, the balance between LTCG and STCG taxation supports both long term investment and market liquidity.
Tips for Managing Capital Gains Taxes
Investors can follow a few practical strategies to manage tax liability effectively.
Plan selling decisions carefully based on holding period.
Utilize the ₹1 lakh LTCG exemption every financial year.
Maintain proper records of purchase price and transaction statements.
Consult a tax advisor if you trade frequently or have multiple income sources.
A well planned approach can improve net investment returns over time.
Frequently Asked Questions
What is the difference between LTCG and STCG on stocks in India
Short term capital gains arise when stocks are sold within one year, while long term capital gains apply when stocks are held for more than one year.
What is the STCG tax rate on equities in India
Short term capital gains on listed equity shares are taxed at 15 percent under Section 111A of the Income Tax Act.
What is the LTCG tax rate on stocks
Long term capital gains above ₹1 lakh are taxed at 10 percent without indexation.
Is LTCG tax applicable on all stock market gains
LTCG tax applies only when gains exceed ₹1 lakh in a financial year on listed equities where securities transaction tax has been paid.
Do investors need to pay tax on losses in stock trading
No tax is payable on losses. However, capital losses can be carried forward and set off against future gains as per income tax rules.
Conclusion
Understanding LTCG vs STCG on stocks in India is essential for every investor who participates in the equity market. Taxes may seem like a small detail at first, but they can significantly influence overall investment returns.
By planning holding periods carefully and using available tax exemptions, investors can optimize their strategies and keep more of their profits.
If you want to invest in stocks with access to reliable research, advanced trading platforms, and investor education support, Swastika Investmart offers a SEBI registered platform designed to help investors make smarter financial decisions.

IndiGo CEO Pieter Elbers Resigns: Leadership Change and What It Means for the Airline’s Future
Key Takeaways
• IndiGo CEO Pieter Elbers has resigned, marking a major leadership transition at India’s largest airline.
• Leadership changes often trigger investor attention because strategy and expansion plans may evolve.
• IndiGo remains a dominant player in India’s fast growing aviation market.
• The transition could influence the airline’s growth strategy, fleet expansion, and international ambitions.
.avif)
IndiGo CEO Pieter Elbers Resigns: Leadership Change and What It Means for the Airline’s Future
Leadership transitions in large companies rarely go unnoticed. When the company in question is IndiGo, India’s largest airline by market share, the impact extends beyond the corporate boardroom and into financial markets.
The resignation of IndiGo CEO Pieter Elbers has sparked discussions among investors, aviation analysts, and market participants. While leadership changes are common in corporate life, they often signal the beginning of a new strategic phase.
For investors, the key question is straightforward. What does this change mean for IndiGo’s growth trajectory, the aviation sector, and the company’s stock performance?
Let’s examine the broader implications.
IndiGo’s Journey to Market Leadership
IndiGo has grown into one of the most successful aviation stories in India. Since its launch in 2006, the airline has built a reputation for operational efficiency, cost discipline, and punctual service.
Today, IndiGo commands over 60 percent of India’s domestic aviation market, making it the clear leader in the sector.
The airline’s business model focuses on:
• Low cost operations
• High aircraft utilization
• A strong domestic network
• Expanding international routes
This approach has helped IndiGo remain profitable in an industry known for volatile margins and high operating costs.
Who Is Pieter Elbers?
Pieter Elbers joined IndiGo as CEO after a long career with the Dutch airline KLM. His appointment brought global aviation experience to the Indian carrier.
During his tenure, IndiGo accelerated its international expansion plans and strengthened partnerships with global airlines.
Key developments during his leadership included:
• Expanding international routes across Asia and the Middle East
• Strengthening fleet expansion strategies
• Enhancing operational efficiency
His resignation therefore raises questions about the future leadership direction.
Why Leadership Changes Matter for Airlines
In the aviation industry, leadership decisions directly influence operational strategy and long term investments.
Airlines operate in a complex environment involving fuel price fluctuations, regulatory oversight, aircraft procurement, and global competition.
A new CEO may introduce changes in areas such as:
Network Strategy
The airline may reconsider its expansion plans for international destinations or domestic connectivity.
Fleet Expansion
Aircraft orders represent massive capital investments. Leadership changes can alter fleet planning priorities.
Strategic Partnerships
Airlines often collaborate with international carriers through codeshare agreements and alliances.
Because of these factors, investors often monitor leadership transitions closely.
Impact on IndiGo Stock
For shareholders, leadership change can initially create uncertainty. However, the long term effect depends on the strategic direction taken by the company.
Short Term Market Reaction
Stock markets typically respond quickly to major corporate announcements. Leadership transitions sometimes trigger short term volatility as investors assess potential changes in strategy.
Long Term Outlook
IndiGo’s strong market position, large fleet, and brand reputation provide a solid foundation. The company continues to benefit from India’s rapidly growing aviation market.
India is expected to become one of the largest aviation markets globally over the next decade.
This structural growth trend supports long term demand for airlines.
India’s Aviation Sector Is Expanding Rapidly
India’s aviation industry has experienced remarkable growth in recent years.
Rising disposable incomes, improved connectivity, and expanding airport infrastructure have driven passenger traffic.
Government initiatives such as UDAN (Ude Desh ka Aam Nagrik) aim to improve regional connectivity and make air travel more accessible.
The Directorate General of Civil Aviation regulates the sector and ensures safety and operational compliance.
As air travel demand grows, airlines are expanding fleets and routes to capture new opportunities.
Competitive Landscape
While IndiGo dominates the market, it faces competition from other carriers.
Key competitors include:
Air India
SpiceJet
Akasa Air
Vistara
Each airline follows a different strategy, ranging from full service international operations to low cost domestic models.
IndiGo’s strength lies in its operational efficiency and large network, which helps it maintain a leading position.
Challenges Facing the Airline Industry
Despite strong growth prospects, airlines face several challenges.
Fuel Costs
Aviation turbine fuel is one of the largest cost components for airlines. Price volatility can significantly impact profitability.
Currency Fluctuations
Aircraft leasing and maintenance expenses are often denominated in US dollars, making airlines sensitive to currency movements.
Infrastructure Constraints
Airports in major Indian cities are sometimes operating near capacity, which can affect scheduling and expansion plans.
Leadership decisions play a key role in navigating these challenges effectively.
Real World Example of Leadership Impact
History shows that leadership transitions can reshape airline strategies.
For example, several global airlines introduced aggressive expansion or restructuring programs after leadership changes.
Sometimes these changes unlock new growth opportunities. In other cases, companies focus on operational consolidation.
For IndiGo, the next leadership phase could determine how the airline approaches international expansion and fleet growth.
What Investors Should Watch Next
Investors should monitor several developments following the CEO resignation.
• Appointment of the new leadership team
• Strategic direction for international expansion
• Fleet acquisition plans
• Operational performance and profitability
These factors will help determine how IndiGo evolves in the coming years.
Frequently Asked Questions
Why did IndiGo CEO Pieter Elbers resign?
While leadership changes can occur for various reasons, the resignation marks a transition period for the airline as it prepares for its next phase of growth.
How important is IndiGo in India’s aviation industry?
IndiGo is India’s largest airline by market share and plays a major role in domestic and international connectivity.
Will the leadership change affect IndiGo stock?
Leadership transitions can create short term market volatility, but long term performance depends on strategy and operational execution.
Who regulates airlines in India?
The Directorate General of Civil Aviation oversees aviation safety, operations, and regulatory compliance in India.
What are the biggest challenges for airlines?
Airlines face challenges such as high fuel costs, currency fluctuations, intense competition, and infrastructure limitations.
Conclusion
The resignation of IndiGo CEO Pieter Elbers marks a significant moment for India’s aviation sector. Leadership transitions often bring new strategic perspectives that shape a company’s future direction.
Despite short term uncertainty, IndiGo remains a dominant force in India’s rapidly expanding aviation market. Investors will now focus on how the airline’s next leadership team approaches growth, competition, and operational efficiency.
For investors looking to track such market developments and make informed decisions, Swastika Investmart offers a SEBI registered platform with advanced research tools, technology driven trading systems, strong customer support, and investor education resources.

Mazagon Dock Becomes the Only Shipyard with Navratna Status: What It Means for India’s Defence Shipbuilding Sector
Key Takeaways
• Mazagon Dock Shipbuilders has received Navratna status, becoming the only Indian shipyard with this recognition.
• The status gives greater financial autonomy to take strategic investment decisions.
• It strengthens India’s defence manufacturing ecosystem under the Make in India initiative.
• Investors see the move as a long term positive for defence shipbuilding and related stocks.
Mazagon Dock Becomes the Only Shipyard with Navratna Status: What It Means for India’s Defence Shipbuilding Sector
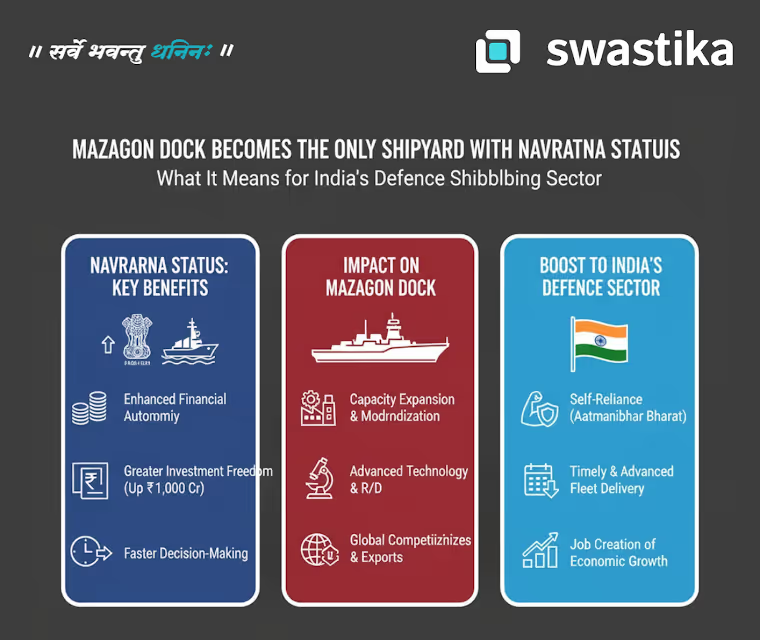
India’s defence manufacturing ecosystem has been evolving rapidly over the past decade. With rising geopolitical uncertainties and the government’s strong push for self reliance in defence production, domestic shipyards are playing a crucial role.
In a significant development, Mazagon Dock Shipbuilders Limited (MDL) has been granted Navratna status, making it the only shipyard in India to receive this prestigious classification among public sector enterprises.
For investors and industry observers, this announcement goes beyond symbolism. Navratna status can reshape Mazagon Dock’s strategic flexibility, strengthen the defence shipbuilding ecosystem, and potentially influence the outlook for defence stocks in India.
What Navratna Status Means for a Public Sector Company
Navratna status is awarded by the Government of India to high performing public sector enterprises that demonstrate strong financial performance and operational efficiency.
Companies with this designation receive greater autonomy in business decisions compared with regular central public sector enterprises.
Key Powers Under Navratna Status
Navratna companies can:
• Invest up to ₹1,000 crore or 15 percent of net worth in a single project without government approval
• Form joint ventures and strategic partnerships more easily
• Enter international markets and acquisitions with greater flexibility
This autonomy allows companies to act faster in competitive industries where quick investment decisions matter.
For a defence shipbuilder like Mazagon Dock, this flexibility can be especially valuable.
About Mazagon Dock Shipbuilders
Mazagon Dock Shipbuilders Limited is one of India’s leading defence public sector undertakings engaged in building warships and submarines for the Indian Navy.
Headquartered in Mumbai, the company has decades of experience in complex naval platforms, including destroyers, frigates, and submarines.
Key Projects
Mazagon Dock has delivered several critical naval programs, including:
• Scorpene class submarines under Project 75
• Visakhapatnam class stealth destroyers under Project 15B
• Nilgiri class stealth frigates under Project 17A
These projects highlight the company’s technological capability in high value defence manufacturing.
Why Navratna Status Matters for the Defence Shipbuilding Sector
The elevation of Mazagon Dock to Navratna status comes at a time when India is aggressively pushing for defence self reliance.
The government’s Atmanirbhar Bharat initiative aims to reduce dependence on defence imports and promote domestic production.
Faster Project Execution
With greater financial autonomy, Mazagon Dock can approve investments more quickly. This could accelerate shipbuilding programs and infrastructure expansion.
Global Partnerships
Navratna status allows easier collaboration with international defence companies for technology transfer and joint ventures.
For example, submarine construction often requires advanced technology partnerships with global defence firms.
Boost to Domestic Shipbuilding Ecosystem
A stronger Mazagon Dock could create opportunities for suppliers, engineering companies, and defence component manufacturers across India.
Impact on Mazagon Dock Stock
Whenever a public sector enterprise receives a higher status classification, investors often view it as a sign of strong operational performance.
Mazagon Dock has already been one of the standout performers among defence stocks in recent years.
Positive Market Sentiment
Navratna recognition reinforces investor confidence in the company’s financial strength and long term growth potential.
Strong Order Book
Mazagon Dock typically operates with a large order backlog from the Indian Navy. This provides strong revenue visibility for several years.
Strategic Importance
Defence shipbuilding is a strategic sector where government support is likely to remain strong.
Because of these factors, investors often consider companies like Mazagon Dock as long term plays on India’s defence modernization.
India’s Growing Defence Shipbuilding Opportunity
India is currently among the world’s largest defence importers, but the government is actively working to increase domestic manufacturing.
Several initiatives support this transition:
• Defence procurement policies prioritizing local production
• Production Linked Incentive programs for manufacturing
• Restrictions on importing certain defence equipment
In naval modernization, the Indian Navy has ambitious plans to expand its fleet of submarines, destroyers, and aircraft carriers.
This creates long term opportunities for domestic shipbuilders.
Competitive Landscape
While Mazagon Dock is a key player, other Indian shipyards are also involved in defence shipbuilding.
Notable participants include:
Garden Reach Shipbuilders and Engineers
Cochin Shipyard Limited
Hindustan Shipyard Limited
Each company focuses on specific types of vessels and projects. However, Mazagon Dock’s submarine expertise gives it a unique strategic position within India’s defence manufacturing ecosystem.
What Investors Should Watch
Although Navratna status is positive, investors should track several factors going forward.
Order Book Expansion
New defence contracts will play a major role in sustaining long term growth.
Execution Timelines
Large shipbuilding projects often span several years. Timely delivery is critical for maintaining profitability.
Export Opportunities
India is increasingly promoting defence exports. If Mazagon Dock secures international contracts, it could unlock additional revenue streams.
Real World Example of Navratna Impact
Several other public sector enterprises that received Navratna status earlier have expanded aggressively.
For example, companies in sectors such as power and engineering used the autonomy to invest in new projects and expand globally.
Mazagon Dock could follow a similar path by strengthening its shipbuilding infrastructure and exploring overseas defence collaborations.
Frequently Asked Questions
What is Navratna status in India?
Navratna status is a classification given by the Government of India to high performing public sector enterprises that meet specific financial and operational criteria.
Why is Mazagon Dock’s Navratna status significant?
Mazagon Dock becomes the only shipyard with Navratna recognition, giving it greater financial autonomy and strategic flexibility in defence shipbuilding.
How could this affect Mazagon Dock stock?
The status could improve investor sentiment by reinforcing the company’s strong operational track record and growth potential in defence manufacturing.
What role does Mazagon Dock play in India’s defence sector?
Mazagon Dock builds advanced naval platforms such as submarines, destroyers, and stealth frigates for the Indian Navy.
How does this development support India’s defence manufacturing goals?
The move strengthens domestic defence capabilities and aligns with the government’s Make in India and Atmanirbhar Bharat initiatives.
Conclusion
Mazagon Dock receiving Navratna status marks an important milestone for India’s defence shipbuilding sector. The recognition highlights the company’s strong operational capabilities and strategic importance in supporting the Indian Navy.
With greater financial autonomy and the government’s continued push for defence self reliance, Mazagon Dock could play an even bigger role in India’s maritime defence ecosystem.
For investors, developments in defence manufacturing present interesting opportunities, especially as India continues to expand its domestic defence industry.
If you want to stay ahead of such market opportunities, Swastika Investmart offers a SEBI registered platform with advanced research tools, technology driven trading systems, strong customer support, and investor education resources.

Reliance Industries’ $300 Billion US Refinery Deal: Impact on Stock, Energy Markets & Investors
Reliance Industries’ $300 Billion US Refinery Deal: Impact on Stock, Energy Markets and Investors
Key Takeaways
• Reliance Industries is reportedly exploring a massive $300 billion refinery project in the United States.
• The deal could strengthen Reliance’s position in global energy and refining markets.
• Investors are watching closely as the project may influence Reliance stock valuation and long term strategy.
• The move reflects Reliance’s ambition to expand beyond India and capture global energy demand.
Reliance Industries’ $300 Billion US Refinery Deal: Impact on Stock, Energy Markets and Investors
Reliance Industries has never been a company that thinks small. From building the world’s largest refining complex in Jamnagar to transforming India’s telecom industry with Jio, the conglomerate has repeatedly taken bold strategic bets.
Now, reports about a potential $300 billion refinery project in the United States have sparked widespread interest among investors and energy market participants. If the deal materializes, it could become one of the largest energy infrastructure investments ever attempted by an Indian company abroad.
For investors, the key question is simple. What does this move mean for Reliance Industries’ stock, global energy markets, and Indian investors?
Let’s break it down.
Understanding the Proposed US Refinery Deal
The proposed refinery investment reportedly involves developing a large scale refining and petrochemical complex in the United States. Such projects typically involve massive capital expenditure, advanced refining technology, and long term supply agreements.
Reliance Industries already operates the Jamnagar refinery complex in Gujarat, which is widely considered the largest refining hub in the world. This facility processes crude oil and exports petroleum products across multiple continents.
Expanding into the US could allow Reliance to:
• Access North American energy markets
• Strengthen global refining capabilities
• Diversify revenue streams beyond India
It also reflects a broader strategy of positioning Reliance as a global energy and petrochemical powerhouse.
Why the US Energy Market Matters
The United States remains one of the largest energy markets in the world. It also plays a critical role in global crude oil production and refining.
Investing in refining capacity within the US offers several advantages:
Access to Large Consumer Markets
North America has strong demand for refined petroleum products such as gasoline, diesel, and jet fuel. Establishing local refining capacity allows companies to serve these markets more efficiently.
Proximity to Crude Supply
The US has become one of the world’s largest crude producers, especially due to shale oil production. A refinery located closer to production hubs can benefit from lower transportation costs.
Export Opportunities
Refineries in the US often export refined products to Latin America and Europe. This could help Reliance expand its global trading footprint.
Potential Impact on Reliance Industries Stock
Whenever Reliance Industries announces a large investment plan, the market response tends to be immediate. Investors closely track whether the move enhances long term earnings potential.
Positive Market Signals
A large refinery project could strengthen Reliance’s leadership in the global energy sector. Investors may view this as a long term growth driver, particularly if the project delivers strong export revenues.
Reliance has historically demonstrated strong execution capabilities. The Jamnagar refinery is a prime example of how strategic investments can generate long term value.
Short Term Concerns
At the same time, a $300 billion investment raises questions about capital allocation and project timelines.
Large infrastructure projects typically require years of construction, regulatory approvals, and financing arrangements. Investors may initially react cautiously until more clarity emerges regarding funding structure and expected returns.
Impact on Global Energy Markets
If the project moves forward, it could influence refining dynamics worldwide.
Increased Refining Capacity
A large refinery in the US could increase global refining capacity. This may affect margins for refining companies across Asia, Europe, and North America.
Competitive Pressure
Major energy companies such as ExxonMobil, Chevron, and BP already operate extensive refining networks. Reliance entering the US refining landscape could intensify competition.
However, Reliance’s expertise in complex refining and petrochemicals could help it compete effectively in global markets.
What It Means for Indian Markets
Reliance Industries carries significant weight in India’s equity market. The company is among the largest constituents of benchmark indices such as the Nifty 50 and Sensex.
Because of this, any major development related to Reliance can influence overall market sentiment.
Index Impact
If investors interpret the deal as a strong long term growth opportunity, it could support Reliance’s stock performance and indirectly benefit benchmark indices.
Energy Sector Sentiment
The news also highlights India’s increasing role in global energy investments. This could improve investor perception toward Indian energy companies operating internationally.
Foreign Investment Narrative
Large overseas investments by Indian corporates demonstrate financial strength and strategic ambition. Such developments often attract global investor attention toward Indian markets.
Risks Investors Should Consider
Every large investment carries risks, and investors should evaluate them carefully.
Capital Intensity
Refinery projects require enormous upfront capital. Any delays or cost overruns could affect financial returns.
Energy Transition
Global energy markets are gradually shifting toward renewable sources. Over the long term, refining demand may face structural changes.
Regulatory Complexity
Energy infrastructure projects in the US must comply with multiple regulatory and environmental requirements, which can extend project timelines.
Despite these challenges, Reliance has shown the ability to manage complex industrial projects successfully.
Real World Context: Reliance’s Track Record
Reliance Industries has repeatedly demonstrated its ability to transform industries.
The company built the Jamnagar refinery complex, which processes over a million barrels of crude oil per day. It also disrupted the telecom market through Reliance Jio, which became one of the largest digital networks in India within a few years.
These examples show that Reliance is comfortable making large bets when it sees long term opportunity.
For investors, this track record often provides confidence that ambitious projects can eventually translate into shareholder value.
What Investors Should Watch Next
As more details emerge about the potential refinery project, investors should focus on several factors:
• Funding structure and partnerships
• Construction timeline and regulatory approvals
• Expected refining capacity and export markets
• Impact on Reliance’s balance sheet
Monitoring these factors will help investors assess whether the project strengthens Reliance’s long term earnings potential.
Frequently Asked Questions
What is Reliance Industries’ proposed US refinery deal?
The proposal involves building a large scale refining and petrochemical complex in the United States, potentially worth around $300 billion.
How could the deal impact Reliance stock?
If executed successfully, the project could strengthen Reliance’s global energy presence and support long term growth, although large capital investments may create short term market caution.
Why is the US attractive for refinery investments?
The US offers strong energy demand, proximity to crude oil production, and export opportunities to international markets.
Will this project affect Indian stock markets?
Reliance Industries has significant weight in major indices. Any major strategic development can influence overall market sentiment.
What risks should investors consider?
Key risks include high capital expenditure, regulatory approvals, project execution timelines, and long term changes in global energy demand.
Conclusion
The potential $300 billion US refinery project by Reliance Industries reflects the company’s ambition to expand its influence in global energy markets. While the scale of the investment is massive, Reliance’s history of executing large projects gives investors reason to watch developments closely.
For long term investors, the key lies in understanding how such strategic moves can shape the company’s future earnings and market position.
If you are an investor looking to track market opportunities and invest with confidence, platforms like Swastika Investmart provide SEBI registered services, advanced research tools, technology driven trading platforms, and strong investor support.

Innovision IPO Review: Everything Investors Need to Know Before Applying
Innovision IPO Review: Everything Investors Need to Know Before Applying
Every few weeks, a new IPO lands on the radar and investors scramble to figure out if it's worth their money or just another listing day gamble. The Innovision IPO is one that's been generating quiet buzz in Mainboard market circles — and for good reason. Whether you're a seasoned IPO investor or someone who's just getting the hang of how primary markets work, this review will walk you through what matters before you hit that apply button.
Let's break it down properly.
Quick Summary
- Innovision Limited operates in manpower services, toll plaza management, and skill development across India.
- The IPO price band is ₹521–₹548 with a market lot of 27 shares.
- Revenue has grown strongly from ₹257 crore in FY23 to nearly ₹896 crore in FY25.
- Margins remain thin in a manpower intensive business, which raises valuation concerns.
- Investors should evaluate growth prospects carefully before applying to the Innovision IPO.
Innovision IPO Review: Everything Investors Need to Know Before Applying
India’s IPO market has remained active with companies from diverse sectors tapping public markets for growth capital. The Innovision IPO is one such offering that has attracted attention due to its rapid revenue growth and diversified service portfolio.
Innovision Limited operates in manpower services, toll plaza management, and skill development training. While the company has shown strong financial growth in recent years, investors need to weigh its valuation and business model before subscribing.
In this Innovision IPO review, we break down the company’s business model, financials, risks, and overall outlook to help investors make an informed decision.
Innovision IPO Details
The Innovision IPO aims to raise funds primarily to reduce debt and support working capital needs.
Key IPO Information
Issue Open Date: March 10, 2026
Issue Close Date: March 12, 2026
Price Band: ₹521 to ₹548 per share
Lot Size: 27 shares
Face Value: ₹10 per share
Listing: BSE and NSE
Expected Listing Date: March 17, 2026
The IPO consists primarily of a fresh issue, and the funds will be used for:
• Repayment or prepayment of borrowings
• Funding working capital requirements
• General corporate purposes
These objectives suggest the company intends to strengthen its balance sheet and support operational expansion.
About Innovision Limited
Innovision Limited started as a security service provider and gradually evolved into a diversified manpower and operational services company.
Today, the company operates across 23 states and 5 union territories in India, providing workforce solutions and operational management services to various sectors.
Key Business Segments
Manpower Services
Innovision deploys trained workforce for facility management, security services, and other operational roles for enterprises.
Toll Plaza Management
The company manages toll plaza operations under contracts, particularly linked with national highway infrastructure.
Skill Development Training
Innovision also offers training programs through partnerships with government bodies to develop skilled workforce for industries.
This multi segment approach allows the company to diversify revenue streams and tap into India's expanding infrastructure and services ecosystem.
Financial Performance
Innovision has delivered strong revenue growth over the past three years.
Revenue Growth
FY23 Revenue: ₹257.62 crore
FY24 Revenue: ₹512.13 crore
FY25 Revenue: ₹895.95 crore
This growth reflects increasing demand for outsourced manpower and operational services across India.
Profitability
FY23 Net Profit: ₹8.88 crore
FY24 Net Profit: ₹10.27 crore
FY25 Net Profit: ₹29.02 crore
The company’s Return on Net Worth (RoNW) stands at about 35.45 percent, which is significantly higher than many companies in similar service sectors.
However, the EBITDA margin is around 5.78 percent, highlighting the thin margin nature of manpower and facility management businesses.
Competitive Landscape
Innovision competes with companies offering facility management and manpower outsourcing services.
Some listed peers in adjacent segments include:
Krystal Integrated Services
Updater Services
SIS Limited
Quess Corp
Highway Infrastructure
While these companies operate in similar spaces, Innovision’s niche lies in combining manpower deployment, toll management, and skill development.
Still, many competitors have larger scale and deeper client relationships, which investors should consider when evaluating long term prospects.
Key Strengths of Innovision
Diversified Services
The company generates revenue from multiple verticals including manpower services, toll operations, and training programs.
Strong Government Partnerships
Innovision works with organizations such as NSDC, MoRD, and NCVT, which adds credibility to its skill development initiatives.
Wide Geographic Presence
Operating across most parts of India allows the company to tap into multiple infrastructure and services opportunities.
Large Workforce Pool
Having access to a trained workforce enables the company to quickly deploy manpower for large contracts.
Risks Investors Should Consider
Dependence on Toll Contracts
A significant portion of revenue in the toll management segment depends on contracts with infrastructure authorities like NHAI.
Thin Margins
With EBITDA margins around 5 to 6 percent, the business has limited room for profitability shocks.
High Employee Attrition
Manpower intensive businesses often face high employee turnover, which increases recruitment and training costs.
Regulatory Compliance
Delays in statutory filings or compliance could attract penalties or operational disruptions.
Innovision IPO Valuation
At the upper price band, the company is valued at around 35.69 times its pre IPO earnings.
While the high RoNW of over 35 percent indicates efficient capital use, the valuation already factors in strong growth expectations.
For investors, this means the company will need to continue improving margins and expanding its service portfolio to justify the premium.
Impact on the Indian Market
India’s infrastructure and outsourcing ecosystem has been growing rapidly due to government investments in highways, logistics, and urban development.
Companies offering manpower services, facility management, and operational outsourcing are expected to benefit from:
• Increased infrastructure projects
• Rising corporate outsourcing trends
• Government skill development initiatives
Innovision operates directly in these segments, which could provide long term growth opportunities if executed efficiently.
Should You Apply for the Innovision IPO?
Innovision offers exposure to India’s growing manpower and infrastructure services sector. The company has shown impressive revenue growth and maintains a strong return on net worth.
However, investors must consider the thin margins and relatively high valuation before making a decision.
For risk tolerant investors with a long term view on outsourcing and infrastructure services, the IPO may offer growth potential. Conservative investors may prefer to track the company’s margin performance after listing.
Frequently Asked Questions
What does Innovision Limited do?
Innovision provides manpower services, toll plaza management, and skill development training across India.
What is the price band for the Innovision IPO?
The IPO price band is ₹521 to ₹548 per share.
When will Innovision shares list on the stock exchange?
The expected listing date is March 17, 2026 on BSE and NSE.
What are the key risks in the Innovision IPO?
Major risks include thin operating margins, dependence on toll management contracts, and manpower intensive operations.
How has Innovision performed financially?
The company’s revenue grew from about ₹258 crore in FY23 to nearly ₹896 crore in FY25, while net profit reached ₹29 crore in FY25.
Conclusion
The Innovision IPO presents an interesting opportunity in the manpower and infrastructure services segment. The company has demonstrated strong revenue growth and operates across multiple service verticals.
At the same time, investors should carefully assess the valuation and operational risks before applying.
For investors looking to participate in IPO opportunities and access research driven insights, Swastika Investmart offers a strong platform with SEBI registered services, advanced research tools, reliable customer support, and technology driven investing solutions.

.avif)
.avif)

.avif)