


Google News RSS: A Smarter Tool For Retail Investors


Key Takeaways
- Google News RSS helps filter headlines into signals for retail investors
- Set up feeds to watch Indian markets and your watchlist
- Combine headlines with price data to form a simple playbook
- Avoid overreacting to every headline; rely on a disciplined framework
Markets move on headlines, and headlines move markets–fast. In a world where traders glom onto every flash of a news feed, google news rss has emerged as a quiet backbone for retail investors who want speed without chaos. This guide explains what google news rss is, how to set it up for Indian markets, and how to turn feeds into disciplined investment ideas instead of reactionary bets. By mixing news with price awareness and a simple framework, you can reduce noise and keep focus on the drivers behind stock moves. For deeper, institutional-level analysis, explore Swastika's Sarthi AI stock assistant: Swastika's Sarthi AI stock assistant
Google News RSS As A Tool For Retail Investor Research
Google News RSS collects headlines across millions of outlets and delivers a digest that captures themes rather than single headlines. For Indian markets, this means you can skim coverage on sectors you follow, spot recurring themes, and quickly gauge what the market is paying attention to. The real power is context: a single headline rarely tells the full story, but a stream of related headlines can highlight trends that deserve a closer look. You can google a stock price or alphabet stock price to see how news translated into moves, and you should also check google market update to stay aware of the broader macro backdrop. Remember, headlines are signals, not orders.
Setting Up News Feeds For Indian Markets And Your Stock Watchlist
To begin, search for a version of google news rss tailored to Indian markets and add the feed to an RSS reader such as Feedly or Inoreader. Create separate folders for sectors you monitor, your watchlist, and key macro themes. Set alert thresholds within your reader so that only headlines with relevance prompt a deeper look. For Indian markets, pair headlines with live price quotes by checking google a stock price or alphabet stock price to verify the market's response to the story.
Bringing News To Your Chart Analysis: Ways To Combine Headlines With Price Action
Headlines can preface a chart setup. For example, a policy update or regulatory development can coincide with a price move that confirms a thesis if the price breaks resistance or shows momentum consistent with the news theme. The goal is to align thematic signals with price momentum by watching for patterns across days and weeks. A simple method is to track a thesis built from a handful of headlines and verify whether the stock's price follows the expected path. You can also use google market update to gauge the broader market mood and its influence on the stock in question.
Cautionary Tales: Common Pitfalls When Relying On News For Trading
News feeds can be sensational and prone to noise. A single headline does not determine a trend, and crowd psychology can push prices beyond fundamentals in the short run. Credibility matters: cross-check with multiple outlets, avoid over-interpreting headlines, and respect risk controls. Always test a headline-driven idea against price action and fundamentals, and be prepared to cut losses if the thesis fails. In short, treat news as a data point, not a decision-maker, and use it to refine your thesis rather than replace it.
Frequently Asked Questions
What is Google News RSS and how can it help retail investors?
Google News RSS is a feed that aggregates headlines from multiple outlets, allowing you to monitor themes and topics across sectors. For retail investors, it helps you catch context and identify trends without visiting dozens of sites.
How do I set up Google News RSS for Indian market news?
Search for an Indian-market focused Google News RSS feed, copy the RSS URL, and add it to your preferred RSS reader (e.g., Feedly or Inoreader). Create folders for your watchlist and themes to stay organized.
Can Google News RSS help me time my trades?
News feeds provide context but are not a standalone timing tool. Use them to refine your investment thesis and corroborate signals with price action, fundamentals, and risk controls.
What is Swastika's Sarthi AI stock assistant and how does it complement Google News RSS?
Swastika's Sarthi AI stock assistant analyzes stock-level catalysts, fundamentals, momentum, and risk to turn headlines into actionable research. It complements Google News RSS by adding AI-driven depth to ideas generated from headlines.
What are the risks of relying on news feeds for investing?
News feeds can be sensational and noisy. They should be used as one input among many—paired with price data, fundamentals, and a disciplined framework to avoid knee-jerk trading.
Conclusion
Take action today by setting up a 15-minute daily review and experiment with one or two ideas per week; this small habit can compound into better investment judgment over time.
Open your trading and demat account here
Reference :
1 : Google
Latest Articles
Google News RSS: A Smarter Tool For Retail Investors


Key Takeaways
- Google News RSS helps filter headlines into signals for retail investors
- Set up feeds to watch Indian markets and your watchlist
- Combine headlines with price data to form a simple playbook
- Avoid overreacting to every headline; rely on a disciplined framework
Markets move on headlines, and headlines move markets–fast. In a world where traders glom onto every flash of a news feed, google news rss has emerged as a quiet backbone for retail investors who want speed without chaos. This guide explains what google news rss is, how to set it up for Indian markets, and how to turn feeds into disciplined investment ideas instead of reactionary bets. By mixing news with price awareness and a simple framework, you can reduce noise and keep focus on the drivers behind stock moves. For deeper, institutional-level analysis, explore Swastika's Sarthi AI stock assistant: Swastika's Sarthi AI stock assistant
Google News RSS As A Tool For Retail Investor Research
Google News RSS collects headlines across millions of outlets and delivers a digest that captures themes rather than single headlines. For Indian markets, this means you can skim coverage on sectors you follow, spot recurring themes, and quickly gauge what the market is paying attention to. The real power is context: a single headline rarely tells the full story, but a stream of related headlines can highlight trends that deserve a closer look. You can google a stock price or alphabet stock price to see how news translated into moves, and you should also check google market update to stay aware of the broader macro backdrop. Remember, headlines are signals, not orders.
Setting Up News Feeds For Indian Markets And Your Stock Watchlist
To begin, search for a version of google news rss tailored to Indian markets and add the feed to an RSS reader such as Feedly or Inoreader. Create separate folders for sectors you monitor, your watchlist, and key macro themes. Set alert thresholds within your reader so that only headlines with relevance prompt a deeper look. For Indian markets, pair headlines with live price quotes by checking google a stock price or alphabet stock price to verify the market's response to the story.
Bringing News To Your Chart Analysis: Ways To Combine Headlines With Price Action
Headlines can preface a chart setup. For example, a policy update or regulatory development can coincide with a price move that confirms a thesis if the price breaks resistance or shows momentum consistent with the news theme. The goal is to align thematic signals with price momentum by watching for patterns across days and weeks. A simple method is to track a thesis built from a handful of headlines and verify whether the stock's price follows the expected path. You can also use google market update to gauge the broader market mood and its influence on the stock in question.
Cautionary Tales: Common Pitfalls When Relying On News For Trading
News feeds can be sensational and prone to noise. A single headline does not determine a trend, and crowd psychology can push prices beyond fundamentals in the short run. Credibility matters: cross-check with multiple outlets, avoid over-interpreting headlines, and respect risk controls. Always test a headline-driven idea against price action and fundamentals, and be prepared to cut losses if the thesis fails. In short, treat news as a data point, not a decision-maker, and use it to refine your thesis rather than replace it.
Frequently Asked Questions
What is Google News RSS and how can it help retail investors?
Google News RSS is a feed that aggregates headlines from multiple outlets, allowing you to monitor themes and topics across sectors. For retail investors, it helps you catch context and identify trends without visiting dozens of sites.
How do I set up Google News RSS for Indian market news?
Search for an Indian-market focused Google News RSS feed, copy the RSS URL, and add it to your preferred RSS reader (e.g., Feedly or Inoreader). Create folders for your watchlist and themes to stay organized.
Can Google News RSS help me time my trades?
News feeds provide context but are not a standalone timing tool. Use them to refine your investment thesis and corroborate signals with price action, fundamentals, and risk controls.
What is Swastika's Sarthi AI stock assistant and how does it complement Google News RSS?
Swastika's Sarthi AI stock assistant analyzes stock-level catalysts, fundamentals, momentum, and risk to turn headlines into actionable research. It complements Google News RSS by adding AI-driven depth to ideas generated from headlines.
What are the risks of relying on news feeds for investing?
News feeds can be sensational and noisy. They should be used as one input among many—paired with price data, fundamentals, and a disciplined framework to avoid knee-jerk trading.
Conclusion
Take action today by setting up a 15-minute daily review and experiment with one or two ideas per week; this small habit can compound into better investment judgment over time.
Open your trading and demat account here
Reference :
1 : Google
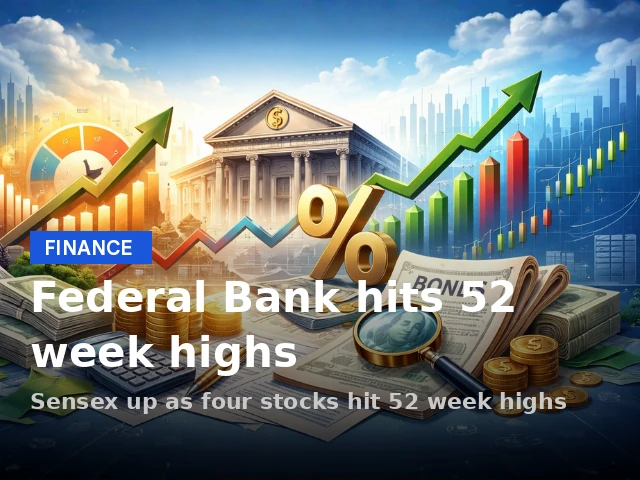
Federal Bank Share Price Momentum: Four 52-Week Highs Spark A Monthly Rally
Key Takeaways
- Four BSE 200 stocks hit fresh 52-week highs, led by the federal bank share price.
- Oracle Financial Services stock surged roughly 25% in the last month.
- Adani Energy Solutions stock gained about 15%; Bharat Heavy Electricals stock price rose 10%; Federal Bank stock price rose 8%.
- Sensex moved 96 points on Friday as momentum broadened across the market.
Investors tracking the federal bank share price have a reason to watch the market closely today: four stocks from the BSE 200 hit fresh 52-week highs, delivering up to 25% gains in the last month. On Friday, the Sensex ended 96 points higher at 78,151, while the broader market posted a modest gain. The surge underscores a broadening appetite for momentum plays in a liquidity-friendly environment, where traders scan macro signals and company-specific catalysts to identify entries and exits in a shifting market.
From a price-action perspective, the four notable movers are oracle financial services stock, adani energy solutions stock, bharat heavy electricals stock price, and federal bank stock price. Here is a snapshot of the latest intraday highs and current prices to anchor the discussion. It’s important to treat these figures as price data reflecting market activity at the time of reporting, rather than a static forecast of future performance. The 52-week highs indicate the upper end of recent price ranges, while the CMP shows where the stock trades today, which can be a guide for momentum trades and risk management alike.
| Stock | New 52-Week High (Rs) | CMP (Rs) | 1-Month Gain |
|---|---|---|---|
| oracle financial services stock | Rs 11986.9 | Rs 11809 | About 25% |
| adani energy solutions stock | Rs 1757.55 | Rs 1722 | About 15% |
| bharat heavy electricals stock price | Rs 446.75 | Rs 421.9 | About 10% |
| federal bank stock price | Rs 351 | Rs 348.8 | About 8% |
These four stocks are part of the BSE 200 index constellation that saw fresh highs, suggesting a momentum tilt rather than a broad-based collapse in risk appetite. In the same session, the Sensex’s modest gain points to a market that remains receptive to quality earnings and constructive macro cues. Traders should note that while 52-week highs can signal strength, they also warrant disciplined risk controls, especially in markets where volatility can re-emerge on evolving rates, liquidity shifts, or sector rotations.
For investors who want to go beyond headlines, Swastika’s Swastika's Sarthi AI stock assistant can help synthesize institutional-grade insights on the four movers and on other indices or stocks you’re watching. A practical approach is to build a watchlist around price breakouts, relative strength, and risk-reward, rather than chasing momentum alone. The next sections unpack what these moves mean from a retail-investor standpoint and how to implement a balanced, data-driven strategy.
Federal Bank Share Price Momentum After Fresh 52-Week Highs
The federal bank share price has joined a select set of names that touched new 52-week highs within the last month. This momentum reflects a combination of improving macro sentiment, positive earnings signals across some financials, and a broader appetite for winners in index-heavy benchmarks. The recent 52-week high of Rs 351 for the federal bank stock price sets a high-water mark that traders will monitor for potential pullbacks or continuation signals. A price near or above this high can attract fresh buying interest from traders who employ breakout strategies, but it also increases the risk of a pullback if the market’s flow shifts or if short-term catalysts fade. Retail investors should pair any price advance with a clear plan for stop-loss placement and position sizing to manage downside risk while the trend remains intact.
Beyond a single stock move, the federal bank share price movement must be understood within the sectoral context: financials have shown resilience in various pockets of the market, and any sustained upside might require corroboration from earnings, asset quality trends, and funding-cost dynamics. A cautious way to engage is to blend core exposure with hedges or with diversification across complementary sectors. For an investor seeking deeper clarity on how this specific momentum dovetails with your risk tolerance and time horizon, consider a data-driven check on exposure limits and a readiness to exit if price-action shows signs of weakness or if volatility spikes.
Oracle Financial Services Stock Momentum And The 25% Monthly Gain
The oracle financial services stock has been a standout within the four-stock cluster, delivering an approximate 25% gain over the last month. A new 52-week high of Rs 11986.9 signals renewed demand for this large-cap IT-enabled services provider’s financial-technology oriented offerings and its ability to align with evolving banking and insurance tech needs. For a retail investor, this momentum should be weighed against valuation levels, earnings visibility, and competitive positioning within the financial services technology segment. Price strength can be a proxy for relative optimism, but it should be corroborated with fundamentals and a clear exit plan if momentum wanes or if market breadth narrows.
Investors should track how the stock sustains price above the newly touched 52-week high and whether volume confirms the move. An approach that blends trend-following with risk controls tends to fare well in momentum environments, where quick reversals can occur on shifting liquidity or unexpected macro updates. If you’re using a systematic framework, consider using a trailing stop or a time-based rule to avoid staying in a momentum trade longer than warranted by price-action signals.
Adani Energy Solutions Stock Rally And Its 15% Monthly Surge
The adani energy solutions stock has mirrored a broader rally in energy and utility plays, rising about 15% over the last month and hitting a new 52-week high of Rs 1757.55. The move suggests investors are pricing in continued improvement in energy demand, project execution, and perhaps better-than-expected utility margins. Retail investors should weigh this momentum against the company’s leverage, project risk, and regulatory exposure. A disciplined approach is to monitor key catalysts such as contract wins, tariff changes, and capital expenditure cycles, and to keep exposure in line with overall portfolio risk budgets.
In practical terms, momentum stocks in the energy space can occasionally show sharp pullbacks if appetite shifts or if project timelines slip. A robust risk plan could involve diversification across renewable energy plays and conventional energy exposure, along with setting predefined profit targets and stop-loss levels to maintain capital discipline while participating in the upside.
Bharat Heavy Electricals Stock Price Movement And The 10% Monthly Gain
bharat heavy electricals stock price, after pushing to a fresh 52-week high of Rs 446.75, has posted roughly a 10% gain in the last month. This stock’s move can reflect a blend of order traction, domestic infrastructure spending, and supplier-management improvements that typically accompany a cyclical industrial complex. As with any cyclical name, retail investors should assess the balance between order-book visibility and commodity/energy input costs, which can influence margins. A systematic approach could include watching for confirmations of demand resilience, monitoring the stock’s price relative to its 52-week high, and evaluating whether the move translates into sustainable earnings improvement over the next two to four quarters.
Given the stock’s location on the cusp of a long-term uptrend, some investors might consider tiered exposure–entering on pullbacks or consolidations that show a favorable risk-reward profile, while avoiding the temptation to chase a parabolic run into unknown resistance levels. In all cases, align positions with your risk budget and time horizon, and use price-informed exits as the trend evolves.
Sensex Movement And The Four 52-Week Highs: The Broader Market Context
The Sensex’s 96-point rise to 78,151 on that Friday provides a crucial market backdrop for these momentum plays. A moving market, coupled with a handful of fresh 52-week highs, often creates a scenario where liquidity and risk appetite are supportive for a broader set of equities. For the individual investor, it is essential not to over-interpret a single trading day; instead, watch how the breadth of participation evolves across sectors and whether the strength extends beyond a handful of names to a more diversified set of stocks.
When the broader market breadth improves, it can help sustain rallies in stocks that recently posted new highs. Conversely, if the market conditions shift–due to macro surprises, policy shifts, or liquidity constraints–the same momentum stocks can experience quicker reversals. A practical approach is to couple watchlists for momentum with a separate, fundamentals-driven list that can anchor long-term returns. The aim is to avoid getting trapped in a rally that lacks a solid foundation and to maintain a disciplined rebalancing strategy that respects capital preservation rules.
What Retail Investors Should Watch: A Practical, Risk-Managed Playbook
For a retail investor, the current setup–new 52-week highs among a cluster of stocks and a mild Sensex upmove–offers an opportunity to build a disciplined watchlist rather than a speculative chase. The four movers show how momentum can coexist with fundamental signals in a market where liquidity is a key driver. Your plan could include the following steps: First, identify a baseline of stocks with rising prices and confirm their uptrends with technical indicators such as moving averages and momentum oscillators. Second, assess the quality of the corporate narrative: earnings growth, margins, and balance-sheet health, especially when price action pushes to new highs. Third, align exposures with your risk limits and use defined stop-loss levels to cap downside while maintaining the potential for upside if the trend continues. Finally, incorporate a decision framework that accounts for both price action and fundamentals, so you don’t rely on momentum alone to drive investment choices.
Frequently Asked Questions
Which stocks hit fresh 52-week highs in the latest move?
Oracle Financial Services Software, Adani Energy Solutions stock, Bharat Heavy Electricals stock price, and Federal Bank stock price hit fresh 52-week highs.
What are the new 52-week highs and current prices for the four movers?
Oracle Financial Services Software — new 52-week high Rs 11986.9; CMP Rs 11809. Adani Energy Solutions stock — new 52-week high Rs 1757.55; CMP Rs 1722. Bharat Heavy Electricals stock price — new 52-week high Rs 446.75; CMP Rs 421.9. Federal Bank stock price — new 52-week high Rs 351; CMP Rs 348.8.
What were the one-month gains for these stocks?
Oracle Financial Services stock gained about 25% in the last month. Adani Energy Solutions stock gained about 15%. Bharat Heavy Electricals stock price gained about 10%. Federal Bank stock price gained about 8%.
What was the Sensex movement on the day these highs were recorded?
The Sensex ended 96 points higher at 78,151 on that Friday.
How should retail investors act on this momentum data?
Retail investors should use momentum moves as a signal to refine watchlists, apply risk controls, and consider a balanced approach that combines price action with fundamentals. Using a stock research tool like Swastika's Sarthi AI stock assistant can provide deeper, institution-level insights to support decision-making.
Conclusion
In a market that has seen four BSE 200 names reach fresh 52-week highs in a single month, the takeaway for retail investors is not to chase headlines but to refine entry points, risk controls, and time horizons. The federal bank share price, along with the four movers, signals a moment when momentum and fundamentals may coexist, yet prudence remains essential. A practical approach is to build a structured watchlist, assess risk-reward on pullbacks, and use a systematic exit plan if the trend loses conviction.
Open your trading and demat account here
Reference :
1 : Economictimes

Millworks Technologies IPO: Oversubscription Signals For Retail Investors And Beyond
Key Takeaways
- millworks technologies ipo subscriptions reached 219.54x on Day 3, powered by NIIs and retail demand.
- The ₹160.34 crore IPO was priced at ₹315-₹331 with 4,92,473 total applications and 30,94,800 shares on offer.
- Day-wise data shows growing appetite: Day 1 at 10.74x, Day 2 at 50.57x, culminating in Day 3's record levels.
- Retail investors can evaluate bids and use Swastika's Sarthi AI stock assistant for deeper insights.
Millworks Technologies IPO: What The Oversubscription Signals For Retail Investors
The 219.54x overall subscription on Day 3, led by exceptionally strong demand from Non-Institutional Investors (NIIs) and retail participants, underscores robust investor appetite for SME IPOs with aerospace-grade manufacturing capabilities. On Day 3, the QIB Ex-Anchor portion stood at 194.05x, while NIIs subscribed at 260.37x and Retail at 216.60x, culminating in a total of 219.54x. The day’s activity highlights a mix of big-HNI bids and broad retail participation, signaling confidence in Millworks’ niche and order book strength. These figures are drawn from the official IPO subscription data through Day 3.
| Category | Subscription (x) | Notes |
|---|---|---|
| QIB Ex-Anchor | 194.05x | Significant anchor interest |
| NII | 260.37x | Very strong non-institutional demand |
| Retail | 216.60x | Retail participation robust |
| Total | 219.54x | Overall demand |
How Day-Wise Subscription Trends Shaped Millworks Technologies IPO Outlook
Looking at the daily cadence helps separate hype from sustainable interest. On Day 1 (July 14, 2026), the overall subscription was 10.74x, with Retail at 15.75x and NIIs at 13.38x; the sNII at 13.98x and Ex-Anchor participants at 0.00x, indicating early enthusiasm but a cautionary start as demand built.
Day 2 (July 15, 2026) saw a dramatic acceleration, with the overall subscription rising to 50.57x. Retail led the charge at 71.73x, while NIIs subscribed at 68.32x; separate categories for bNII and sNII hit 73.13x and 58.69x respectively, signaling intensifying big-HNI conviction and broad retail participation as the issue moved toward closure.
By Day 3, subscriptions skyrocketed to 219.54x, with QIB Ex-Anchor at 194.05x, NIIs at 260.37x, and Retail at 216.60x, reflecting a multi-layer demand structure and a close to full engagement by all investor classes. The date of Day 3 closing was July 16, 2026, underscoring the cumulative enthusiasm for this aerospace-focused SME IPO.
Bid Patterns And Allocation: What It Signals For Millworks Technologies IPO
The multi-day escalation in demand is indicative of investor confidence in the company’s Build-to-Print (BTP) and Build-to-Spec (BTS) models, as well as the company’s AS9100D certification. The strong NIIs activity and elevated retail interest suggest an appetite for niche manufacturing players with potential global reach. For bidders, this pattern can translate into competitive allocation dynamics and possible listing-day volatility, so it is prudent to approach bids with clear price discipline and risk controls.
Pricing Strategy And The Build-To-Print Advantage: Millworks' Niche In Aerospace And Drones
Price band: ₹315 to ₹331 per share. The ₹160.34 crore book-built SME issue comprises 30,94,800 shares on offer. The total demand exceeded supply by a wide margin: 67,94,40,800 bids versus 30,94,800 shares on offer and 4,92,473 total applications. Millworks leverages Build-to-Print (BTP) and Build-to-Spec (BTS) to serve OEMs and Tier-1/Tier-2 suppliers across India and international markets, including North America, Europe, the Middle East and South Asia. The company’s AS9100D certification reinforces its emphasis on quality in aerospace and defence segments, where precision and reliability govern long-term contracts and aftermarket demand.
What Retail Investors Should Do Next With Millworks Technologies IPO
Retail investors should stay mindful of the price band, subscription dynamics, and the company’s niche market positioning before bidding. The strong Day 3 data suggests robust interest but does not guarantee favourable listing-day performance. A practical approach is to set a disciplined bid range aligned with your risk tolerance and investment horizon, and to use independent research tools to compare Millworks with peers in aerospace-grade precision manufacturing. For deeper stock insights, consider Swastika's Sarthi AI stock assistant.
Frequently Asked Questions
What Is Millworks Technologies IPO?
The Millworks Technologies IPO is a ₹160.34 crore book-built SME issue priced at ₹315-₹331 per share, with 30,94,800 shares on offer and a total of 4,92,473 applications.
How Did The Subscriptions Evolve Across Days?
On Day 1, the overall subscription stood at 10.74x; Day 2 rose to 50.57x; Day 3 closed at 219.54x, with QIB Ex-Anchor at 194.05x, NIIs at 260.37x, and Retail at 216.60x.
What Is Millworks Technologies IPO's Business Model?
Millworks operates on Build-to-Print (BTP) and Build-to-Spec (BTS) models, manufacturing high-precision machined components, sheet metal parts, sub-assemblies and integrated assemblies for aerospace, defence, railways, semiconductors, drones and instrumentation.
What Should Retail Investors Watch For Post-IPO?
Key considerations include the price band, issue size, market reach, and demand patterns across categories; investors should also factor certification (AS9100D) and customers across India, North America, Europe, the Middle East and South Asia.
Where Can Investors Get More Insights?
For independent stock research assistance, consult Swastika's Sarthi AI stock assistant.
Conclusion
Millworks Technologies IPO illustrates how oversubscription can reflect multi-layer investor conviction in a niche, high-precision manufacturing player. For retail investors, this means recognizing the opportunity while applying discipline, risk controls, and a clear thesis about the company’s Build-to-Print and Build-to-Spec strengths in aerospace, defence, railways and related sectors. The next step is to translate the story into a personal investment framework that accounts for pricing, allocation dynamics, and long-term growth potential.
As always, use reliable research assistance to validate assumptions and calibrate entry points. For a tailored, AI-assisted stock view that helps you compare Millworks with peers and build a robust bid strategy, click here to access Swastika's Sarthi AI stock assistant.
Open your trading and demat account here
Reference :
1 : 5Paisa
Alphabet Share Price: A Practical Guide For Indian Retail Investors
Key Takeaways
- Alphabet share price movements hinge on ad revenue and cloud momentum.
- Regulatory risk and macro trends add to the mix.
- Price charts help identify entry points while managing risk.
- Explore deeper insights with Swastika's Sarthi AI stock assistant.
Alphabet Share Price Drivers: What Moves The Alphabet Stock Price Today
Alphabet, the parent company of Google, moves on a mix of ad revenue momentum, cloud growth, and regulatory dynamics. Alphabet share price movements reflect more than a ripple on the screen; they are a real-time barometer of how investors view the company's ability to monetize its dominant search platform while expanding in cloud and AI. The alphabet share price is heavily influenced by ad revenue growth; when advertisers spend more, Alphabet's top line grows, and investors respond with higher valuations. You will notice that the market pays a premium for continued YouTube monetization gains, progress in Google Cloud margins, and the pace at which AI investments translate into new products and profitable units. Governance and regulatory risk add a persistent tilt; when privacy rules tighten or antitrust concerns intensify, the alphabet stock price tends to re-rate to reflect higher uncertainty. Macro indicators such as global growth, inflation, and interest-rate expectations change how investors price future cash flows for Alphabet; in a growth stock, multiples ebb and flow with the risk appetite of markets. To track the latest rhythm of Alphabet share price, watch multiple channels and focus on fundamentals: revenue quality, margin expansion, and the durability of market leadership. For reference, some callers also monitor google share price to gauge tech sector momentum across markets.
Alphabet Price Chart: Reading Trends, Signals, And Patterns
Price charts are more than lines; they are the market's diary. The alphabet price chart helps investors identify the direction of the trend and the momentum behind moves in Alphabet's stock price. A sustained uptrend often accompanies when ad revenue growth remains robust and cloud profitability improves, while a sudden reversal may signal profit-taking or concerns about AI costs. Traders watch moving averages and look for crossovers to confirm shifts; the 50-day and 200-day lines act as important reference points for support and resistance. RSI and MACD momentum indicators can highlight overbought conditions where a pullback could be healthy, or oversold conditions that suggest a bounce. Remember that short-term spikes can be noise; anchor your interpretation in earnings guidance and product roadmaps rather than one-off headlines. When you examine alphabet price chart, you may also compare with google a stock price or google share price across markets to calibrate your reading, but the core story remains Alphabet's fundamentals and guidance.
Alphabet Share Price Outlook: What Analysts Are Saying And Why It Matters
Analysts are watching Alphabet's revenue mix and capital allocation decisions; the outlook for alphabet share price depends on how quickly Google Services revenue can expand, how cloud margins improve, and how AI investments translate into product-led growth. The narrative around Alphabet Stock Price is that the fundamentals remain robust even as regulatory risk persists. If ad demand holds and cloud profitability expands, the alphabet share price could re-rate on optimism about AI-enabled monetization, while weaker ad spend or regulatory-cost headwinds could temper upside. The opinions converge on a baseline scenario in which Alphabet stays a market leader with a diversified revenue base, albeit with heightened policy risk that could test investor conviction. The key for retail investors is to separate the long-term growth thesis from short-term noise; use a structured plan rather than chasing every headline about Alphabet stock price and policy developments.
Alphabet Valuation And Investment Strategy For Indian Retail Investors
Valuation for Alphabet is anchored in growth prospects across advertising, cloud, and AI-related businesses; a multi-factor approach helps avoid overreliance on a single metric. For Indian retail investors, a practical approach includes a long-term horizon, regular portfolio rebalancing, and a disciplined risk framework. Consider allocating a portion of your equity sleeve to high-quality technology exposures, including Alphabet, while maintaining diversification across sectors and geographies. Use sensible position sizing and stop-loss discipline to manage downside risk, and avoid chasing highs after flashy headlines. If you want deeper research and a structured test of ideas, Swastika's Sarthi AI stock assistant can help create scenario-driven analysis for Alphabet and peers, enabling you to test assumptions across revenue scenarios and competitive dynamics.
Alphabet Stock News And Market Narratives: Interpreting Headlines Without Panic
News headlines around Alphabet stock price and the companys AI bets can swing sentiment in the short term; the practical approach is to read headlines critically and examine underlying numbers and guidance. Alphabet stock news often highlights quarterly ad revenue beats or misses, cloud growth updates, and regulatory developments; use this context to separate temporary volatility from meaningful long-term shifts. Always cross-check one-off headlines with management commentary and regulatory filings; the long-run value of Alphabet remains tied to its core platforms, search dominance, and ability to monetize AI-driven services. Retail investors should build a narrative that links price moves to earnings quality, cash flow generation, and capital allocation decisions rather than reacting to every headline. And for deeper analysis and scenario planning, consider using Swastika's Sarthi AI stock assistant to stress-test Alphabet under different growth and policy scenarios.
Frequently Asked Questions
What is Alphabet share price today?
Alphabet share price fluctuates during market hours; for current data, check your Swastika trading platform or a reliable financial data source.
What factors influence Alphabet share price movements?
Key drivers include advertising revenue growth, Google Cloud profitability, YouTube monetization, AI initiatives, regulatory scrutiny, macroeconomic trends, and currency effects.
How can Indian retail investors use price charts to evaluate Alphabet?
Price charts help identify trends, support and resistance levels, moving-average signals, and momentum indicators to time entries and exits.
What is the difference between Alphabet Class A and Class C shares?
Class A (GOOGL) and Class C (GOOG) shares represent the same underlying business; price differences arise from trading dynamics and liquidity, not different rights. The core business prospects drive both prices.
Where can Indian retail investors access AI-powered stock research for Alphabet?
Swastika offers research and tools through Swastika's Sarthi AI stock assistant, which provides institutional-level insights for retail investors.
Conclusion
In short, stay focused on fundamentals, keep your horizon long, and let price be a signal–not your sole driver. The next step is to define your personal investment thesis for Alphabet, test it with data-driven scenarios, and review it quarterly to adapt to a changing policy and technology climate.
Open your trading and demat account here
Reference :
1 : Google
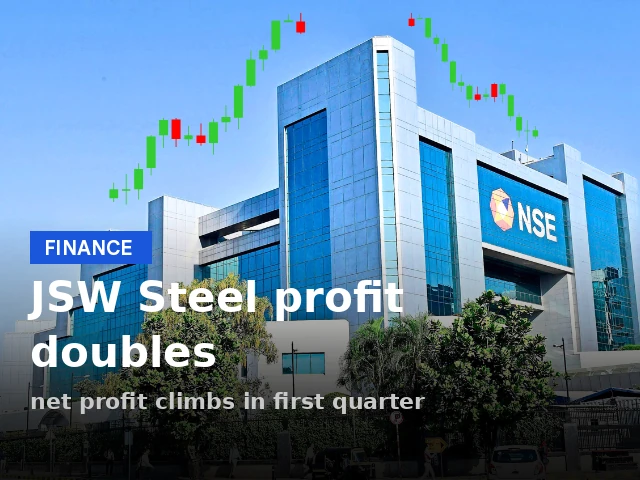
JSW Steel Share Price Momentum After Q1 FY27 Earnings And Andhra Pradesh Plant Expansion
Key Takeaways
- JSW Steel's Q1 FY27 net profit rose to Rs 4,696 crore, more than doubling from Rs 2,209 crore in Q1 FY26.
- Total income rose to Rs 48,088 crore from Rs 43,497 crore in Q1 FY26.
- Crude steel output increased 3% to 6.59 MT in Q1 FY27 from 6.38 MT in Q1 FY26.
- AP plant expansion: 2 MTpa capacity with Rs 16,350 crore investment in Andhra Pradesh.
Investors tracking the jsw steel share price faced a turning point as JSW Steel reported a strong Q1 FY27. The June quarter results show consolidated net profit of Rs 4,696 crore, more than doubled from Rs 2,209 crore a year earlier, and total income rose to Rs 48,088 crore from Rs 43,497 crore in Q1 FY26. Expenses rose to Rs 41,830 crore from Rs 40,325 crore, reflecting higher operating pace as crude steel output rose to 6.59 million tonnes in the June quarter FY27, up from 6.38 MT a year ago, a 3% growth.
The numbers paint a picture of a company leveraging volume growth and improving efficiency to augment profitability. The table below captures the headline metrics and how they compare with the prior year. The Andhra Pradesh plant expansion, with 2 MTpa capacity and an investment of Rs 16,350 crore, is a strategic move that reinforces the JSW Group's footprint in downstream steel manufacturing, aligning with its position as one of India’s leading six steel making players.
| Metric | Q1 FY27 | Q1 FY26 | Comment |
|---|---|---|---|
| Consolidated Net Profit | Rs 4,696 crore | Rs 2,209 crore | More than doubled YoY |
| Total Income | Rs 48,088 crore | Rs 43,497 crore | Higher YoY |
| Expenses | Rs 41,830 crore | Rs 40,325 crore | Rise in expenses |
| Crude Steel Output | 6.59 MT | 6.38 MT | 6.59 MT vs 6.38 MT |
| Crude Steel Production Growth | 3% | – | 3% growth |
| AP Plant Capacity | 2 MTpa | To be announced | Under construction |
| AP Plant Investment | Rs 16,350 crore | To be announced | Significant expansion |
Beyond the headline numbers, the production side shows how volume gains are underpinning profitability. Crude steel output rose to 6.59 MT in the June quarter FY27, up 3% from 6.38 MT in April–June FY26. This uplift in production comes alongside a disciplined cost structure, where total expenses rose but were offset by higher topline and stabilization of operating leverage. The June quarter has reinforced JSW Steel’s positioning among India’s leading six steel making players, with the Andhra Pradesh expansion acting as a key long-term growth vector.
As investors monitor the path of the jsw steel stock price, the combination of strong profit growth, rising crude steel output, and capacity expansion signals a constructive long-term trajectory. The Andhra Pradesh plant, with a 2 MTpa capacity and Rs 16,350 crore investment, suggests a deliberate push into higher-volume, higher-margin segments of steel production and downstream processing. This aligns with a broader industry trend toward integrated capacity and regional diversification, factors that can support earnings visibility over the next several quarters.
For readers seeking deeper quantitative context, consider the following snapshot of the quarter’s key numbers and what they imply. A healthy top-line push coupled with a moderating rise in expenses points to improving operating leverage, particularly as crude steel output continues to scale. The Andhra Pradesh project adds scale without immediate disruption to cash flows, given its staged execution and long-term demand outlook for steel across construction, infrastructure, and manufacturing segments.
If you want a concise, model-ready view of how these factors translate to your investment thesis, Swastika offers insights through its dedicated research tools. You can explore Swastika's Sarthi AI stock assistant for institutional-grade analysis tailored to retail investors: Swastika's Sarthi AI stock assistant.
JSW Steel Share Price Momentum After Q1 FY27 Earnings
From a trading viewpoint, the June quarter results provide a foundation for cautious optimism around the jsw steel share price. The company delivered a robust net profit print, supported by a 3% production uptick to 6.59 MT and a solid jump in total income to Rs 48,088 crore. The margin improvement is implicit in profit growth, even as expenses rose to Rs 41,830 crore. For investors, the immediate question is whether this earnings trajectory is sustainable into the next quarter and how a larger capital outlay in Andhra Pradesh could influence cash flows and debt levels. In the near term, a constructive read hinges on continued volume strength and cost discipline, along with progress on the Andhra Pradesh project.
Strategically, JSW Steel remains well-placed in a sector that benefits from domestic steel demand tied to infrastructure spending and manufacturing activity. The company’s expansion through the 2 MTpa Andhra Pradesh facility signals intent to capture incremental demand, especially in downstream segments, which can enhance profitability even if commodity prices exhibit volatility. In sum, the current earnings upgrade coincides with an expansion plan that could amplify the earnings power over the medium term, potentially supporting a firmer trajectory for the jsw steel stock price as the project advances.
JSW Steel Production Trends In Q1 FY27
The production line transformation during Q1 FY27 is a critical input to the earnings story. Crude steel output advanced to 6.59 MT in the June quarter FY27, up 3% from 6.38 MT in Q1 FY26, illustrating volume resilience even as the sector faces input cost dynamics. This pace underscores JSW Steel’s capacity utilization and operational efficiency, factors closely watched by investors tracking the jsw steel production narrative. Higher production, when combined with disciplined cost management, tends to support margins and free cash flow generation, providing a cushion against cyclical price swings in steel products.
Other factors shaping the production outlook include product mix, efficiency gains from plant modernization, and the ability to scale the Andhra Pradesh facility without disrupting current operations. The 2 MTpa AP plant represents a meaningful step in augmenting capacity while signaling the company’s willingness to invest in downstream integration. As the project progresses, investors will look for continued production discipline and evidence of cost controls that preserve profitability as volumes rise.
Andhra Pradesh Plant Expansion And Its Strategic Impact
The Andhra Pradesh plant, designed for a capacity of 2 MTpa, stands as a centerpiece of JSW Steel’s growth strategy in the coming years. The Rs 16,350 crore investment signals a substantial commitment to expanding steelmaking capacity in a key regional hub. The plant’s location in Andhra Pradesh offers strategic advantages in terms of logistics, access to ports, and proximity to growing demand centers, potentially boosting supply-chain efficiency and reducing transportation costs over time. This expansion aligns with the broader objective of maintaining a balanced geographic footprint while capitalizing on India’s rising infrastructure and manufacturing demand for steel products.
For retail investors, the AP project also implies a longer investment horizon. The capital expenditure will likely be incurred over multiple phases, with early-stage cost outlays weighed against long-term revenue enhancements from higher volumes and downstream activities. The project’s success depends on timely execution, favorable steel demand trends, and the company’s ability to manage integration with existing operations. Taken together with the Q1 FY27 earnings, the AP expansion reinforces a growth narrative that could support the jsw steel stock price framework as the project progresses and market expectations adjust to new capacity coming online.
As part of the JSW Group, the expansion complements the company’s standing in India’s steel sector. The firm remains among the top six steel producers in the country, a benchmark that provides a credible competitive backdrop for investors assessing the sustainability and resilience of earnings in the face of cyclical volatility. The combination of solid Q1 FY27 results, continued production growth, and strategic capacity additions strengthens the long-term investment thesis for JSW Steel and the JsW Steel stock price narrative.
Retail Investor Takeaways From The Q1 FY27 Results
Key takeaways for retail investors center on the balance between earnings growth and capital investments. The surge in consolidated net profit to Rs 4,696 crore, alongside a total income of Rs 48,088 crore, confirms that revenue escalation is translating into real profitability. With crude steel output rising to 6.59 MT and a 3% growth rate, the business demonstrates its capacity to convert higher volumes into earnings, assuming cost pressures remain manageable. The Rs 16,350 crore investment in the Andhra Pradesh plant signals a strategic repositioning toward higher-volume production and downstream value addition, beyond just raw steel manufacture.
Frequently Asked Questions
What were JSW Steel's Q1 FY27 net profit and total income?
Net profit was Rs 4,696 crore and total income was Rs 48,088 crore for the June quarter FY27.
How did JSW Steel's Q1 FY27 crude steel output compare to Q1 FY26?
Crude steel output rose to 6.59 million tonnes in Q1 FY27 from 6.38 MT in Q1 FY26, a 3% growth.
What is the Andhra Pradesh plant expansion details?
A new plant with 2 million tonnes per annum capacity is under construction in Andhra Pradesh, with investment of Rs 16,350 crore.
Where does JSW Steel stand among Indian steel producers?
JSW Steel is among India's leading six steel making players.
Where can I learn more about Swastika's Sarthi AI stock assistant?
You can access Swastika's Sarthi AI stock assistant at Swastika's official site.
Conclusion
JSW Steel’s Q1 FY27 performance confirms a favorable impulse in profitability driven by higher volumes and a broader operating cadence. The combination of a 3% rise in crude steel output to 6.59 MT, a net profit expansion to Rs 4,696 crore, and total income of Rs 48,088 crore points to a resilient earnings framework that can support the jsw steel share price if the company sustains its cost discipline. The Andhra Pradesh plant expansion adds a long-term growth leg, reinforcing confidence in the company’s ability to scale with demand while maintaining financial prudence. Retail investors should align their expectations with execution milestones and use this growth template to refine entry points and risk controls. As the business expands capacity and optimizes operations, a forward-looking mental model that combines profitability, cash flow, and capital efficiency will serve as a practical compass for navigating the stock’s journey ahead.
Open your trading and demat account here
Reference :
1 : Economictimes

Shapoorji Pallonji Bonds: A Retail Investor's Guide To The Long-Delayed Debt Fundraising
Key Takeaways
- shapoorji pallonji bonds fundraising completed through internal SP Group structure backed by Tata Sons stake.
- Eqyizen Investment raised three-year zero-coupon rupee bonds yielding 18.95%, with bids worth 215 billion rupees for the three-year issue.
- Mercury Finance invested the entire proceeds from a $650 million dollar bond issue into the rupee tranche.
- Maturity extended to July 31, with total payout around 145 billion rupees.
shapoorji pallonji bonds have emerged as a focal point in India's corporate debt landscape, a case study in long-delayed fundraising finally converging with collateral-backed structure, and a test of retail appetite for high-yield, secured notes. The story centers on a SP Group debt fundraising that relied on an internal transaction where one SP Group entity invested in another, enabling a three-year rupee bond issue with bids totaling 215 billion rupees. At stake is a Tata Sons-backed collateral chain, with the stake held through Cyrus Investments and comprising about 18.4% of the sponsor group's shares. As a result, these shapoorji pallonji bonds offer a rare look at how cross-entity funding and collateral can unlock liquidity for a sprawling Indian conglomerate.
For retail investors evaluating debt opportunities, this structure underscores a core tension: higher yields are often tied to more complex security and sponsor linkage. The deal pack includes a three-year zero-coupon rupee bond issued by Eqyizen Investment, a SP Group entity, which yielded 18.95%. The rupee tranche was closed for subscription on a Friday and is set to settle the following Monday, signaling a completed step in a multi-year fundraising strategy. The context is reinforced by Tata Sons' stake, an anchor that adds credibility to the collateral narrative, while SP Group's 18.4% stake in the company provides a measurable lever for risk assessment. For readers seeking deeper, stock-level research alongside bond insights, Swastika's Sarthi AI stock assistant offers a bridge between fixed income and equity analytics: Swastika's Sarthi AI stock assistant.
Shapoorji Pallonji Bonds: A Deep Dive Into The Long-Delayed Debt Fundraising
The long-delayed fundraising was completed through an internal SP Group transaction, with one SP Group entity funding another to close the capital gap. The rupee bonds drew 215 billion rupees in bids for a three-year issue, highlighting strong investor demand for secure, collateral-backed debt within a group with deep cross-holdings. The collateral backing comes from the Tata Sons stake held through Cyrus Investments, anchoring the security package and shaping the credit risk profile for lenders. Tata Sons' stake–representing roughly 18.4% of the SP Group's shares–adds a tangible equity cushion that investors can monitor alongside the debt covenants and settlement timelines.
Eqyizen Investment, a SP Group company, raised funds through three-year zero-coupon rupee bonds yielding 18.95%. The issue closed for subscription and was due to settle in the near term, reflecting a structured approach to delivering yield while maintaining a rigorous collateral framework. The high yield is a function of the instrument type (zero-coupon) and the security around the Tata Sons stake, offering a reference point for understanding how collateral-backed notes can command premium yields in the current market context.
Sp Group Bonds: Structure, Yield, And The Collateral Backing
The shapoorji pallonji bonds framework centers on a collateral arrangement backed by the Tata Sons stake, held through Cyrus Investments. This stake, around 18.4% of the sponsor group's shares, is the keystone of the security package and the primary channel through which lenders seek protection. The SP Group's strategy of channeling funding through internal SP Group entities demonstrates an alternative pathway to debt financing, leveraging intra-group liquidity to support external obligations while maintaining a strong collateral narrative for investors.
As part of the broader financing ecosystem, Mauritius-based SPV Mercury Finance played a pivotal role as a key investor in the rupee tranche. Mercury Finance raised $650 million through three-year dollar bonds at a 14.50% yield and then deployed the proceeds into the rupee issue, creating a cross-currency funding feedback loop that expands the investor base and enhances liquidity for shapoorji pallonji bonds. Deutsche Bank served as the sole arranger and an investor in the rupee issue, underscoring the instrument's institutional backbone and the emphasis on a well-defined credit process for this complex debt program.
Goswami Infratech Bonds: A Prior SP Group Debt Instrument And Its Outcome
To place shapoorji pallonji bonds in perspective, Goswami Infratech – another SP Group company – raised 143 billion rupees in June 2023 via zero-coupon bonds at an 18.75% yield. The notes have since seen two maturity extensions, most recently to July 31 from June 30, with total payout, including interest, estimated at about 145 billion rupees. This prior episode illustrates the SP Group's appetite and capability for executing high-yield, collateral-backed debt instruments within its broader financing strategy. The goswami infratech bonds experience informs investors about the risk-reward calculus inherent in SP Group-led debt programs and how collateral structures interact with market yields.
Mercury Finance And The Dollar-To-Rupee Bond Flow
The Mauritius-based SPV Mercury Finance was a key investor in the rupee tranche after raising $650 million through three-year dollar bonds at a 14.50% yield. The SPV then invested the entire proceeds into the rupee issue, reinforcing the cross-border aspect of the SP Group's debt program. Subscriptions reportedly included large private credit funds, expanding the investor base for shapoorji pallonji bonds and similar instruments. Deutsche Bank acted as the sole arranger and an investor in the rupee issue, adding a layer of institutional credibility to a deal that blends cross-border liquidity with local security structures.
Implications For Retail Investors: Risks, Returns, And Due Diligence
For retail investors, shapoorji pallonji bonds and the SP Group debt ecosystem illustrate how collateral-backed notes can deliver attractive yields while embedding a layer of sponsor-group risk. The 18.95% yield on the Eqyizen Investment tranche and the 18.75% yield on goswami infratech bonds reflect the premium demanded for high-yield, zero-coupon formats that rely on collateral such as the Tata Sons stake. However, the concentration of collateral in a single stake (held via Cyrus Investments) means that any disruption to the Tata Sons exposure or the SP Group's liquidity could impact debt service. Investors should assess the enforceability of the collateral, the sponsor group's liquidity, and the potential for changes in credit terms in a shifting macro backdrop.
Frequently Asked Questions
What is the current status of shapoorji pallonji bonds fundraising?
The long-delayed debt fundraising was completed through an internal SP Group transaction where one SP Group entity invested in another.
What backs the rupee bonds in shapoorji pallonji bonds deal?
The rupee bonds are secured by the Tata Sons stake, held through Cyrus Investments.
What yields were offered in the SP Group bonds tranche and related instruments?
Eqyizen Investment raised funds through three-year zero-coupon rupee bonds yielding 18.95%.
What role did Mercury Finance play in this cross-border bond flow?
Mercury Finance, a Mauritius-based SPV, raised $650 million through three-year dollar bonds at a 14.50% yield and invested the proceeds into the rupee issue.
What is the status and payout for goswami infratech bonds?
In June 2023, Goswami Infratech raised 143 billion rupees through zero-coupon bonds at 18.75% yield; notes matured twice, most recently to July 31, with total payout around 145 billion rupees.
Conclusion
Retail investors should weigh the high yields against the complexity of collateral-backed SP Group structures and the cross-border liquidity dynamic that underpins shapoorji pallonji bonds. The presence of Tata Sons stake as collateral, the interlinked SP Group entities, and the cross-currency funding from Mercury Finance all shape a nuanced risk-reward profile. The key takeaway is to treat these instruments as credit-risk investments with a collateral overlay, requiring careful due diligence and monitoring of the sponsor group's liquidity and the security's enforceability in stressed conditions.
Open your trading and demat account here
Reference :
1 : Economictimes
Big Budget


Popular Articles




.avif)
.avif)

.avif)



START YOUR INVESTMENT JOURNEY
Get personalized advice from our experts
- Dedicated RM Support
- Smooth and Fast Trading App
