


Karnataka Bank Share Price Momentum: Kush Bohra’s July 22 Picks




Key Takeaways
- Kush Bohra highlights Karnataka Bank and Fiem Industries with defined targets and stop losses.
- The analysis frames the karnataka bank share price and fiem industries stock price within sector dynamics.
- Concrete levels: Karnataka Bank targets 289 and 300; Stop at 272; Fiem Industries targets 2,405 and 2,480; Stop at 2,260.
- Consider Swastika's Sarthi AI stock assistant for deeper, risk-aware decision-making.
The karnataka bank share price has shown a notable consolidation in recent sessions, placing it at the center of Kush Bohra's top picks for July 22, 2026. As a private banking play, Karnataka Bank is being considered for a controlled exposure in a market where risk management matters as much as upside potential. In the same breath, the auto components space is watched through Fiem Industries, a stock that often moves with supply-chain cycles and OEM demand. This article unpacks the two ideas with defined targets, stop losses, and practical takeaways for retail investors across India.
Karnataka Bank Stock Price Momentum: Kush Bohra’s July 22 Picks
Among Kush Bohra's picks, the karnataka bank share price has demonstrated positive momentum, supporting a buy recommendation. The setup includes explicit levels: Target 1 at Rs 289; Target 2 at Rs 300; Stop Loss at Rs 272. This is not a broad call to buy any bank, but a structured setup in a name with improving risk controls and potential upside if the price sustains above the initial targets. The private banking space has been under scrutiny for asset quality management, yet the chart pattern here hints at resilience when price action confirms a breakout from a tight range.
In parallel, the fiem industries stock price narrative offers a different but related angle. The chart suggests near-term gains as the auto components space normalizes after supply-chain disruptions. Kush Bohra has mapped two precise targets: Target 1 at Rs 2,405 and Target 2 at Rs 2,480, with a stop loss at Rs 2,260. The emphasis is on disciplined exposure–clear price goals, a defined risk cap, and ongoing price action validation. This dual-pillar approach helps investors diversify across sectors while maintaining a controlled risk profile.
| Stock | Target 1 | Target 2 | Stop Loss |
|---|---|---|---|
| Karnataka Bank | Rs 289 | Rs 300 | Rs 272 |
| Fiem Industries | Rs 2,405 | Rs 2,480 | Rs 2,260 |
The figures above reflect Kush Bohra's July 22, 2026 analysis and are presented as actionable levels for retail traders seeking defined risk controls. The karnataka bank share price story benefits from a supportive macro backdrop for private banks, while the fiem industries stock price thesis leverages improving OEM demand and the resilience of auto-component suppliers in cyclical environments. As with any trading idea, use proper position sizing and adjust stops as price action unfolds.
Is Karnataka Bank A Good Buy?
Investors often ask is karnataka bank a good buy given this setup. The short answer is: it depends on your risk tolerance and time horizon. The chart shows positive momentum, with a protective stop at Rs 272. If the karnataka bank share price can sustain above the Rs 289– Rs 300 zone with healthy volume, the upside case strengthens. However, like all bank equities, this name remains sensitive to macro funding conditions, regulatory changes, and asset-quality developments that could alter the reward-to-risk balance.
Beyond the chart, the broader private banking backdrop matters. When the economy improves and banks demonstrate steady loan growth with controlled credit quality, the relative outperformance of select names becomes more plausible. A disciplined approach–buying within defined targets, maintaining stops, and revisiting the thesis as new results flow in–helps align a position with portfolio objectives. If you want structured, research-grade support while making these decisions, consider Swastika's Swastika's Sarthi AI stock assistant.
Fiem Industries Stock Price Outlook
Fiem Industries stock price dynamics offer a constructive near-term setup, albeit in a more cyclical space. The auto components stock price can react to OEM demand and supply-chain normalization, which underpins Kush Bohra's two-tier target approach. The targets are clear: Target 1 at Rs 2,405 and Target 2 at Rs 2,480, with a stop loss at Rs 2,260. If achieved, these levels could open the door to further upside, supported by solid fundamentals in the auto components segment and a degree of earnings visibility for suppliers like Fiem Industries.
That said, cyclical sectors always carry higher volatility. The fiem industries stock price motion can be influenced by commodity prices, exchange rate moves, and global auto demand. Retail investors should adopt a measured stance–allocate only what you can risk, use trailing stops if momentum persists, and reassess the thesis when fresh quarterly results or market signals arrive. The goal remains to extract upside while keeping losses capped, a plan embodied by the targets and stop loss in Kush Bohra's note.
Karnataka Bank Technical Analysis And Outlook
From a karnataka bank technical analysis perspective, the stock price has shown sustained strength in recent sessions. Momentum indicators point to continued buying interest, and price action has hovered around key support levels, with the potential for a breakout above Rs 300 if buying pressure continues. The view is supported by the sector context–private banks have shown resilience when asset quality remains steady and funding conditions are favorable. The setup remains favorable for a medium-term horizon as long as price sustains above the Rs 272 stop and moves toward the Rs 289–300 targets.
Frequently Asked Questions
What stocks did Kush Bohra highlight on July 22, 2026?
Karnataka Bank and Fiem Industries were highlighted with defined targets and stop losses.
What are the price targets for Karnataka Bank?
Karnataka Bank Target 1: Rs 289; Target 2: Rs 300; Stop Loss: Rs 272.
What are the price targets for Fiem Industries?
Fiem Industries Target 1: Rs 2,405; Target 2: Rs 2,480; Stop Loss: Rs 2,260.
Where can I get deeper stock research for these ideas?
Swastika's Sarthi AI stock assistant can provide institutional-grade stock insights:Swastika's Sarthi AI stock assistant.
Is Karnataka Bank technically strong enough for a trade?
Karnataka Bank Technical Analysis suggests positive momentum with potential breakout if the price holds above Rs 300; stop at Rs 272 provides risk control.
Conclusion
For the retail investor right now, Kush Bohra's picks offer a practical framework: a high-confidence setup on Karnataka Bank with a clean risk control and a complementary idea in Fiem Industries to diversify within the auto components space. The key is to follow the targets, respect the stop loss, and monitor price action for signs of a breakout or reversal. The approach marries technical signals with sector context to create a measured, actionable path for capital allocation.
Open your trading and demat account here
Reference :
1 : Ndtvprofit
Latest Articles
Karnataka Bank Share Price Momentum: Kush Bohra’s July 22 Picks


Key Takeaways
- Kush Bohra highlights Karnataka Bank and Fiem Industries with defined targets and stop losses.
- The analysis frames the karnataka bank share price and fiem industries stock price within sector dynamics.
- Concrete levels: Karnataka Bank targets 289 and 300; Stop at 272; Fiem Industries targets 2,405 and 2,480; Stop at 2,260.
- Consider Swastika's Sarthi AI stock assistant for deeper, risk-aware decision-making.
The karnataka bank share price has shown a notable consolidation in recent sessions, placing it at the center of Kush Bohra's top picks for July 22, 2026. As a private banking play, Karnataka Bank is being considered for a controlled exposure in a market where risk management matters as much as upside potential. In the same breath, the auto components space is watched through Fiem Industries, a stock that often moves with supply-chain cycles and OEM demand. This article unpacks the two ideas with defined targets, stop losses, and practical takeaways for retail investors across India.
Karnataka Bank Stock Price Momentum: Kush Bohra’s July 22 Picks
Among Kush Bohra's picks, the karnataka bank share price has demonstrated positive momentum, supporting a buy recommendation. The setup includes explicit levels: Target 1 at Rs 289; Target 2 at Rs 300; Stop Loss at Rs 272. This is not a broad call to buy any bank, but a structured setup in a name with improving risk controls and potential upside if the price sustains above the initial targets. The private banking space has been under scrutiny for asset quality management, yet the chart pattern here hints at resilience when price action confirms a breakout from a tight range.
In parallel, the fiem industries stock price narrative offers a different but related angle. The chart suggests near-term gains as the auto components space normalizes after supply-chain disruptions. Kush Bohra has mapped two precise targets: Target 1 at Rs 2,405 and Target 2 at Rs 2,480, with a stop loss at Rs 2,260. The emphasis is on disciplined exposure–clear price goals, a defined risk cap, and ongoing price action validation. This dual-pillar approach helps investors diversify across sectors while maintaining a controlled risk profile.
| Stock | Target 1 | Target 2 | Stop Loss |
|---|---|---|---|
| Karnataka Bank | Rs 289 | Rs 300 | Rs 272 |
| Fiem Industries | Rs 2,405 | Rs 2,480 | Rs 2,260 |
The figures above reflect Kush Bohra's July 22, 2026 analysis and are presented as actionable levels for retail traders seeking defined risk controls. The karnataka bank share price story benefits from a supportive macro backdrop for private banks, while the fiem industries stock price thesis leverages improving OEM demand and the resilience of auto-component suppliers in cyclical environments. As with any trading idea, use proper position sizing and adjust stops as price action unfolds.
Is Karnataka Bank A Good Buy?
Investors often ask is karnataka bank a good buy given this setup. The short answer is: it depends on your risk tolerance and time horizon. The chart shows positive momentum, with a protective stop at Rs 272. If the karnataka bank share price can sustain above the Rs 289– Rs 300 zone with healthy volume, the upside case strengthens. However, like all bank equities, this name remains sensitive to macro funding conditions, regulatory changes, and asset-quality developments that could alter the reward-to-risk balance.
Beyond the chart, the broader private banking backdrop matters. When the economy improves and banks demonstrate steady loan growth with controlled credit quality, the relative outperformance of select names becomes more plausible. A disciplined approach–buying within defined targets, maintaining stops, and revisiting the thesis as new results flow in–helps align a position with portfolio objectives. If you want structured, research-grade support while making these decisions, consider Swastika's Swastika's Sarthi AI stock assistant.
Fiem Industries Stock Price Outlook
Fiem Industries stock price dynamics offer a constructive near-term setup, albeit in a more cyclical space. The auto components stock price can react to OEM demand and supply-chain normalization, which underpins Kush Bohra's two-tier target approach. The targets are clear: Target 1 at Rs 2,405 and Target 2 at Rs 2,480, with a stop loss at Rs 2,260. If achieved, these levels could open the door to further upside, supported by solid fundamentals in the auto components segment and a degree of earnings visibility for suppliers like Fiem Industries.
That said, cyclical sectors always carry higher volatility. The fiem industries stock price motion can be influenced by commodity prices, exchange rate moves, and global auto demand. Retail investors should adopt a measured stance–allocate only what you can risk, use trailing stops if momentum persists, and reassess the thesis when fresh quarterly results or market signals arrive. The goal remains to extract upside while keeping losses capped, a plan embodied by the targets and stop loss in Kush Bohra's note.
Karnataka Bank Technical Analysis And Outlook
From a karnataka bank technical analysis perspective, the stock price has shown sustained strength in recent sessions. Momentum indicators point to continued buying interest, and price action has hovered around key support levels, with the potential for a breakout above Rs 300 if buying pressure continues. The view is supported by the sector context–private banks have shown resilience when asset quality remains steady and funding conditions are favorable. The setup remains favorable for a medium-term horizon as long as price sustains above the Rs 272 stop and moves toward the Rs 289–300 targets.
Frequently Asked Questions
What stocks did Kush Bohra highlight on July 22, 2026?
Karnataka Bank and Fiem Industries were highlighted with defined targets and stop losses.
What are the price targets for Karnataka Bank?
Karnataka Bank Target 1: Rs 289; Target 2: Rs 300; Stop Loss: Rs 272.
What are the price targets for Fiem Industries?
Fiem Industries Target 1: Rs 2,405; Target 2: Rs 2,480; Stop Loss: Rs 2,260.
Where can I get deeper stock research for these ideas?
Swastika's Sarthi AI stock assistant can provide institutional-grade stock insights:Swastika's Sarthi AI stock assistant.
Is Karnataka Bank technically strong enough for a trade?
Karnataka Bank Technical Analysis suggests positive momentum with potential breakout if the price holds above Rs 300; stop at Rs 272 provides risk control.
Conclusion
For the retail investor right now, Kush Bohra's picks offer a practical framework: a high-confidence setup on Karnataka Bank with a clean risk control and a complementary idea in Fiem Industries to diversify within the auto components space. The key is to follow the targets, respect the stop loss, and monitor price action for signs of a breakout or reversal. The approach marries technical signals with sector context to create a measured, actionable path for capital allocation.
Open your trading and demat account here
Reference :
1 : Ndtvprofit

Goldman Sachs Share Price Trends: What Every Indian Retail Investor Should Know In 2026
Key Takeaways
- Global gold price peaked at 5,595 USD/oz in January 2026, while India’s 10-gram gold price hit a historic 1.91 lakh INR.
- Currently, 24K gold in India trades near 1.41 lakh INR per 10g, signaling a domestic correction from the January high.
- Analysts see a strong 3,800–4,000 USD support zone; CoinCodex projects around 2,780 USD by year-end, implying a substantial downside from the peak.
- For Indian investors, FX and import duties temper global declines to about 15–20% in rupee terms; consider Swastika's Sarthi AI stock assistant for tailored insights.
goldman sachs share price headlines are back as global gold markets navigate inflation, central bank policy, and currency swings. For Indian retail investors, this isn't just a dollar price story–it's about rupee risk, import duties, and how domestic costs track the global ounce. January 2026 saw gold sprint to a global high of 5,595 USD per ounce, while India's 10-gram price hit a historic 1.91 lakh rupees. Since then, the domestic price has retreated toward around 1.41 lakh rupees per 10 grams, illustrating the disconnect between global peaks and local costs.
The broader macro narrative matters because the gold market is not a standalone asset. The goldman sachs share price, a widely watched reference point, often reflects shifts in US real yields and the USD index. In parallel, Indian price dynamics hinge on USD/INR moves and the country's import duties. The result is a two-way street: a global ounce price and a domestically priced rupee are both essential inputs for a retail investor deciding whether to buy physical gold, invest in gold ETFs, or explore related equities. The discussion also touches on chart interpretations and cross-asset correlations that matter for a diversified portfolio.
Goldman Sachs Share Price: Global Trends That Drive The Move
Within the global arena, January 2026 marked a record for gold at 5,595 USD per ounce. Investors absorbed a sequence of drivers–from stronger upticks in US yields to renewed inflation concerns–and the global price cooled from its peak by more than 25% as markets recalibrated. At the same time, domestic Indian markets did not fall in lockstep, thanks to the rupee's relative resilience and the ongoing impact of import duties and other taxes. This divergence is critical: it clarifies why you cannot look at the global price alone when planning an Indian gold strategy.
Analysts from major banks have issued divergent commentary on the near-term path. The focus remains on risk management rather than a single direction. The goldman sachs stock price discussions and the jp morgan stock price narratives often appear side by side in investor briefings as a reflection of macro risk appetite. A useful way to visualize the path is to consult a long-run chart–more on that in the section below–where the goldman sachs share price chart shows how the asset has traded through cycles in the last four decades. Similarly, the jp morgan share price chart offers a mirror of risk sentiment during bullion cycles. If you want to see these charts in one place, consult credible research portals that provide adjusted data and scenario planning.
Even as investors watch the bullion price in USD, the Indian rupee complicates the translation into local prices. For retail investors, the key takeaway is this: global declines do not automatically replicate in India. If USD/INR moves lower or if import duties shift, the domestic price in rupees can deviate meaningfully from the US dollar price. In this sense, the 5,595 USD/oz peak and the subsequent pullback create a context for evaluating indian price levels rather than giving a single, universal buy or sell signal.
To support your decision-making, Swastika offers a practical decision aid through Swastika's Sarthi AI stock assistant. This AI-driven tool helps retail investors scan stock-level signals and correlate them with macro gold themes, making it easier to align bullion exposure with stock-portfolio goals.
India Gold Price Trends After January 2026 Peak: From 1.91 Lakh To 1.41 Lakh Per 10g
In January 2026, India's 10-gram gold price reached a historic high of INR 1.91 lakh. Since then, prices have retraced toward around INR 1.41 lakh per 10 grams. Several factors explain this move: a partial stabilization of global risk appetite, exchange rate dynamics, and the relative resilience of domestic demand in the short term. The import duty structure, local taxes, and the rupee's volatility against the dollar continue to modulate how much of global declines are passed on to Indian buyers.
For investors, this means the opportunity is not simply to buy at the lowest price but to manage timing and cost of carry, especially if you also hold gold-related equities or ETFs. If you plan a phased purchase schedule, consider aligning your buys with macro signals, including the pace of dollar strength, inflation expectations, and central bank policy cues. The key is to define a flexible strategy that allows you to scale into exposure when the price-activity regime becomes favorable.
Gold Price Forecasts And End-Year Targets: 3,800–4,000 USD Support And 2,780 USD End-Year Target
Analysts argue that a robust support zone exists around USD 3,800–4,000 per ounce. This range is seen as a floor in a scenario where inflation cools and real yields normalize, creating renewed demand for safe-haven assets. CoinCodex has even more bearish expectations, forecasting a potential drop to around USD 2,780 per ounce by year-end, which would represent roughly a 50% retracement from the January 2026 high. The divergent views reflect the uncertainty in global macro dynamics, including Middle East tensions, the pace of US monetary tightening or easing, and shifts in perceived risk appetite among investors.
For Indian investors, translate the global forecast into rupee terms by considering USD/INR movements and import duties. A drop to USD 2,780 would imply significant rupee-denominated price implications, moderated by policy measures and tax regimes. The practical implication is that you should not rely on a single data point; instead, track the price band and implement a cost-averaging schedule that lets you accumulate exposure if the price continues to move toward the 3,800–4,000 zone or lower. If you’re using any of the recommended analytics tools, you can cross-check the price channel on a weekly basis to maintain alignment with your investment horizon.
Historical Gold Price Cycles And Lessons For Indian Retail Investors
Historical cycles in gold prices offer valuable lessons for retail investors. In the 1980 crisis triggered by Iran and the Soviet invasion of Afghanistan, the US Federal Reserve pushed interest rates to levels as high as 20%, which ultimately produced a long-term decline in gold from the 1980s peak to the mid-1980s. The price range during that period fell from the late 1980s peak to around 300–350 USD/oz by 1985. In the 2011–2015 window, gold traded as high as USD 1,920 in September 2011, before dropping to about USD 1,050 by December 2015–a decline of roughly 45%. Across these cycles, the effect on India depended on currency movements, import duties, and the broader macro environment.
What does that mean for today’s retail investor? It means that gold’s price path is not a straight line. It also means that hedging and diversification across instruments–physical gold, gold ETFs, gold mining stocks, or related exchange-traded vehicles–can help manage tail risks. The idea is not to avoid volatility but to build a framework that allows you to participate in price upside while limiting downside risk. The interplay of macro variables matters more than any single data point, and tools like the Sarthi AI stock assistant can support decision-making in volatile markets.
Practical Steps For Retail Investors: Hedging, Stock Exposure, And Tools
One practical step is to consider how much of your portfolio should be exposed to gold vs. gold-related equities. If you expect a period of higher volatility in the bullion market, a balanced approach with physical gold or gold ETFs plus quality gold mining stocks can offer hedging benefits. In addition, watch the jp morgan dividends and goldman sachs dividends to understand relative income profiles in financial assets tied to bullion sentiment. While bullion ownership provides a hedge against inflation, equities in the gold sector can capture growth when the metal is support-laden and the equity market is supportive.
From a chart-reading perspective, you can monitor the jp morgan share price chart to observe how major indices respond in periods of gold price spikes or declines. The performance of the goldman sachs stock price also tends to reflect risk sentiment and macro-thrusts, and thus can offer a complementary view to bullion prices. For a structured and personalized approach, consider using Swastika's Sarthi AI stock assistant; it can surface stock-level signals that align with macro gold themes. Here is the CTA again for convenience: Swastika's Sarthi AI stock assistant.
Frequently Asked Questions
What is the current price of 24K gold in India?
As of mid-2026, the 24K gold price in India is around Rs 1.41 lakh per 10 grams.
How high did global gold price reach in January 2026?
Global gold price reached 5,595 USD per ounce in January 2026.
What do analysts forecast for gold's near-term levels?
Analysts see a strong support zone around 3,800–4,000 USD per ounce; CoinCodex projects around 2,780 USD by year-end.
How does the Indian price respond to global gold declines?
If global gold declines by about 40%, Indian prices could fall by roughly 15–20% in rupee terms due to USD/INR movements and import duties.
What historical gold price cycles should investors study?
Key cycles include the 1980 crisis with a Fed rate hike, the 1982–1985 price crash to around 300–350 USD/oz, and the 2011 peak of 1,920 USD/oz followed by a 2015 low around 1,050 USD/oz.
Conclusion
The retail investor today faces a gold price landscape shaped by a web of global and domestic forces. A peak in USD terms does not automatically translate into a proportional rupee move, and import duties, as well as currency dynamics, will dictate the actual price you face in your local market. The prudent approach is to think in ranges, hedge where appropriate, and implement a phased buying strategy that aligns with your risk tolerance and investment horizon. Use macro discipline, tactical risk controls, and tools like Sarthi to tailor your decisions to your financial goals.
In practical terms, a small but disciplined step today–whether it is a measured buy, a rebalancing, or a move into a related stock exposure–can set up more favorable outcomes as the global and domestic forces evolve. The next step is to get a clearer read on your own risk tolerance and investment horizon, and to use Sarthi to translate macro expectations into a concrete portfolio plan.
Open your trading and demat account here
Reference :
1 : Gujarati

Cube Highways Trust IPO: Should You Apply, Wait, or Watch for the Listing Dip?
Key Takeaways
- Price band Rs.151 to Rs.152; Issue size 136589480; Open 22-Jul-2026; Close 24-Jul-2026
- GMP signal: Not available yet
- Financials: Not disclosed in available sources for this IPO
- Action: Watchlist – wait for more data before applying
Cube Highways Trust IPO Background: What The Company Does And Who Backs It
The source data provides only a single line: Cube Highways Trust is currently open for IPO subscription. The available data does not include promoter details, revenue, or a formal business description. Investors should note that the company background and strategy are not provided in the data, and more information will be revealed soon.
Cube Highways Trust IPO Details: Price Band, Open/Close Dates, Listing Date, And Exchange
| Open Date | Close Date | Price Band | Lot Size | Listing Date | Exchange |
|---|---|---|---|---|---|
| 22-Jul-2026 | 24-Jul-2026 | Rs.151 to Rs.152 | To be announced | To be announced | NSE / BSE |
Cube Highways Trust IPO GMP Analysis: What The GMP Signal Means For You
GMP: Not available yet. In the absence of live GMP data, there is no reliable signal on listing gains. Retail investors should not rely on GMP alone to decide.
Cube Highways Trust IPO Subscription Status &Amp Demand Signals
Subscription – Retail: Not available yet
Subscription – NII: Not available yet
Subscription – QIB: Not available yet
Subscription – Overall: Not available yet
Cube Highways Trust IPO Financial Snapshot
| Financials | Not disclosed in available sources for this IPO. |
|---|
Cube Highways Trust IPO Valuation: Is The ₹151-₹152 Price Band Justified?
There are no revenue, profit, or growth figures disclosed in the data provided. Without visible financials, it is not possible to assess whether the ₹151-₹152 price band is attractive relative to earnings or cash flow.
Cube Highways Trust IPO Risks: What Could Go Wrong
The primary risk is the lack of disclosed financials and other key details (face value, registrar, lead managers, and minimum investment). The absence of revenue or profit data makes it difficult to gauge profitability or leverage. The "To be announced" status for several critical items adds execution risk for retail investors.
Cube Highways Trust IPO Allotment &Amp Listing Timeline
Allotment date: Not announced
Listing date: To be announced
Lead Manager: To be announced
How To Apply For Cube Highways Trust IPO Via UPI/ASBA
To apply via UPI/ASBA, follow these steps. Note: Lot size and min investment are not announced yet, so bids will depend on the lot size when revealed.
- Open Swastika Investmart app/website and navigate to the Cube Highways Trust IPO bidding page.
- Choose your bidding route: UPI or ASBA. If you select UPI, you will be prompted to link a UPI ID linked to your bank account; if you select ASBA, you will provide bank details so that funds can be blocked by your bank.
- Enter the bid quantity within the constraints of the lot size (to be announced) and select your bid price within Rs.151 to Rs.152.
- Confirm and authorize the bid using your UPI app or via your bank's ASBA facility. Funds are blocked (UPI) or blocked by your bank (ASBA) until allotment.
- Monitor status on your Swastika Investmart dashboard and await allotment results. If allotted, the funds will be debited; otherwise the amount will be released.
For deeper research, you can use Swastika's Sarthi AI stock assistant: Swastika's Sarthi AI stock assistant
Frequently Asked Questions
Is Cube Highways Trust IPO worth applying for at ₹151-₹152 band?
Not advisable given the absence of financial data and GMP signals; consider waiting for more clarity before committing capital.
What is the GMP signal for Cube Highways Trust IPO?
GMP is not available yet.
When does Cube Highways Trust IPO open and close?
Open on 22-Jul-2026 and close on 24-Jul-2026.
What is the lot size and minimum investment for Cube Highways Trust IPO?
Lot Size: To be announced; Min Investment: To be announced.
How to apply via UPI/ASBA for Cube Highways Trust IPO?
Follow the steps outlined in the UPI/ASBA section: use Swastika Investmart to bid within Rs.151-Rs.152, link a UPI ID or use ASBA through your bank, and note that lot size/min investment are not announced yet.
Conclusion
Cube Highways Trust is a small-ticket IPO with no disclosed financials and several key details yet to be announced. This combination means only a cautious approach for most retail investors: unless you have a specific insight or a high tolerance for data gaps, wait for more information before committing capital. The final decision should be guided by later updates on financials, listing day GMP, and the definitive lot size and allotment process.
Watchlist – wait for more clarity on financials, GMP signals, and listing dates before committing capital.
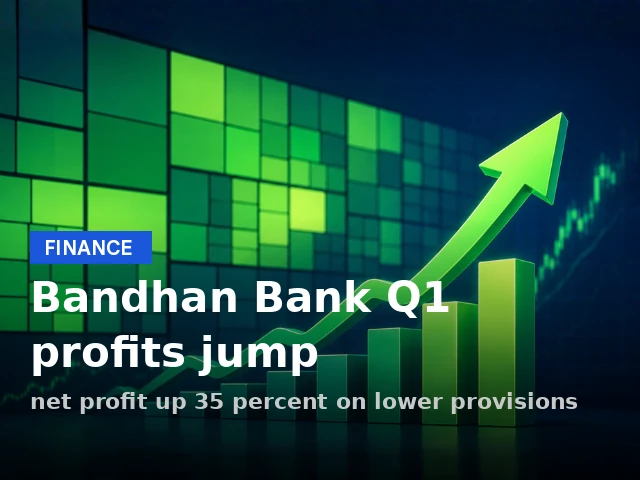
Bandhan Bank Results: Q1 FY26 Profit Jumps 34.9% On Lower Provisions
Key Takeaways
- Bandhan Bank results for Q1 show net profit up 34.9% YoY to Rs 502 crore.
- Net interest income rose 6% YoY to Rs 2,921 crore, with NIM at 6.2%.
- Asset quality improved: GNPA 3.15% and NNPA 0.93%.
- Provisioning declined to Rs 683 crore, enabling stable profitability.
Bandhan Bank results for the June quarter show a sharp profit expansion to Rs 502 crore, up 34.9% YoY from Rs 372 crore a year earlier, according to its regulatory filing. The bandhan bank results reflect cost discipline and improved asset quality. Net interest income (NII) rose 6% YoY to Rs 2,921 crore, while net interest margin (NIM) remained at 6.2% on a sequential basis, underscoring stable core profitability amid tightening credit conditions. Asset quality also improved as GNPA declined to 3.15% from 3.27% in the March quarter, and NNPA eased to 0.93% from 0.97%.
Bandhan Bank Results: Q1 FY26 Profit Jumps 34.9% On Lower Provisions
According to the bank's regulatory filing, the 34.9% YoY rise in profit was driven by lower credit costs. The bank set aside Rs 683 crore in the quarter, significantly lower than Rs 1,147 crore in the year-ago period, though broadly unchanged from Rs 677 crore in the preceding quarter.
| Metric | Value | Comment |
|---|---|---|
| Net Profit (YoY) | Rs 502 crore | Up 34.9% YoY |
| NII | Rs 2,921 crore | Up 6% YoY |
| NIM | 6.2% | Unchanged sequentially |
| GNPA | 3.15% | Down from 3.27% |
| NNPA | 0.93% | Down from 0.97% |
| Provisions | Rs 683 crore | Lower vs Rs 1,147 crore YoY; Rs 677 crore prior quarter |
| Interim CFO | Vinay Jain | Effective Sept 26 |
Analysts note that Bandhan Bank's earnings trajectory remains sensitive to credit costs, even as core profitability holds steady. The improved asset quality reduces the risk of future credit losses and supports sustainable earnings in the near term. Investors should monitor how loan growth, funding costs, and recoveries evolve in the coming quarters to gauge the durability of these gains.
For deeper stock insights, you can explore Swastika's Sarthi AI stock assistant, which offers institutional-grade research on stocks and indices to retail investors.
Frequently Asked Questions
What was Bandhan Bank's standalone net profit in Q1?
Bandhan Bank's standalone net profit rose to Rs 502 crore in the June quarter, up 34.9% from Rs 372 crore a year earlier, per its regulatory filing.
What were Bandhan Bank's net interest income and net interest margin in Q1?
Net interest income stood at Rs 2,921 crore, up 6% YoY, with net interest margin remaining at 6.2% on a sequential basis.
How did Bandhan Bank's asset quality change in Q1?
GNPA eased to 3.15% from 3.27% in the March quarter, and NNPA eased to 0.93% from 0.97%.
What was the provisioning level in Q1, and how does it compare to prior periods?
Provisioning was Rs 683 crore in the quarter, significantly lower than Rs 1,147 crore in the year-ago period and broadly in line with Rs 677 crore in the preceding quarter.
Who was appointed interim CFO at Bandhan Bank?
Vinay Jain was appointed as interim Chief Financial Officer, effective September 26.
Conclusion
Bandhan Bank results point to a healthier credit cost structure and improving asset quality, translating into a steadier earnings base for the quarter. For retail investors, the key takeaway is to watch the trajectory of provisioning and NII in upcoming quarters, as these drivers will determine whether Bandhan Bank can sustain its earnings momentum amid macro headwinds.
Next-step mental model: focus on the quality of growth versus the price of growth. Track NII growth, NIM stability, and any shifts in GNPA/NNPA trends in subsequent quarters, and consider using Swastika's Sarthi AI stock assistant to compare Bandhan Bank with peers and indices as new data arrives.
Open your trading and demat account here
Reference :
1 : Ndtvprofit
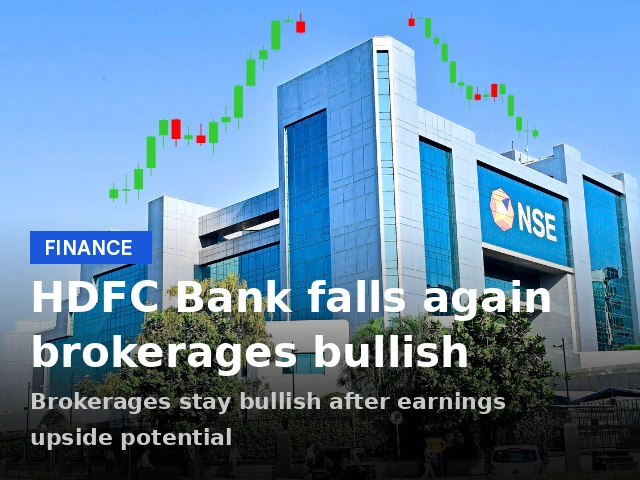
Hdfc Bank Share Price Outlook: Q1 FY27 Earnings, NII Growth, And Analyst Targets
Key Takeaways
- Q1 FY27 standalone net profit rose 5% YoY to Rs 19,060 crore, underscoring steady earnings momentum.
- Net interest income (NII) rose 7% YoY to Rs 33,534 crore, while loan growth accelerated to 16% YoY and NIM stood at 3.26%.
- Earnings were in-line with estimates, with NII slightly missed but offset by lower opex and credit costs; liquidity metrics remained strong.
- Analyst targets on the hdfc bank share price range from Rs 900 to Rs 1,050, with valuation support seen from potential margin recovery and loan growth.
What does the hdfc bank share price signal after Q1 FY27 results? In the April–June quarter, HDFC Bank reported a standalone net profit of Rs 19,060 crore, up 5% year‑on‑year from Rs 18,155 crore. Net interest income rose 7% to Rs 33,534 crore, from Rs 31,438 crore a year earlier. Loan growth came in at 16% year‑on‑year, while the bank's net interest margin (NIM) stood at 3.26%, a contraction of 12 basis points sequentially. The June quarter earnings were in-line with estimates, with a slight miss on NII offset by lower operating expenses and credit cost. In the backdrop, the stock has traded with some volatility, with shares around Rs 766 after a 1.5% decline on Tuesday and a roughly 6% decline over two sessions – a reminder that price action can swing on quarterly updates.
Hdfc Bank Share Price And Q1 FY27 Earnings Outlook
Stand‑alone net profit for the quarter stood at Rs 19,060 crore, up 5% YoY from Rs 18,155 crore. Net interest income rose 7% YoY to Rs 33,534 crore, up from Rs 31,438 crore a year earlier, signaling steady margin leverage even as NIM compressed. Loan growth remained robust at 16% YoY, highlighting the bank's ability to fund expansion across segments. The NIM was 3.26% in the June quarter, a QoQ contraction of 12 basis points, underscoring margin pressures amid a shifting funding mix. The quarter's earnings were in-line with estimates; a marginal miss on NII was offset by lower opex and credit cost, helping to keep profitability intact. This combination matters for the hdfc bank share price trajectory as investors weigh margin resilience against loan growth and credit costs.
Analysts note that margins could improve from here as high‑cost borrowings mature and structural efficiency offsets some of the pressure. Valuation anchors cited by several houses place the stock in a range that could offer upside if NIM stabilizes and loan growth remains sturdy. Jefferies, Nomura, Motilal Oswal, and JM Financial have published price targets aligned to a scenario where the bank sustains loan growth and gradually improves margins. The bank’s comments on FCNR(B) scheme execution and potential market share gains in the near term add a further layer of potential upside for hdfc bank share price, as do improvements in liquidity and capital adequacy metrics.
Hdfc Bank Results: NII Growth, Opex, And Credit Cost In Q1 FY27
The quarter’s NII growth of 7% YoY contributed to a stable revenue base even as opex remained a moderating factor. Operating expenses were lower, which helped offset a modest miss on NII relative to street expectations. The result: earnings in-line with estimates, with credit costs trending lower, supporting profitability against a backdrop of steady lending activity. The bank’s ability to manage costs while growing loans supports the resilience of the hdfc bank share price under pressure from margin compression, while the underlying loan book remains a source of structural strength.
From a risk-management perspective, the bank’s credit quality appears stable for now, with slippages and provisioning framing the credit cost narrative. The balance between growth and risk will be watched closely by investors, especially as the wholesale book has driven loan growth and retail lending remains comparatively subdued. The net result is a nuanced picture: growth momentum is intact, but the margin and funding mix will determine the pace of any re-rating in the near term.
Hdfc Bank Loan Growth Drivers And Retail Lending Trend In Q1 FY27
Loan growth stood at 16% YoY, underscoring robust demand across the corporate and SME segments. Analysts note that wholesale lending led the expansion, while retail lending remained comparatively muted. This mix aligns with a strategy of growing fee‑light corporate lending while maintaining asset quality and liquidity. The sequential mix also suggests that the bank’s funding profile is being supported by strong deposit formation, even as competition in the retail lending space remains intense. The 16% loan growth figure is a positive signal for the hdfc bank share price, suggesting durable revenue and balance-sheet resilience even in a high‑rate environment.
Analysts highlighted that further improvement in margins could come from the maturing of high‑cost borrowings over the next two years, coupled with a disciplined opex trajectory. The FCNR(B) scheme was identified as a potential lever for market share gains, though exact quantum remains unquantified in the auction cycle details disclosed. Leadership continuity and FCNR execution remain key near‑term monitorables for investors evaluating the bank’s longer‑term growth trajectory and the associated impact on the hdfc bank share price.
Hdfc Bank Nim Trends: Margin Outlook For Hdfc Bank Share Price
The bank’s NIM stood at 3.26% in Q1 FY27, a 12‑basis‑point QoQ contraction that highlights ongoing margin pressures in a high‑cost funding environment. Margin dynamics matter for the hdfc bank share price, as a sustained NIM support is a prerequisite for a meaningful re‑rating in valuations. Analysts expect some relief as cost of funds declines with the rollover of higher‑cost borrowings and the bank optimizes its funding mix. However, the near‑term path will depend on credit growth, deposit franchise strength, and the pace at which opex remains controlled.
Nomura’s commentary around higher loan growth expectations (16% for FY27, with deposits growing ~17%) implies a scenario where the bank could sustain a higher net interest income base, which could help stabilize NIM over the medium term. In practice, the margin recovery would be a key catalyst for the hdfc bank share price in subsequent quarters, particularly if the bank can translate loan growth into scalable profitability while controlling costs. The JM Financial view that LCR at 115% and a credit‑deposit ratio around 96% could cap rapid loan growth near term also underlines the delicate balance the bank must maintain between risk and growth.
Analyst Price Targets For The Hdfc Bank Share Price And What They Imply
Analyst targets across top brokerages reflect a cautious optimism that margins may stabilize and loan growth remains robust. Jefferies places the target at Rs 1,050, Motilal Oswal also at Rs 1,050, while Nomura pegs Rs 950 and JM Financial at Rs 900. The dispersion in targets suggests that investors should focus on where margins and credit costs settle, and how the bank navigates the cost of funds as high‑cost borrowings roll off. Jefferies notes valuations at about 1.8x FY27 adjusted PB and 14x FY27 P/E as attractive given the expected margin and growth trajectory. This suggests an upside case if the bank can execute on its loan growth strategy while improving operating leverage.
For investors, the takeaway is to watch the dual levers of margin and growth. A re‑acceleration in NIM, supported by a stable or expanding net interest income line and disciplined opex, could trigger a re-rating of the hdfc bank share price. Conversely, if credit cost pressures re‑emerge or retail growth remains weak, the stock could experience continued volatility. Either way, the near‑term catalysts lie in FCNR(B) execution, leadership continuity, and the bank’s ability to sustain a balanced growth path while preserving liquidity and capital adequacy.
FCNR(B) Scheme, Market Share Prospects, And Leadership Continuity
Among the near‑term monitorables is the FCNR(B) scheme, with management signaling the potential to gain a handsome market share. This factor, if realized, could help diversify the bank’s funding sources and support the NII trajectory. Leadership continuity and a disciplined execution plan for FCNR activities will be critical to unlocking this potential and supporting a steadier hdfc bank share price trajectory.
Liquidity metrics reinforce the positive backdrop: the liquidity coverage ratio (LCR) stood at 115% and the credit‑deposit ratio was around 96%, suggesting a solid liquidity buffer that can support loan growth without pressuring funding costs. Analysts view these metrics as enabling prudent growth while keeping funding costs in check, setting a foundation for a potential re‑rating as margins stabilize and loan growth sustains itself.
Related Reads
Frequently Asked Questions
What was HDFC Bank's standalone net profit in Q1 FY27?
Rs 19,060 crore, up 5% YoY from Rs 18,155 crore.
What was HDFC Bank's net interest income in Q1 FY27 and its YoY growth?
Rs 33,534 crore, up 7% YoY from Rs 31,438 crore.
What was HDFC Bank's loan growth in Q1 FY27?
16% YoY.
What was HDFC Bank's NIM in Q1 FY27?
3.26%; QoQ contraction of 12 basis points.
What are the analyst price targets for hdfc bank share price after Q1 FY27 results?
Jefferies: Rs 1,050; Motilal Oswal: Rs 1,050; Nomura: Rs 950; JM Financial: Rs 900.
Conclusion
For the retail investor, Q1 FY27 confirms that HDFC Bank remains a growth engine with a strong deposit franchise and a loan book that can sustain momentum even as margins face pressure in the near term. The hdfc bank share price will hinge on how well the bank can convert loan growth into higher net interest income, while keeping opex under control and credit costs in check. The combination of 16% YoY loan growth and NII up 7% YoY provides a credible growth axis, but the 3.26% NIM and the QoQ margin compression keep the near‑term price action sensitive. The analyst targets reflect a range of expectations for margin stabilization and earnings growth, with upside if the margin trajectory improves and FCNR(B) execution yields early gains.
Practical next steps for an investor: consider a scenario analysis that models a margin rebound as high‑cost borrowings roll off and deposit growth persists, supported by a strong wholesale book and a disciplined cost structure. Monitor FCNR(B) strategy execution and leadership stability as near‑term triggers for the hdfc bank share price. If you want deeper stock‑level insights and scenario planning, explore Swastika's Sarthi AI stock assistant: Swastika's Sarthi AI stock assistant.
Open your trading and demat account here
Reference :
1 : Economictimes
Paytm PPI Licence: Wallet Revival And Investor Outlook
Key Takeaways
- One97 Communications has applied to RBI for a Prepaid Payment Instrument licence to revive Paytm's wallet.
- The wallet revival would run alongside UPI via partner banks until RBI clears the PPI licence.
- Diversification of payments could strengthen Paytm's merchant ecosystem and monetization potential.
- Regulatory approval is pending; investors should monitor RBI's decision and wallet news.
In India’s rapidly evolving digital payments landscape, a single regulatory filing can redefine how wallets, UPI, and merchant payments fit together. One97 Communications has applied to the RBI for a Prepaid Payment Instrument licence, a move that could allow Paytm to resurrect its wallet on its own firm after the Paytm Payments Bank closure. If approved, the paytm ppi licence would empower One97 to issue prepaid instruments independently and expand digital payment offerings beyond UPI-based services, giving users a broader set of options for loading funds and completing transactions.
The paytm ppi licence is not just about a new product; it’s a potential reconfiguration of Paytm’s payments architecture. A wallet on its own platform would operate alongside UPI rails rather than inside a bank’s structured product. For investors, it signals a parallel growth engine that could cushion Paytm against regulatory shocks in the payments space and accelerate transaction growth among merchants who already rely on Paytm’s ecosystem. For retail investors across India, tracking this development is essential, as wallet adoption and merchant payments can translate into higher monetization opportunities over time.
What The Paytm PPI Licence Means For Wallet Services
Primarily, the paytm ppi licence would enable One97 to independently issue prepaid payment instruments and expand its digital payment offerings beyond UPI-based services. Users could load funds into a Paytm wallet and use the balance for merchant payments, utility bill settlements, and other eligible digital transactions. In a prepaid wallet, funds are deposited in advance, which gives the wallet operator a reservoir of liquidity for payment settlements; this is different from a bank account that holds customer deposits with a different regulatory regime.
With a wallet on its own platform, Paytm would have a direct line to merchants and customers, reducing dependence on a payments bank structure. The wallet would complement existing offerings and help diversify payment options for consumers–an outcome that can accelerate merchant adoption and improve cash-flow for Paytm's ecosystem. The paytm digital wallet would join UPI as a payment option, enabling more flexible customer choices and enabling Paytm to widen its merchant footprint.
RBI Review Timeline For The Paytm PPI Licence
The RBI will review the application before deciding on the licence. Until then, Paytm will continue operating its payment services through partner banks to avoid disruption for users and sellers. The regulator has previously shown that licensing decisions hinge on compliance with licensing conditions and robust governance; the paytm ppi licence decision will be judged in that light. Investors should monitor RBI's communications and the regulatory timeline, as the decision could align with policy trends in digital wallets and payments infrastructure.
Background: RBI Revoked Paytm Payments Bank Licence In April 2026
Paytm Payments Bank had its licence revoked in April 2026 due to non-compliance with licensing conditions; the regulator noted liquidity to return deposits in liquidation. This backdrop matters because it explains why One97 Communications pursued a PPI Licence as a way to bring wallet services back under a company-controlled framework. During this period, restrictions on onboarding new customers and tighter supervisory measures kept Paytm enterprise operations under close watch. After the decision, One97 Communications concentrated on uninterrupted payment service with the participation of several banks, enabling both users and sellers to use UPI without interruptions.
Diversification Of Payments And The Potential Of A Paytm Digital Wallet
Diversifying payment rails is central to the Paytm strategy. The paytm ppi licence can restore wallet services on Paytm’s platform, providing an additional payment option alongside UPI and strengthening the merchant ecosystem. Consumers benefit from having multiple payment choices; wallet services would complement existing offerings and could accelerate merchant adoption and wallet-based transactions. In a market where wallet news and Paytm wallet news influence sentiment, a direct Paytm digital wallet could help the ecosystem to minimize friction in everyday payments. The wallet's revival would align with Paytm's broader digital strategy and could drive incremental volumes as merchants look for flexible settlement terms and improved customer experiences.
Market Implications For Retail Investors And The One97 Communications Stock Price
From a retail investor perspective, the wallet revival could influence Paytm's growth trajectory and the one97 communications stock price. The wallet revival would reintroduce a cash-in wallet that can drive merchant payments and digital services, potentially increasing user engagement and transaction volumes. However, until the RBI approves the PPI licence, Paytm must operate its wallet services through partner banks, limiting direct control over funds while preserving service continuity across the ecosystem. Observers also track paytm wallet news and how the wallet’s revival could affect the broader Paytm ecosystem. For investors, it’s important to recognize that stock price moves can reflect both regulatory risk and execution risk–this is where credible research tools and diversified reading help. Swastika's Sarthi AI stock assistant can provide ongoing insights into relevant stocks and indices.
The Path Forward: Regulatory Timelines, Risks, And What Investors Should Watch
Investors should anticipate a regulatory timeline and the risk that approval might be delayed or revised. The Paytm PPI Licence decision will hinge on RBI’s assessment of compliance, governance, liquidity, and risk mitigation. A favourable outcome could accelerate Paytm’s wallet monetization and reassure merchants about the resilience of digital payments; an adverse outcome could push the wallet revival further into the future. The dynamic underscores the value of tracking credible research tools and staying aligned with your risk tolerance; consider using Swastika's Sarthi AI stock assistant for ongoing updates and stock-level insights: Swastika's Sarthi AI stock assistant for ongoing updates.
Frequently Asked Questions
What is the Paytm PPI Licence and why is RBI involved?
The Paytm PPI Licence is a Prepaid Payment Instrument licence that One97 Communications has applied for with the RBI to issue prepaid instruments and operate a wallet on its own platform, alongside existing UPI services.
What happens if RBI approves the Paytm PPI Licence?
If approved, Paytm can resurrect its digital wallet on its own firm and operate wallet services directly, with the ability to load funds and use them for merchant payments, utility bills, and other eligible digital transactions, while continuing to offer UPI payments through partner banks.
Why was Paytm Payments Bank's license revoked in 2026?
The licence was revoked in April 2026 due to non-compliance with licensing conditions; the regulator noted liquidity to return deposits in liquidation.
How could the PPI Licence affect one97 communications stock price?
A wallet revival and diversification of payments could positively influence growth metrics and investor sentiment, potentially impacting one97 communications stock price, but the actual move depends on RBI approval and execution.
Where can investors find stock-level analysis on Paytm and One97?
Investors can use credible broker research and tools like Swastika's Sarthi AI stock assistant for institutional-level insights on relevant stocks and indices.
Conclusion
For the retail investor today, the paytm ppi licence decision signals a potential re-aggregation of Paytm's payments business under its own wallet. If approved, Paytm could re-expand wallet-scale monetization, offer more payment flexibility to merchants, and better compete with other digital wallets in India, potentially affecting the scale of Paytm's ecosystem and its stock dynamics.
Big Budget


Popular Articles




.avif)
.avif)

.avif)



START YOUR INVESTMENT JOURNEY
Get personalized advice from our experts
- Dedicated RM Support
- Smooth and Fast Trading App
