


Icici Bank Share Price Outlook: Motilal Oswal's Nine-Bank Upside Preview Ahead Of Q1 Results



Key Takeaways
- Motilal Oswal flags nine bank stocks with notable upside before Q1 results.
- icici bank share price context centers ICICI Bank's target at Rs 1,750, about 24% upside.
- HDFC Bank leads with 36% upside to Rs 1,110, while AU Small Finance Bank offers 23% upside to Rs 1,275.
- The nine-bank list also includes Bandhan Bank, Kotak Mahindra Bank, Federal Bank, DCB Bank, Equitas Small Finance Bank, and RBL Bank.
With Q1 results looming, a select group of Indian banks is drawing investor attention. The icici bank share price narrative could move with earnings and policy cues as Motilal Oswal maps an upside path across nine lenders. The note pegs ICICI Bank at Rs 1,750, signaling roughly 24% upside from current levels, while HDFC Bank is seen at Rs 1,110, implying about 36% upside. For retail investors, this is more than a list of targets; it's a framework to gauge risk, timing, and portfolio impact.
Icici Bank Share Price Outlook Across Nine Bank Stocks Ahead Of Q1
The nine banks covered span large private franchises to niche lenders. The primary names in the Motilal Oswal list are ICICI Bank, HDFC Bank, Bandhan Bank, Kotak Mahindra Bank, Federal Bank, DCB Bank, Equitas Small Finance Bank, AU Small Finance Bank, and RBL Bank. Each stock is assigned a target price and Upside number, painting a spectrum of risk-reward in the run-up to Q1 results.
From a price-action standpoint, the icici bank stock price has a central role to play in this narrative. A strong show by ICICI Bank could lift broader sentiment on private sector banks, while softer numbers from any of the other banks could cap gains. Investors should weigh earnings quality, loan growth, asset quality, and regional mix before drawing conclusions.
| Bank | Target Price (Rs) | Upside From Current |
|---|---|---|
| ICICI Bank | 1,750 | 24% |
| HDFC Bank | 1,110 | 36% |
| Bandhan Bank | 225 | 8% |
| Kotak Mahindra Bank | 470 | 24% |
| Federal Bank | 375 | 14% |
| DCB Bank | 235 | 25% |
| Equitas Small Finance Bank | 90 | 13% |
| AU Small Finance Bank | 1,275 | 23% |
| RBL Bank | 400 | 6% |
The table above consolidates Motilal Oswal’s price targets and the corresponding upside for each name. The emphasis is not merely on selecting a single winner but on understanding where the risk-reward tilts in a volatile rate and growth environment. The HDFC Bank line stands out with the highest upside, while mid and small-cap banks offer a different risk-return profile worth monitoring.
Bandhan bank stock price, Federal bank stock price, Kotak Mahindra Bank stock price, and RBL Bank stock price are all part of this upside mosaic. Bandhan bank stock price shows a comparatively modest ~8% upside, while the federal bank stock price context points to around 14% upside. Kotak mahindra bank stock price targets Rs 470 with about 24% upside, and rbl bank stock price targets Rs 400 with about 6% upside. DCB Bank, Equitas Small Finance Bank, and AU Small Finance Bank round out the spectrum with 25%, 13%, and 23% upside respectively.
ICICI Bank Share Price Dynamics And Investment Implications
The icici bank stock price narrative is not isolated. ICICI Bank’s target implies a 24% upside from current levels, reinforcing the idea that large private banks can offer meaningful upside even when the macro backdrop remains nuanced. Retail investors should watch not only the headline targets but the accompanying qualitative drivers: loan growth traction, overall asset quality, deposit mobilization, and the management’s commentary on calibrating risk in a rising-rate environment.
The broader context suggests that ICICI Bank’s share-price dynamics could act as a barometer for the sector. A constructive Q1 read could lift sentiment for other private banks, including Kotak Mahindra Bank and HDFC Bank, while any negative surprise might prompt material price corrections in several names. In this environment, it’s prudent to view the nine-bank list as a structured ladder of opportunities rather than a single speculative bet.
Bandhan Bank Stock Price And Upside
Bandhan bank stock price is pegged at Rs 225, which implies about 8% upside from here. This creates a contrasting risk-reward to the high-side stories in the same note. Bandhan Bank remains a mid-cap play with a more concentrated exposure to particular geographies and loan segments, which can translate into higher sensitivity to microeconomic developments. Investors should consider this in conjunction with their broader portfolio allocation and risk tolerance.
Federal Bank Stock Price Outlook And Risk Factors
The federal bank stock price is targeted at Rs 375, signaling about 14% upside. Federal Bank’s niche presence in the southern and western markets, along with its SME and retail loan mix, shapes a different risk profile from the blue-chip peers. The upside here hinges on steady cost of funds, asset quality, and scalable digital initiatives that widen its customer base without compromising risk controls.
Kotak Mahindra Bank Stock Price And Upside Comparison
The kotak mahindra bank stock price target stands at Rs 470, implying about 24% upside. Kotak Mahindra Bank’s diversified business model–commercial banking, investment banking, and asset management–offers multiple levers to support earnings growth even if a single segment underperforms. For investors, Kotak provides a counterweight to the more debt-heavy or rate-sensitive books that some peers carry.
DCB Bank Stock Price And Breakout Potential
DCB Bank stock price is targeted at Rs 235 with a strong 25% upside. This mid-cap bank offers a different dynamic: a leaner balance sheet, leaner cost structure, and the potential for efficiency gains as it grows its branch and digital footprint. A successful execution on risk controls and platform expansion could be the catalyst for this name to re-rate in the coming quarters.
Equitas Small Finance Bank Stock Price And Upside
Equitas Small Finance Bank stock price targets Rs 90, for about 13% upside. Equitas represents a niche lender with a focus on small-ticket retail loans and microfinance-like products in select geographies. The upside here depends on credit quality stabilization and geographic expansion that translates into higher disbursement growth without compromising risk discipline.
AU Small Finance Bank Stock Price And Upside
AU Small Finance Bank stock price target is Rs 1,275, implying 23% upside. AU is often viewed as a growth proxy in the small and mid-sized bank space, driven by a mix of consumer loans and SME lending. The stock’s performance will hinge on funding costs, asset quality, and the ability to scale digital distribution in a cost-efficient manner.
RBL Bank Stock Price Outlook And Key Triggers
The rbl bank stock price target sits at Rs 400 with about 6% upside. RBL Bank is a smaller private lender with a history of sensitive cycles and higher funding costs. The key triggers here include a gradual improvement in asset quality, cost efficiency, and stable liability franchise growth that could unlock more upside if macro conditions stay supportive.
For investors seeking deeper, institutional-level insights or personalized stock guidance, Swastika offers Swastika's Sarthi AI stock assistant.
Frequently Asked Questions
What is Motilal Oswal's target price for ICICI Bank and the implied upside?
Motilal Oswal assigns ICICI Bank a target price of Rs 1,750, implying about 24% upside from current levels.
Which bank has the highest upside among Motilal Oswal's nine-bank list?
HDFC Bank shows the highest upside at about 36% with a target price of Rs 1,110.
What is the target price and upside for AU Small Finance Bank according to the note?
AU Small Finance Bank has a target price of Rs 1,275, implying about 23% upside.
What is the target price and upside for DCB Bank?
DCB Bank has a target price of Rs 235, implying about 25% upside.
What is the target price for Bandhan Bank and its upside?
Bandhan Bank has a target price of Rs 225, with around 8% upside.
Conclusion
What Motilal Oswal’s nine-bank upside map really offers the retail investor is a structured way to frame risk and opportunity across both mega-cap and niche lenders. The standout upside belongs to HDFC Bank at 36%, but ICICI Bank’s 24% upside and the diversified profiles of Kotak Mahindra, AU Small Finance Bank, and DCB Bank provide compelling alternatives for a balanced bank exposure. The key takeaway is not to chase a single headline but to build a blended view that acknowledges sector dynamics, earnings trajectories, and quality of risk management in a rising-rate environment.
Open your trading and demat account here
Reference :
1 : Economictimes
Latest Articles
Icici Bank Share Price Outlook: Motilal Oswal's Nine-Bank Upside Preview Ahead Of Q1 Results


Key Takeaways
- Motilal Oswal flags nine bank stocks with notable upside before Q1 results.
- icici bank share price context centers ICICI Bank's target at Rs 1,750, about 24% upside.
- HDFC Bank leads with 36% upside to Rs 1,110, while AU Small Finance Bank offers 23% upside to Rs 1,275.
- The nine-bank list also includes Bandhan Bank, Kotak Mahindra Bank, Federal Bank, DCB Bank, Equitas Small Finance Bank, and RBL Bank.
With Q1 results looming, a select group of Indian banks is drawing investor attention. The icici bank share price narrative could move with earnings and policy cues as Motilal Oswal maps an upside path across nine lenders. The note pegs ICICI Bank at Rs 1,750, signaling roughly 24% upside from current levels, while HDFC Bank is seen at Rs 1,110, implying about 36% upside. For retail investors, this is more than a list of targets; it's a framework to gauge risk, timing, and portfolio impact.
Icici Bank Share Price Outlook Across Nine Bank Stocks Ahead Of Q1
The nine banks covered span large private franchises to niche lenders. The primary names in the Motilal Oswal list are ICICI Bank, HDFC Bank, Bandhan Bank, Kotak Mahindra Bank, Federal Bank, DCB Bank, Equitas Small Finance Bank, AU Small Finance Bank, and RBL Bank. Each stock is assigned a target price and Upside number, painting a spectrum of risk-reward in the run-up to Q1 results.
From a price-action standpoint, the icici bank stock price has a central role to play in this narrative. A strong show by ICICI Bank could lift broader sentiment on private sector banks, while softer numbers from any of the other banks could cap gains. Investors should weigh earnings quality, loan growth, asset quality, and regional mix before drawing conclusions.
| Bank | Target Price (Rs) | Upside From Current |
|---|---|---|
| ICICI Bank | 1,750 | 24% |
| HDFC Bank | 1,110 | 36% |
| Bandhan Bank | 225 | 8% |
| Kotak Mahindra Bank | 470 | 24% |
| Federal Bank | 375 | 14% |
| DCB Bank | 235 | 25% |
| Equitas Small Finance Bank | 90 | 13% |
| AU Small Finance Bank | 1,275 | 23% |
| RBL Bank | 400 | 6% |
The table above consolidates Motilal Oswal’s price targets and the corresponding upside for each name. The emphasis is not merely on selecting a single winner but on understanding where the risk-reward tilts in a volatile rate and growth environment. The HDFC Bank line stands out with the highest upside, while mid and small-cap banks offer a different risk-return profile worth monitoring.
Bandhan bank stock price, Federal bank stock price, Kotak Mahindra Bank stock price, and RBL Bank stock price are all part of this upside mosaic. Bandhan bank stock price shows a comparatively modest ~8% upside, while the federal bank stock price context points to around 14% upside. Kotak mahindra bank stock price targets Rs 470 with about 24% upside, and rbl bank stock price targets Rs 400 with about 6% upside. DCB Bank, Equitas Small Finance Bank, and AU Small Finance Bank round out the spectrum with 25%, 13%, and 23% upside respectively.
ICICI Bank Share Price Dynamics And Investment Implications
The icici bank stock price narrative is not isolated. ICICI Bank’s target implies a 24% upside from current levels, reinforcing the idea that large private banks can offer meaningful upside even when the macro backdrop remains nuanced. Retail investors should watch not only the headline targets but the accompanying qualitative drivers: loan growth traction, overall asset quality, deposit mobilization, and the management’s commentary on calibrating risk in a rising-rate environment.
The broader context suggests that ICICI Bank’s share-price dynamics could act as a barometer for the sector. A constructive Q1 read could lift sentiment for other private banks, including Kotak Mahindra Bank and HDFC Bank, while any negative surprise might prompt material price corrections in several names. In this environment, it’s prudent to view the nine-bank list as a structured ladder of opportunities rather than a single speculative bet.
Bandhan Bank Stock Price And Upside
Bandhan bank stock price is pegged at Rs 225, which implies about 8% upside from here. This creates a contrasting risk-reward to the high-side stories in the same note. Bandhan Bank remains a mid-cap play with a more concentrated exposure to particular geographies and loan segments, which can translate into higher sensitivity to microeconomic developments. Investors should consider this in conjunction with their broader portfolio allocation and risk tolerance.
Federal Bank Stock Price Outlook And Risk Factors
The federal bank stock price is targeted at Rs 375, signaling about 14% upside. Federal Bank’s niche presence in the southern and western markets, along with its SME and retail loan mix, shapes a different risk profile from the blue-chip peers. The upside here hinges on steady cost of funds, asset quality, and scalable digital initiatives that widen its customer base without compromising risk controls.
Kotak Mahindra Bank Stock Price And Upside Comparison
The kotak mahindra bank stock price target stands at Rs 470, implying about 24% upside. Kotak Mahindra Bank’s diversified business model–commercial banking, investment banking, and asset management–offers multiple levers to support earnings growth even if a single segment underperforms. For investors, Kotak provides a counterweight to the more debt-heavy or rate-sensitive books that some peers carry.
DCB Bank Stock Price And Breakout Potential
DCB Bank stock price is targeted at Rs 235 with a strong 25% upside. This mid-cap bank offers a different dynamic: a leaner balance sheet, leaner cost structure, and the potential for efficiency gains as it grows its branch and digital footprint. A successful execution on risk controls and platform expansion could be the catalyst for this name to re-rate in the coming quarters.
Equitas Small Finance Bank Stock Price And Upside
Equitas Small Finance Bank stock price targets Rs 90, for about 13% upside. Equitas represents a niche lender with a focus on small-ticket retail loans and microfinance-like products in select geographies. The upside here depends on credit quality stabilization and geographic expansion that translates into higher disbursement growth without compromising risk discipline.
AU Small Finance Bank Stock Price And Upside
AU Small Finance Bank stock price target is Rs 1,275, implying 23% upside. AU is often viewed as a growth proxy in the small and mid-sized bank space, driven by a mix of consumer loans and SME lending. The stock’s performance will hinge on funding costs, asset quality, and the ability to scale digital distribution in a cost-efficient manner.
RBL Bank Stock Price Outlook And Key Triggers
The rbl bank stock price target sits at Rs 400 with about 6% upside. RBL Bank is a smaller private lender with a history of sensitive cycles and higher funding costs. The key triggers here include a gradual improvement in asset quality, cost efficiency, and stable liability franchise growth that could unlock more upside if macro conditions stay supportive.
For investors seeking deeper, institutional-level insights or personalized stock guidance, Swastika offers Swastika's Sarthi AI stock assistant.
Frequently Asked Questions
What is Motilal Oswal's target price for ICICI Bank and the implied upside?
Motilal Oswal assigns ICICI Bank a target price of Rs 1,750, implying about 24% upside from current levels.
Which bank has the highest upside among Motilal Oswal's nine-bank list?
HDFC Bank shows the highest upside at about 36% with a target price of Rs 1,110.
What is the target price and upside for AU Small Finance Bank according to the note?
AU Small Finance Bank has a target price of Rs 1,275, implying about 23% upside.
What is the target price and upside for DCB Bank?
DCB Bank has a target price of Rs 235, implying about 25% upside.
What is the target price for Bandhan Bank and its upside?
Bandhan Bank has a target price of Rs 225, with around 8% upside.
Conclusion
What Motilal Oswal’s nine-bank upside map really offers the retail investor is a structured way to frame risk and opportunity across both mega-cap and niche lenders. The standout upside belongs to HDFC Bank at 36%, but ICICI Bank’s 24% upside and the diversified profiles of Kotak Mahindra, AU Small Finance Bank, and DCB Bank provide compelling alternatives for a balanced bank exposure. The key takeaway is not to chase a single headline but to build a blended view that acknowledges sector dynamics, earnings trajectories, and quality of risk management in a rising-rate environment.
Open your trading and demat account here
Reference :
1 : Economictimes
Adani Green Energy Stock Latest News And The MSCI India Rebalance Outlook
Key Takeaways
- MSCI's August rebalance could attract about $2.3 billion in passive inflows into Indian equities.
- Up to 12 inclusions and 3 exclusions are possible, with Adani Green Energy stock and Groww among entrants.
- Exclusions like SBI Cards and Astral could trigger meaningful outflows; changes are announced after August 12 and implemented from August 31.
- Retail investors should monitor shifts and consider strategic steps using institutional-grade tools such as Swastika's Sarthi AI stock assistant.
Consider this: adani green energy stock latest news headlines are not mere noise for traders; they hint at sector shifts as MSCI's August rebalance looms. The move could unlock about $2.3 billion in passive inflows into Indian equities, with as many as 12 additions and three removals likely in the updated MSCI India Standard Index. For retail investors, the changes could tilt which names gain momentum and which slip in the weeks ahead.
Adani Green Energy Stock Latest News: What The MSCI Rebalance Could Mean For The Index
MSCI's August index review could nominate Adani Green Energy among likely entrants, along with adani energy solutions stock, Groww, and others. The broad backdrop is that the number of changes could be as many as 12 inclusions and three exclusions, significantly altering the index composition and triggering flows from global passive investors tracking MSCI benchmarks.
Among the likely entrants, Adani Green Energy is prominent, with inflows estimated around $773 million if included. Adani Energy Solutions stock is also among the frontrunners. Groww’s addition could bring approximately $821 million in passive inflows. Ather Energy is seen as a medium-probability contender, contingent on improvement in its free-float-adjusted market capitalisation during the observation period. The migration could bring passive inflows of about $554 million into Laurus Labs and $285 million into Biocon if included. In addition, Coforge inflows are estimated at about $567 million if Coforge is added.
On the other side, the cycle includes potential exclusions: SBI Cards share price could see outflows exceeding $140 million, and Astral stock price around $138 million could be moved out of the index. Balkrishna Industries could also face a low-probability exit. India currently has around 165 constituents in the MSCI India Standard Index, with a total market capitalisation of roughly $3.2 trillion.
MSCI India Standard Index Rebalance: Timelines, Scope And What To Expect
The official changes are scheduled to be announced after market hours on August 12 and implemented from August 31, underlining the importance of the next price moves for Indian equities. These changes are expected to significantly alter the index composition and trigger fund flows from global passive investors tracking MSCI benchmarks. In terms of scale, the overall passive inflows could reach about $2.3 billion, distributed across inclusions like Groww and Adani Green Energy stock among others, depending on the final selections.
Investors should anticipate potential volatility around the official announcement window and the subsequent implementation window. If a name like Coforge is included, inflows around $567 million could materialise; if SBI Cards is excluded, the outflow could be over $140 million. The index's breadth, currently around 165 constituents, could shift before the final changes take effect. The total market capitalisation of the MSCI India Standard Index is around $3.2 trillion, reflecting its size and the liquidity these inflows could influence.
Which Stocks Could Enter The MSCI India Standard Index In August? Adani Green Energy, Adani Energy Solutions, Groww And More
Beyond Adani Green Energy stock and adani energy solutions stock, the August review flags several potential entrants: Groww, Laurus Labs, Biocon, Coforge, and Ather Energy. Each name is subject to the free-float-adjusted market-cap threshold and other index rules. Groww’s inclusion could bring about $821 million in passive inflows, while Laurus Labs migration could attract roughly $554 million and Biocon about $285 million. Coforge inflows are estimated at $567 million if included. The prospect of Ather Energy’s inclusion depends on improvements in free-float metrics during the observation period.
On the exclusion side, SBI Cards and Astral are the most prominent candidates, with potential outflows of around $140 million and $138 million respectively. Balkrishna Industries could also face a low-probability exit. India currently has around 165 constituents in the MSCI India Standard Index, and the index’s total market capitalisation remains around $3.2 trillion.
Potential Inflows And Outflows By Stock In The Rebalance (With Detailed Figures)
Detailed inflow estimates reflect the weight each name would carry in the MSCI India Standard Index upon inclusion. For example, Groww could attract about $821 million in passive inflows if included, while Adani Green Energy stock is expected to draw roughly $773 million. Laurus Labs migration could contribute around $554 million, Biocon around $285 million, and Coforge around $567 million if included. In terms of outflows, SBI Cards share price could see more than $140 million exiting the index upon exclusion, while Astral stock price could be around $138 million outflow. The broad total remains contingent on the final list of inclusions and exclusions announced on August 12 and implemented by August 31.
The pan-India scope means that sector weights and liquidity could shift in meaningful ways. While these numbers illustrate potential flows, actual results depend on ongoing fund tracking and passive fund manager allocations. The expectation that 12 inclusions and 3 exclusions are possible provides a framework for allocating investments and evaluating risk around the rebalancing window.
What Retail Investors Should Do Now: Strategy And Resources
Retail investors should approach the MSCI rebalancing with a considered plan rather than a speculative frenzy. Review current holdings with an eye toward entrants and exclusions flagged for August, and assess how a potential change in the index’s composition could influence liquidity in your portfolio. If you hold exposure to names expected to be included – such as adani green energy stock or the other entrants – consider a phased approach to adjust exposures, balancing potential upside with risk controls. Likewise, if your holdings are among those flagged for exclusion, plan a risk-managed exit strategy aligned with your investment horizon.
For a more structured angle on stock-specific opportunities, you can use Swastika’s Sarthi AI stock assistant. Swastika's Sarthi AI stock assistant offers institutional-grade research features that can help translate index-level flows into actionable stock ideas. As you contemplate adjustments, keep in mind that diversification and a disciplined approach to risk management remain central to navigating rebalancing volatility.
Frequently Asked Questions
What triggers the MSCI India Standard Index rebalancing in August 2026?
The August 2026 rebalancing is driven by MSCI's review of the index composition based on updated free float and liquidity criteria. The official changes are scheduled to be announced after market hours on August 12 and implemented from August 31, with up to 12 inclusions and 3 exclusions anticipated.
Which stocks are among the likely entrants in the August review?
Likely entrants include Adani Green Energy, adani energy solutions stock, Groww, and Ather Energy, among others, subject to meeting free-float-adjusted market-cap thresholds. Inflows could be substantial; Adani Green Energy stock inflows are estimated around $773 million, while Groww could attract about $821 million.
What is the total expected passive inflow from the August rebalancing?
The up-to-date estimate from MSCI indicates around $2.3 billion in passive inflows are expected across the rebalancing window.
Which stocks could see outflows due to exclusion?
SBI Cards share price and Astral stock price are among the names facing possible exclusion, with outflows estimated at more than $140 million for SBI Cards and around $138 million for Astral. Balkrishna Industries could also face a low-probability exit.
When should investors monitor the changes and how can they prepare?
Investors should watch the August 12 announcement after market hours and the August 31 implementation. Prepare by reviewing holdings, considering phased adjustments, and leveraging tools like Swastika's Sarthi AI stock assistant for stock-level insights and risk-aware planning.
Conclusion
The MSCI India Standard Index rebalancing could divert up to $2.3 billion in passive inflows into Indian equities, reflecting changes across as many as 12 additions and 3 exclusions. For retail investors, the practical takeaway is to stay updated on the August 12 announcement and the August 31 implementation, align your risk tolerance with the evolving composition, and use a systematic approach to adjust allocations rather than chasing short-term moves.
Open your trading and demat account here
Reference :
Lulu Retail Share Price And Ladakh Apricot Export Leap: A Geo-Strategic Investor Guide
Key Takeaways
- Ladakh's largest-ever apricot export programme kicks off with a 5 MT consignment to UAE and a 1,000 MT export target this season.
- An MoU with Lulu Retail, backed by APEDA and MOFPI, commits to processing, packaging, and marketing Ladakh apricots in international markets.
- Indigenous varieties Raktsey Karpo and Halman are the focus, with a pledge to fair pricing and reduced losses for farmers.
- Investors should monitor Lulu Retail share price as a potential proxy for the international expansion of Ladakh's horticulture exports.
From the high-altitude farms of Ladakh to the bustling markets of the Gulf, a quiet but powerful shift is taking shape in fresh fruit exports. A 5 metric tonnes first consignment of Ladakh apricots to the United Arab Emirates marks the opening act of what is described as Ladakh’s largest-ever fresh apricot export programme. The move is anchored in a Memorandum of Understanding signed with Lulu Retail, the UAE-based global retail conglomerate, and facilitated through APEDA and MOFPI. For investors watching the cross-border flow of commodities and their corporate implications, this development is a meaningful data point for assessing the trajectory of Lulu Retail share price.
At its core, the MoU commits Lulu Retail to procure apricots at harvest from Ladakh farmers and to handle sorting, processing, packaging, transporting and marketing in international markets, all while upholding the identity of Ladakh. The agreement envisions exporting over 1,000 metric tonnes of fresh Ladakhi apricots during the current harvest season, underscoring a quantum leap from the last two years combined, when exports totaled around 1,500 kilograms. The MoU is signed through APEDA (Agricultural and Processed Food Products Export Development Authority) and MOFPI (Ministry of Food Processing Industry) and was formalized in April, with the MoU signing witnessed by Ladakh’s Lieutenant Governor and senior officials.
Ladakh Apricot Export MoU With Lulu Retail: A Geostrategic Pivot For Fresh Produce
This section explains why the MoU represents more than a bilateral procurement deal. It is a strategic move to link Ladakh’s premium apricot varieties with global distribution networks. Ladakh’s administration emphasizes that the MoU aims to minimize losses and ensure fair pricing for farmers, addressing a perennial pain point in seasonal agriculture. The focus on indigenous varieties elevates the narrative: Raktsey Karpo and Halman are prized for flavor, aroma, and shelf-life, and the MoU insists that Lulu Retail preserve the varieties’ identity in packaging and branding in international markets.
First Consignment To UAE: Five Metric Tonnes Mark A Significant Step
The first consignment, weighing 5 metric tonnes, signals a tangible early momentum in Ladakh’s export push. The project’s scale and ambition become more evident when compared with the past two years, during which Ladakh’s fresh apricot exports were a fraction of this new target. By prioritizing harvest-time procurement and seamless logistics–from sorting to processing to final packaging–Lulu Retail aims to deliver premium Ladakhi fruit to international customers while supporting farmers through predictable pricing and reduced post-harvest losses.
Current Season Export Target: 1,000 MT And Beyond
The MoU commits Lulu Retail to procure at least 1,000 MT of apricots this season. This is a substantial step up from the region’s historical export volume and aligns with Ladakh’s objective to scale horticultural exports while maintaining Ladakh’s identity in global markets. APEDA’s facilitation and MOFPI’s regulatory oversight are designed to ensure the export chain remains compliant and efficient–from harvest to global distribution. That this initiative is being described as the current harvest season’s focal project underscores the collaboration’s scale and ambition.
Indigenous Varieties: Raktsey Karpo And Halman
Public communications emphasize that the export programme focuses on Ladakh’s indigenous apricot varieties–Raktsey Karpo and Halman. These varieties are synonymous with Ladakh’s terroir and offer distinct sensory profiles that appeal to discerning international buyers. The MoU’s emphasis on protecting the identity of Ladakh means branding, packaging, and marketing will preserve origin signals, a factor that can influence consumer demand and premium pricing in global markets.
APEDA And MOFPI: The Institutional Backbone Of Ladakh’s Export Push
The export framework relies on the Agricultural and Processed Food Products Export Development Authority (APEDA) to facilitate the export and the Ministry of Food Processing Industry (MOFPI) to oversee policy alignment. This institutional backing is designed to smooth cross-border trade, reduce friction in the supply chain, and create a predictable environment for farmers and exporters. The presence of these institutions also signals a formalized, scalable export programme rather than a one-off shipment.
Farmer Welfare, Pricing Fairness, And Post-Harvest Management
Beyond the quantitative targets, the MoU highlights a commitment to minimizing farmers’ losses and ensuring fair pricing. By assuming responsibility for harvesting procurement, sorting, processing, packaging, and transport, Lulu Retail becomes a critical link in reducing post-harvest spoilage and price volatility for growers. This approach improves risk sharing across the value chain and aligns incentives for higher-quality produce. For investors, this reduces one of the typical sources of revenue volatility in agricultural commodities–that is, the mismatch between harvest timing and market access.
Lulu Retail Share Price: Market Signals From A Global Export Push
From an investor perspective, a development like this can influence a consumer-facing retailer’s share price through several channels. Lulu Retail share price could reflect improved margins and brand equity from this international expansion. Global expansion into premium fruit categories enhances brand equity, potential margin expansion, and diversification of revenue streams beyond domestic markets. While the direct impact on Lulu Retail share price will depend on execution, logistics, and global demand, the MoU’s scale implies a meaningful narrative that investors will monitor alongside quarterly results and commodity price dynamics. In 2026, the Ladakh administration’s emphasis on preserving Ladakh’s identity and the robust institutional backing create a favorable backdrop for long-term, high-value export relationships. To stay ahead of the curve, investors can explore the strategic implications with Swastika’s Swastika's Sarthi AI stock assistant, which offers access to institutional-grade research on stocks and indices.
Farmers And Markets: A Practical Mental Model For Investors
As Ladakh scales its apricot export programme, investors should consider a practical mental model: evaluate the strength of origin signals (the Ladakh identity and the Raktsey Karpo and Halman varieties), the stability of cross-border supply chains (APEDA and MOFPI involvement), and the quality-and-premium pricing dynamics in international markets. This approach helps investors gauge whether Lulu Retail share price is supported by a sustainable, scalable export strategy rather than a one-off event. The emphasis on minimizing losses and fair pricing also provides a cushion against typical commodity-price volatility in agricultural segments.
Frequently Asked Questions
What is the MoU between the Ladakh administration and Lulu Retail?
An MoU signed through APEDA and MOFPI commits Lulu Retail to procure at least 1,000 MT of Ladakh apricots this season, to process, package and market the product in international markets, while upholding the identity of Ladakh and ensuring fair pricing for farmers.
How much apricots were in the first consignment to UAE?
Five metric tonnes (5 MT) of Ladakh apricots were exported as the first consignment.
Which indigenous Ladakh apricot varieties are prioritized in the export programme?
Raktsey Karpo and Halman are the indigenous varieties highlighted in Ladakh’s premium apricot export initiative.
Who signed the MoU and when was it published?
The MoU was signed by Bhupesh Chaudhary (Secretary, Horticulture, UT Administration) and Salim MA (Group Director- Global Operations, Lulu Retail) in the presence of Lieutenant Governor Vinai Kumar Saxena, with the article published on April 16, 2026.
What is the export target for the current season and what is the aim for farmers?
The MoU targets exporting over 1,000 MT this season, with a commitment to minimize losses and ensure fair pricing for Ladakh farmers.
Conclusion
The MoU’s scope and execution plan frame Ladakh’s apricot story as a long-running, high-value export programme that aligns with India’s broader push into premium farm produce. For the retail investor, the key takeaway is to watch how this cross-border initiative translates into brand equity, margin expansion, and resilience across the supply chain. The next step is to monitor Lulu Retail’s execution in harvest procurement, processing efficiency, and international-market penetration, while evaluating how the 1,000 MT target translates into revenue growth and shareholder value.
Open your trading and demat account here
Reference :
1 : Thehindu
Artson Engineering Share Price After Q1 FY27: A Retail Investor's Guide
Key Takeaways
- artson engineering share price watchers faced a sharp Q1 FY27 update: standalone net loss of Rs 0.41 crore.
- Revenue from operations declined 41.59% YoY to Rs 26.13 crore, while total expenses fell 38.31% to Rs 27.32 crore.
- Pre-tax loss stood at Rs 0.77 crore, reversing last year's Rs 0.47 crore profit.
- Retail investors should watch for margin recovery signals and the order pipeline, using Swastika's Sarthi AI stock assistant for deeper analysis.
artson engineering share price watchers had a sharp question after Q1 FY27 results: is this a blip or a trend for this oil and gas EPC player? A standalone net loss of Rs 0.41 crore, alongside revenue of Rs 26.13 crore and expenses of Rs 27.32 crore, paints a nuanced picture. The company designs, engineers, procures, and constructs tankages, piping, and other mechanical packages and runs two manufacturing facilities in Nashik and Nagpur. For retail investors, the initial signal is that artson stock may reflect broader cost and project-delivery dynamics rather than a simple revenue downturn. This analysis unpacks how those dynamics tie back to the artson engineering share price trajectory and what to watch next. This keyword has a measurable interest level with an estimated 2,900 searches per month, signaling a meaningful retail curiosity around this stock story.
Artson Engineering Share Price After Q1 FY27: Key Numbers That Matter
The quarter delivered a standalone net loss of Rs 0.41 crore for Q1 FY27, down from a net profit of Rs 0.22 crore in the corresponding quarter of the previous fiscal year. Revenue from operations declined 41.59% YoY to Rs 26.13 crore, while total expenses fell 38.31% YoY to Rs 27.32 crore. The cost of materials consumed declined 48.42% to Rs 6.53 crore, and project execution expenses fell 40.16% to Rs 10.65 crore. Employee benefits expense remained flat at Rs 4.84 crore, while finance costs declined 24.24% YoY to Rs 1.75 crore. The company reported a pre-tax loss of Rs 0.77 crore in Q1 FY27, compared with a profit before tax of Rs 0.47 crore in the same quarter last year.
| Metric | Q1 FY27 | YoY Change |
|---|---|---|
| Revenue from operations | Rs 26.13 crore | -41.59% |
| Total expenses | Rs 27.32 crore | -38.31% |
| Cost of materials consumed | Rs 6.53 crore | -48.42% |
| Project execution expenses | Rs 10.65 crore | -40.16% |
| Employee benefits expense | Rs 4.84 crore | Flat |
| Finance costs | Rs 1.75 crore | -24.24% |
| Net loss | Rs 0.41 crore (standalone) | – |
| Pre-tax | Rs 0.77 crore loss | – |
Artson Engineering is a design, engineering, procurement, and construction company operating in the oil, gas, and hydrocarbon processing industry, with two manufacturing facilities in Nashik and Nagpur. The business focuses on tankages, piping, and other mechanical packages, and also engages in structural fabrication works. The quarter's numbers underscore the sensitivity of this niche EPC segment to order inflows and project mobilization timelines. The results also reflect broader cyclicality in capex-linked sectors where project awards drive revenue in bursts rather than at a steady pace.
For readers seeking deeper stock-level insights, consider Swastika's research resources and Swastika's Sarthi AI stock assistant, a tool that can help you model scenarios around artson stock performance given shifts in orders, margins, and capital costs.
Why Revenue Dropped 41.59% For Artson Engineering In Q1 FY27
Revenue declined to Rs 26.13 crore in Q1 FY27, a YoY drop of 41.59%. The data indicate that revenue contraction occurred even as several cost lines fell. The explicit drivers of the revenue miss are not detailed in the quarter’s disclosures, but the oil, gas, and hydrocarbon processing EPC market is known for lumpy orders and episodic mobilizations. The quarter’s numbers suggest that top-line weakness was the dominant driver of the results, not merely a one-off event. A slower project pipeline or delays in mobilizations could have contributed to the steep revenue fall.
Alongside the revenue trend, costs moved decisively lower: materials consumed fell 48.42% to Rs 6.53 crore, and project execution expenses fell 40.16% to Rs 10.65 crore. Finance costs declined 24.24% to Rs 1.75 crore, while employee benefits expense remained flat at Rs 4.84 crore. The net effect was a pre-tax loss of Rs 0.77 crore, a swing from the prior year’s Rs 0.47 crore profit before tax. These shifts illustrate a deliberate cost-reduction posture that, while necessary, did not rescue profitability in the quarter.
Cost Control And Expense Trends In Q1 FY27 For Artson Engineering
Looking under the hood, total expenses declined 38.31% YoY to Rs 27.32 crore, signaling aggressive cost management in response to weaker topline. The cost of materials consumed dropped 48.42% to Rs 6.53 crore, suggesting procurement discipline or reduced material usage as projects paused or slowed. Project execution expenses decreased 40.16% to Rs 10.65 crore, which could reflect fewer active projects or extended cycle times. Finance costs declined 24.24% to Rs 1.75 crore, helping to preserve cash flow, while employee benefits expense stayed flat at Rs 4.84 crore, implying limited scope for workforce reductions in this quarter. Despite these efforts, the company posted a pre-tax loss of Rs 0.77 crore as revenue did not keep pace with the cost reductions. This dynamic highlights the classic dilemma in EPC firms: can fixed cost structures sustain profitability when revenue is under pressure?
What The Pre-Tax Loss Of Rs 0.77 Crore Means For Artson Engineering
The swing to a pre-tax loss of Rs 0.77 crore, from a Rs 0.47 crore before-tax profit in the same period a year earlier, underscores the difficulty of turning cost savings into earnings when top-line growth is weak. In practical terms, even with lower costs, profitability hinges on securing and recognizing revenue from larger or more timely projects. For artson stock, this means that near-term price action may reflect the balance between cautious market sentiment about order inflows and the market’s expectation of a rebound in project activity. If the pipeline improves and mobilizations accelerate, margins could start to recover; until then, the stock’s momentum may remain sensitive to quarterly order-book developments and macro-capex cycles in the sector.
Artson Engineering's Operational Profile In Oil, Gas And Hydrocarbon Processing
Artson Engineering operates as a design, engineering, procurement, and construction company focused on oil, gas, and hydrocarbon processing facilities. The key specialization areas include tankages, piping, and other mechanical packages, with structural fabrication as another core capability. The firm runs two manufacturing facilities–one in Nashik and another in Nagpur–grinding out a portfolio of mechanical packages and structural work. This profile matters because execution quality, supplier management, and engineering rigor directly influence project delivery times and margins in this sector. The current quarter’s results should be weighed against cyclical capex patterns in oil and gas and the potential for order inflows to rebound as energy demand and project activity recover.
How To Track The Artson Engineering Share Price And Performance Going Forward
Investors should monitor several signals to gauge the trajectory of artson stock and the broader artson engineering share price. First, keep an eye on order inflows and the pace of project mobilizations; the revenue line in EPC plays is typically lumpy and highly sensitive to new awards. Second, assess margin stabilization as the company iterates on its cost base and as the project mix evolves. Third, watch cash flow and financing costs, as tighter liquidity conditions can affect profitability even if revenue begins to recover. Fourth, read management commentary on the status of major ongoing projects and any guidance on the pipeline. Finally, consider macro cycles in the oil and gas sector, which can amplify stock volatility alongside the broader market narratives around energy capex. If you want deeper, stock-specific insights, you can explore Swastika's Sarthi AI stock assistant for scenario planning and risk assessment under different price and demand environments.
Frequently Asked Questions
What Was Artson Engineering Standalone Net Loss In Q1 FY27?
Rs 0.41 crore.
What Was Artson Engineering'S Revenue In Q1 FY27?
Rs 26.13 crore, down 41.59% YoY.
What Happened To Artson Engineering'S Total Expenses In Q1 FY27?
Total expenses were Rs 27.32 crore, down 38.31% YoY.
What Is Artson Engineering'S Pre-Tax Result In Q1 FY27?
Pre-tax loss of Rs 0.77 crore, versus Rs 0.47 crore profit in the previous year.
Where Does Artson Engineering Operate And What Is Its Business Focus?
Artson Engineering operates in oil, gas, and hydrocarbon processing EPC, specializing in tankages, piping, and other mechanical packages; It has two manufacturing facilities in Nashik and Nagpur.
Conclusion
In practice, the artson engineering share price journey over the next few quarters will hinge on actual order inflows and the company’s ability to translate cost savings into bottom-line gains. A practical mental model is to compare quarterly revenue run-rate against fixed-cost coverage and to monitor any improvement in project execution efficiency. If you want deeper, stock-specific insights, you can explore Swastika's Sarthi AI stock assistant for scenario planning and drilling into margins under different oil-price and capex cycles.
Open your trading and demat account here
Reference :
Laser Power Share Price Outlook: Debut And Growth For Laser Power & Infra
Key Takeaways
- Order book stands at Rs 3,243.4 crore as of March 31, 2026.
- Borrowings were Rs 935.67 crore as of June 17, 2026.
- Anchor investment of Rs 222.59 crore; promoter OFS totals Rs 200 crore.
- Debut price around Rs 269, with a premium of about 25% to the Rs 214 issue price.
When Laser Power & Infra hit the market, the laser power share price story began to preoccupy retail investors as they weighed the numbers behind the debut. The company operates as an integrated manufacturer of power and control cables, conductors, and specialty electrical products, and it also provides EPC solutions for the power transmission and distribution sector. With three manufacturing facilities in West Bengal, the group has built a scale that supports a Rs 3,243.4 crore order book as of March 31, 2026. On the debt side, outstanding borrowings stood at Rs 935.67 crore as of June 17, 2026.
The IPO was structured as a mix of an offer for sale (OFS) and a fresh issue of equity shares (face value Rs 5) worth Rs 200 crore and Rs 542 crore, respectively. Ahead of the listing, the company raised Rs 222.59 crore from anchor investors on July 8, 2026, and the board allotted 1.04 crore shares at Rs 214 each to 19 anchor investors. The promoter OFS accounted for Rs 200 crore in total, comprising Rs 112.5 crore by Deepak Goel, Rs 25 crore by Rakhi Goel, and Rs 62.5 crore by Devesh Goel. Net proceeds of Rs 490 crore are earmarked for repayment and/or prepayment, in full or in part, of certain outstanding borrowings, with the balance for general corporate purposes.
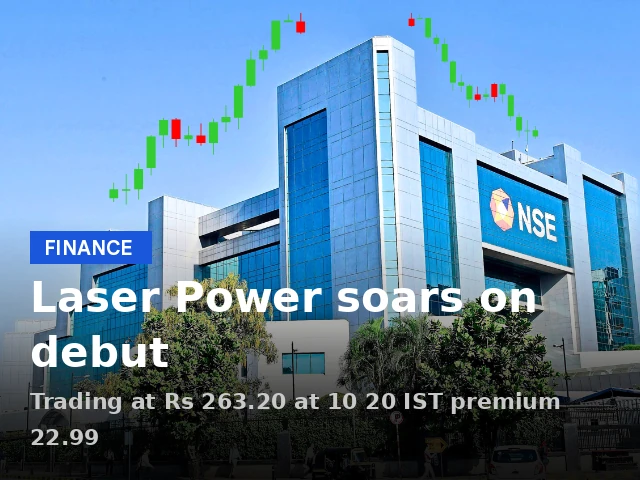
Anchor investor participation and the mix of fresh equity versus OFS are critical for how the stock trades on day one and beyond. The IPO opened for bidding on July 9, 2026, and closed on July 13, 2026, with an offer price band of Rs 203 to Rs 214 per share. The subscription rate stood at an impressive 38.94 times, signaling strong demand from investors. The stock began trading on the BSE at Rs 263.20 at 10:20 IST, a premium of 22.99% over the issue price. It later touched a debut price of Rs 269, delivering a premium of 25.7% to the Rs 214 issue price.
Trading activity mirrored initial enthusiasm, with more than 54.56 lakh shares changing hands on debut. The intraday high reached Rs 269, while the intraday low settled near Rs 250. These dynamics provide a snapshot of the market’s appetite for the company’s long-term earnings potential against the backdrop of its debt and capital structure. For retail investors, this is a textbook case of how anchor support and a robust order book interact with valuation.
As you evaluate this stock’s trajectory, consider a practical framework: compare the strength of the order book and manufacturing footprint against leverage and the use of funds. The company’s three West Bengal facilities are a backbone for both its manufacturing and EPC segments, which together drive the Rs 3,243.4 crore order book and the present earnings profile. The trailing twelve months ended March 31, 2026 show consolidated net profit of Rs 151.59 crore on sales of Rs 2,326.10 crore, underscoring a mid-single-digit net margin at scale.
For deeper stock-by-stock analysis, you can use Swastika's Sarthi AI stock assistant. It’s a useful tool to parse fundamentals, peer dynamics, and macro drivers that affect laser power share price movements.
Laser Power Share Price After Debut: Decoding The Premium And The Road Ahead
The listing delivered an immediate premium to the issue price, with a debut price of Rs 269 against an issue price of Rs 214, a premium of about 25.7%. The premium over the issue price stood at 22.99% when the stock traded at Rs 263.20 at 10:20 IST on the listing day. The market’s immediate reaction reflected optimism about the company’s scale, backed by a Rs 3,243.4 crore order book and a diversified product portfolio spanning power cables, conductors, and EPC services.
From a value perspective, retail investors should ask whether the current laser power share price incorporates the growth implied by the order book and the capacity to convert orders into sustainable earnings. The stock’s debut price and subsequent trading range indicate robust demand but also highlight the sensitivity to debt levels and the usage of IPO proceeds. The Rs 490 crore earmarked for debt repayment provides a near-term cushion for leverage, but the longer-term upside hinges on the company’s ability to sustain an improving margin profile as volumes scale.
Investors should also monitor the trajectory of the company’s borrowings, which stood at Rs 935.67 crore as of June 17, 2026. The net proceeds are planned to reduce debt, providing a path to healthier interest coverage. In the context of the broader power transmission and distribution segment in India, Laser Power & Infra’s EPC capabilities can help it tap a cycle of capex and electrification that supports durable demand for its products.
As you weigh the possibility that the laser power share price can advance beyond the current levels, the key is to balance the company’s asset-light growth potential against its leverage and capital allocation decisions. Consider monitoring quarterly earnings for any improvement in margins and the pace at which the order book converts to revenue.
Laser Power &Amp Infra Order Book And West Bengal Manufacturing Footprint
The company operates three manufacturing facilities in West Bengal, a footprint that anchors its manufacturing and EPC dissemination. The Rs 3,243.4 crore order book as of March 31, 2026 spans both manufacturing and EPC businesses, highlighting diversified revenue streams across cables, conductors, and electrical products. The scale supports a meaningful operating base as demand from the power transmission and distribution sector remains robust amid India’s ongoing grid modernization.
This manufacturing footprint also provides a degree of operational resilience. A diversified product mix helps spread risk across different end-markets, while the geographic concentration within West Bengal offers logistical advantages for supply chain efficiency in the eastern corridor. Retail investors should assess whether this geographic footprint aligns with long-term demand trajectories in India’s power sector and what that means for the laser power share price over multiple years.
Beyond the factory count, the order book magnitude implies a recurring revenue stream that can underpin earnings growth if project execution timelines remain intact and material costs stay within manageable ranges. Investors should look for management commentary on project mix, project deferrals, and how the pipeline transitions from orders to revenue recognition.
Key Financials: Trailing Twelve Months Ended March 31, 2026
For the twelve months ended March 31, 2026, Laser Power & Infra reported consolidated net profit of Rs 151.59 crore on sales of Rs 2,326.10 crore. This places the company in a mid-single-digit net margin range, reflecting the capital-intensive nature of electrical product manufacturing and EPC projects, along with working capital dynamics typical of a project-led business. The scale of annual sales underscores the potential to leverage fixed costs across higher volumes, provided input costs remain controlled and project execution remains timely.
While the headline numbers look solid for a growth-oriented industrial company, investors should assess the sensitivity of profits to commodity price swings, currency movements (if applicable to EPC allocations), and the potential for any incremental debt to finance working capital needs. The balance between debt levels and cash generation will be crucial in determining how the laser power share price evolves as the company moves along its order book conversion path.
Anchor Investors, OFS And Use Of Proceeds: How The IPO Is Structured
The IPO framework combined a fresh issue of Rs 542 crore with an offer for sale of Rs 200 crore. Anchor investors participated before the open, with Rs 222.59 crore raised on July 8, 2026, and 1.04 crore shares allotted to 19 anchor investors at Rs 214 per share. Promoters’ OFS accounted for Rs 200 crore, with Deepak Goel contributing Rs 112.5 crore, Rakhi Goel Rs 25 crore, and Devesh Goel Rs 62.5 crore. Net proceeds of Rs 490 crore are earmarked for repayment and/or prepayment of borrowings, with the balance for general corporate purposes. This structure implies a strong debt-reduction trajectory in the near term, potentially improving free cash flow and reducing interest costs if executed as planned.
From an investor perspective, the combination of anchor participation, OFS by promoters, and a meaningful debt-reduction plan can influence the stock’s risk-reward profile. The use of proceeds to pay down borrowings is a positive signal for leverage management; however, investors should monitor the company’s ability to sustain a growing revenue stream that can outpace the cadence of debt repayment and support earnings expansion.
IPO Details And Market Reception: Open, Subscription, Listing Metrics, And Debut
The laser power ipo opened for bidding on July 9, 2026, and closed on July 13, 2026, at a price band of Rs 203 to Rs 214 per share. The oversubscription rate was 38.94 times, indicating strong investor demand despite the premium pricing. On listing, the stock traded at Rs 263.20 on the BSE at 10:20 IST, a 22.99% premium over the issue price, and the stock debuted at Rs 269, representing a 25.7% premium to the issue price. On Day 1, more than 54.56 lakh shares changed hands, signaling robust liquidity for a newly listed company. The debut high reached Rs 269, while the intraday low settled around Rs 250.
These debut metrics underscore a positive reception from the market, though they also set a benchmark for subsequent trading sessions. Investors should consider whether the stock can sustain these levels, particularly if the company accelerates earnings growth from the order book and improves margin dynamics. In addition, it’s prudent to assess how management navigates the debt load as the company executes its stated net-proceeds plan.
Investment Considerations For Retail Investors: A Stepwise Approach
Retail investors evaluating Laser Power & Infra should blend fundamental and market considerations. Start with the order book of Rs 3,243.4 crore and the three West Bengal manufacturing facilities as a signal of scale and execution capability. Coupled with trailing 12-month revenue of Rs 2,326.10 crore and net profit of Rs 151.59 crore, the business demonstrates the capacity to convert orders into earnings, albeit with debt on the balance sheet.
Next, weigh the debt reduction plan: Rs 490 crore of net proceeds earmarked for debt repayment and prepayment. If this plan progresses as intended, it can ease interest costs and improve cash flow, supporting potential upside in the laser power share price over time. Yet, the OFS by promoters and the need to convert the Rs 3,243.4 crore order book into sustained revenue growth remain key risk factors. Investors should monitor quarterly performance, project execution timelines, and any changes in working capital needs that could influence profitability.
Finally, consider diversification benefits within the broader electricals and EPC ecosystem. The industry backdrop includes ongoing investments in power transmission and distribution, grid modernization, and demand for cables and control products. For a more structured analysis, use Swastika's Sarthi AI stock assistant to run scenario analyses and compare Laser Power & Infra with peers in the sector. Swastika's Sarthi AI stock assistant can help calibrate risk and reward.
Frequently Asked Questions
What is Laser Power & Infra's order book as of March 31, 2026?
Rs 3,243.4 crore across manufacturing and EPC businesses.
How much are the borrowings as of June 17, 2026?
Rs 935.67 crore.
How much anchor investment did Laser Power & Infra raise before the IPO and how many anchor investors were allotted shares?
Rs 222.59 crore was raised from anchor investors on July 8, 2026, and the board allotted 1.04 crore shares at Rs 214 to 19 anchor investors.
What are the promoter OFS details and the net proceeds use from the IPO?
Promoters' OFS amounts to Rs 200 crore (Rs 112.5 crore by Deepak Goel, Rs 25 crore by Rakhi Goel, Rs 62.5 crore by Devesh Goel). Net proceeds of Rs 490 crore will be used to repay and/or prepay borrowings, with the balance for general corporate purposes.
What were the IPO details and debut market performance?
IPO price band was Rs 203-214 per share; subscription was 38.94 times; listing price on the BSE at 10:20 IST was Rs 263.20, a 22.99% premium over the issue price; the stock debuted at Rs 269, a 25.7% premium to the issue price; about 54.56 lakh shares traded on Day 1.
What are the trailing twelve months' financials for Laser Power & Infra as of March 31, 2026?
Consolidated net profit of Rs 151.59 crore on sales of Rs 2,326.10 crore.
Conclusion
Laser Power & Infra presents a compelling case for investors who value scale, a diversified product mix, and a debt-reduction plan funded by a well-structured IPO. The Rs 3,243.4 crore order book and three West Bengal manufacturing facilities anchor a growth narrative that is attractive in a capex-driven environment, even as leverage and execution risk warrant close inspection. For retail investors, the prudent path is to watch how the company translates orders into margin expansion and free cash flow, while keeping debt pressures in check. Consider using a systematic framework to evaluate the stock over multiple quarters and to align investment decisions with your risk tolerance and time horizon.
Open your trading and demat account here
Reference :
Nifty Share Price Outlook Amid Global Turmoil: What Indian Retail Investors Should Watch
Key Takeaways
- Gift Nifty signalled a weak start amid Middle East tensions and higher crude prices.
- The derivatives indicator traded near 23,198, about 42 points below the prior Nifty futures close.
- Sensex closed at 73,983.18 and Nifty at 23,214.95 in a mixed session.
- Global cues remained weak with major indices down as Brent rose to $95.40 and WTI to $92.63.
Gift Nifty signalled a weak start for Indian equities as escalating tensions in the Middle East, higher crude oil prices, and losses across global markets weighed on sentiment. The nifty share price opened with caution as traders priced in the risk of tighter financial conditions and limited liquidity in a risk-off mood. For a retail investor, the question is not just about the day’s move but what the next few sessions could bring. This article unpacks how to read the signals, what to expect for the Sensex and Nifty, and how to position with risk controls in mind.
Nifty Share Price Outlook In A Turbulent Global Landscape
The near-term path for the nifty share price will be shaped by global cues and domestic risk appetite. The derivatives indicator was trading around 23,198, roughly 42 points below the prior close of Nifty futures, signaling caution among traders ahead of the session. Yesterday, the Sensex moved higher by 64.42 points to 73,983.18, while the Nifty 50 slipped by 27.15 points to 23,214.95, illustrating a split jury between large-caps and breadth. Such divergence underscores the need for selective stock picking and disciplined risk controls as markets digest geopolitical and macro news. A cautious stance can still offer selective opportunities, especially in high-quality franchises with resilient earnings trajectories.
Global Cues To Watch For Indian Markets In The Near Term
Across Asia, market momentum softened as risk sentiment wavered. The Nikkei 225 fell 2.3% and the Topix index declined 1.9%, while Kospi dropped 4.1% and Kosdaq lost 2.8%. In the United States, the Dow Jones Industrial Average ended lower by 953.33 points (1.87%), the S&P 500 declined 119.66 points (1.62%), and the Nasdaq Composite slipped 509.32 points (1.98%). Fresh escalation in the U.S.–Iran conflict saw additional strikes on Iran, with Iranian media reporting explosions in the southern region near the Strait of Hormuz, a key energy transit corridor. These moves push crude volatility higher and can feed into risk-off dynamics for Indian equities.
Oil markets extended their rally with Brent crude futures up 2.47% to 95.40 per barrel and U.S. West Texas Intermediate crude up 2.89% to 92.63 per barrel. The energy complex remains a critical macro variable for global growth expectations, inflation trajectories, and currency moves. Inflation pressures surfaced in May, with U.S. consumer inflation at 4.2%–the highest since April 2023–while the U.S. Treasury 10-year yield climbed to 4.548%. The dollar index stood near 100.01, offering little directional bias on the greenback in the immediate term.
Gold prices declined on fears of higher interest rates–spot gold traded around 4,063.87 per ounce and spot silver around 63.15 per ounce. The combination of firmer yields, higher oil, and geopolitical risk keeps a lid on risk appetite in the near term. Market participants will watch how macro data and geopolitical headlines interact with domestic liquidity conditions to shape the pace of moves in Indian equities.
Oil Prices Inflation And Bond Yields: Market Signals For Retail Investors
Energy prices continue to be a leading indicator of headline inflation and bond risk premia. With Brent at 95.40 and WTI at 92.63, crude remains a live driver of volatility across asset classes. Elevated inflation readings and higher yields tend to tilt portfolios toward more defensive equities or cash equivalents, even as commodity-linked sectors may see episodic strength on supply fears. For retail investors, this environment argues for calibrated exposure–avoiding over-concentration in cyclicals when macro momentum is uncertain and using a disciplined risk framework to manage drawdowns.
In this setting, the nifty share price might exhibit choppy moves as traders price in outcomes from geopolitics and central bank policy expectations. The drop in gold prices contrasts with oil strength, underscoring diverging inflation and real-rate dynamics. A practical response is to treat volatility as a feature rather than a bug: define risk budgets, use mechanical stop-loss rules, and maintain a core position in quality large caps while selectively adding on pullbacks in high-conviction names.
Stock Specific Watchlist: Key Large Caps For The Near Term
Market watchers will keep a close eye on heavyweight names whose price action moves the index. The replacements that matter here include reliance industries limited stock price, the stock price of tcs, the infosys stock price, the hdfc bank stock price, the icici bank stock, and the kotak mahindra bank stock price. While the actual price levels will ebb and flow with the broader market, these six anchors typically set the tone for intraday and near-term directional bias. A disciplined investor would monitor these stocks for breakouts or breakdowns and align portfolio risk with the broader market tone. Given the weight of these names in major indices, even small moves can translate into meaningful index shakeouts or advances.
From a strategy perspective, consider watchlisting these names and using limit orders to capture favorable entries on pullbacks. In parallel, maintain a lean exposure to cyclicals if global signals tilt risk-off, and be prepared to reallocate into quality defensive names should volatility persist. For those seeking a screens-based approach, Swastika's Sarthi AI stock assistant can help surface stock ideas aligned with your risk profile and time horizon, complementing your manual analysis. Swastika's Sarthi AI stock assistant can be a useful bridge between instinct and evidence-driven screening.
Practical Strategies For Retail Investors In A Volatile Environment
In a climate of rising crude prices, fluctuating inflation metrics, and geopolitical risk, a pragmatic plan matters more than a heroic bet. Here are practical steps for retail investors to navigate the near term:
- Build a concise set of core holdings in high-quality, defensively biased stocks and index funds to weather volatility.
- Maintain a clear risk budget and use position sizing to ensure you do not overcommit on single-day moves.
- Use trailing stops or guardrail levels to protect profits and limit drawdowns in choppy markets.
- Watch the six stock anchors (reliance industries limited stock price, stock price of tcs, infosys stock price, hdfc bank stock price, icici bank stock, kotak mahindra bank stock price) for early signals of broad market direction.
- Leverage quantitative tools or AI-assisted insights, such as Swastika's Sarthi AI stock assistant, to complement fundamental analysis and help spot entry/exit opportunities with defined risk controls.
When forming a decision framework, many investors find it helpful to use a simple mental model: (1) identify the macro regime (growth vs. inflation vs. policy), (2) confirm liquidity conditions (risk-off vs. risk-on), and (3) align stock-picking with time horizon. In the current context, the macro landscape remains pressured by geopolitical tensions and energy price dynamics, and liquidity conditions could stay sensitive to ongoing developments. A measured approach–combining a robust core with selective tactical exposures and disciplined risk controls–can help you navigate the next few sessions with greater resilience.
Frequently Asked Questions
What does Gift Nifty signal for Indian markets today?
Gift Nifty signalled a weak start for Indian equities as tensions in the Middle East, higher crude oil prices, and losses across global markets weighed on sentiment.
What were the latest closing levels for Sensex and Nifty?
Sensex closed at 73,983.18, up 64.42 points, and Nifty 50 settled at 23,214.95, down 27.15 points.
How did major Asian and U.S. markets perform recently?
Asian markets were under pressure: Nikkei 225 fell 2.3%, Topix -1.9%, Kospi -4.1%, Kosdaq -2.8%. In the U.S., Dow fell 953.33 points (1.87%), S&P 500 down 119.66 points (1.62%), and Nasdaq -509.32 points (1.98%).
What is happening with oil, inflation, and bond yields?
Brent crude rose to 95.40 per barrel and WTI rose to 92.63. U.S. inflation climbed to 4.2% in May, and the 10-year Treasury yield moved to 4.548%.
Where can I explore Swastika's AI stock assistance for stock ideas?
Explore Swastika's Sarthi AI stock assistant atSwastika's Sarthi AI stock assistantfor institutional-level research on stocks and indices.
Conclusion
The near-term path for Indian equities will hinge on geopolitical headlines, energy prices, and inflation dynamics, all of which shape the nifty share price and the broader risk environment. Retail investors should anchor decisions in a disciplined framework: protect capital with a core, diversify to reduce idiosyncratic risk, and stay nimble enough to adjust allocations as macro signals evolve. The practical takeaway is to prepare for a world where volatility persists but thoughtful positioning can still create avenues for long-run gains.
Open your trading and demat account here
Reference :
1 : 5Paisa
Big Budget


Popular Articles




.avif)
.avif)

.avif)



START YOUR INVESTMENT JOURNEY
Get personalized advice from our experts
- Dedicated RM Support
- Smooth and Fast Trading App
