


Sterlite Tech Share Price Outlook After Q1 FY27: AI-Driven Growth And Record Open Book



Key Takeaways
- Sterlite Tech Q1 FY27 revenue rose 87% YoY to Rs 1,910 crore, with PAT at Rs 197 crore.
- AI data centre orders worth US$1.11 billion (over Rs 10,000 crore) and hyperscaler orders over US$100 million boosted growth.
- Open order book hit a record Rs 18,618 crore, signaling strong revenue visibility ahead.
- The company raised Rs 1,500 crore via QIP, achieving net debt-free status and a positive rating outlook.
Investors tracking the sterlite tech share price will be watching Sterlite Tech's Q1 FY27 results, which delivered a blockbuster quarter. Revenue for the quarter ended June 30 stood at Rs 1,910 crore, up 87% YoY from Rs 1,019 crore, while PAT rose to Rs 197 crore, up 870% from Rs 10 crore a year earlier. The sequential revenue rose 33% from Rs 1,441 crore in Q4 FY26, painting a picture of sustained momentum. The March quarter PAT was Rs 59 crore, a reminder that quarterly numbers can vary, even as the overall trajectory remains positive.
EBITDA for the quarter was Rs 397 crore, and the EBITDA margin stood at 20.8%. EBITDA in the prior quarter was Rs 218 crore, and EBITDA in the previous period (Q1) was Rs 140 crore. The open order book reached Rs 18,618 crore, a record, reflecting strong order intake across AI data centre connectivity products. This backdrop sets the stage for a continued AI-led buildout of digital infrastructure that increasingly relies on high density fibre, low latency networks and plug and play solutions.
The AI data centre orders were the headline driver: a multi-year contract worth US$1.11 billion (more than Rs 10,000 crore) to supply optical connectivity products for next-generation AI data centres. In addition, multiple hyperscaler orders worth more than US$100 million were secured for Neuralis, Sterlite Tech’s integrated data centre solutions portfolio. An additional strategic order for long-haul, dark-fibre high-density micro-cables was placed with a major connectivity infrastructure provider. The data centre demand rationale is clear – modern AI workloads demand higher fibre density and faster data transmission, and Sterlite Tech positions itself as a supplier of optical fibre, cables and integrated connectivity products for AI data centre buildouts.
From a balance sheet perspective, Sterlite Tech achieved net debt-free status during the quarter after raising Rs 1,500 crore through a qualified institutional placement (QIP). This fundraise strengthens the balance sheet and provides capital to support the next growth phase. Rating agencies reacted positively: CRISIL revised its rating outlook to Stable, and ICRA upgraded the company’s credit rating to AA (Stable). This improvement in credit standing adds resilience to the growth story as it scales its AI data centre footprint and expands the AI-ready portfolio.
The AI portfolio focus remains sharp. New products include CONCAT, a pre-connectorized plug and play solution aimed at reducing onsite labour and installation costs. Sterlite Tech also introduced US Conec-certified MMC pre-terminated solutions, which can deliver a three-times increase in cabling density to support 800G and higher-speed AI data centre networks. These innovations are part of an AI-ready digital infrastructure portfolio designed for data centres that require higher bandwidth, lower latency and denser fibre networks. Europe is a key piece of the geography, with a decisive patent win strengthening Sterlite Tech’s IP moat across the UK and Europe, where the portfolio now includes more than 785 patents.
Geographic expansion remains a strategic driver. The European footprint complements the company’s growth in other regions and aligns with AI data centre investments by hyperscalers and telecom operators. The combination of AI-enabled product offerings, a record open order book, and a strengthened balance sheet positions Sterlite Tech to execute on multi year AI data centre rollouts. This is a setup that investors will want to monitor closely as the company translates order bookings into recurring revenue and margin expansion over the coming quarters.
For readers seeking deeper, institution-grade stock research while navigating this growth phase, consider Swastika's Sarthi AI stock assistant to compare Sterlite Tech with peers and build a data-driven view on potential entry points and risk controls. This kind of tool can be especially useful for retail investors who want a structured framework to assess AI-enabled growth stories in the tech connectivity space.
Sterlite Tech Share Price Outlook After Record Q1 FY27 Results
The numbers above frame a growth narrative that has meaningful implications for Sterlite Tech’s share price trajectory. A revenue base of Rs 1,910 crore in Q1 FY27, up 87% YoY, alongside a PAT of Rs 197 crore and a robust EBITDA margin, suggests the company is converting AI-enabled demand into tangible profitability. The sequential growth of 33% from Rs 1,441 crore in Q4 FY26 indicates sustained demand momentum across AI data centre connectivity products and related solutions, not just a one-off spike. For sterlite tech stock watchers, the combination of revenue growth and margin expansion is a positive signal, potentially underpinning a higher valuation multiple as the AI data centre cycle matures.
Open order book momentum is a particularly telling indicator. At Rs 18,618 crore, it is a new record, signaling strong revenue visibility across the next several quarters. The multi-year US$1.11 billion AI data centre order, which translates to more than Rs 10,000 crore, alongside hyperscaler orders over US$100 million, confirms that AI-driven digital infrastructure is a meaningful growth engine for Sterlite Tech. The company’s ability to win large orders for Neuralis and related data centre solutions demonstrates its positioning as a turnkey supplier for high-density fibre and integrated connectivity systems that AI workloads demand.
From a profitability perspective, EBITDA of Rs 397 crore and a 20.8% EBITDA margin reflect operating leverage as volumes scale. Comparisons to the prior quarter’s Rs 218 crore EBITDA and Rs 140 crore in Q1 of the previous year illustrate how the mix of orders and operating efficiency are driving margin expansion. The balance sheet also strengthened meaningfully, with the company achieving net debt-free status after raising Rs 1,500 crore via a QIP. The improved credit backdrop – CRISIL’s Stable outlook and ICRA’s AA rating (Stable) – reduces funding pressures and supports continued investment in AI-ready products and capacity expansion.
Innovation is also a core theme. CONCAT, a pre-connectorized plug-and-play solution, is designed to reduce onsite labour and installation costs, while MMC pre-terminated solutions certified by US Conec promise a three-times higher cabling density to support 800G networks. This suite of products underscores Sterlite Tech’s intent to deliver higher bandwidth with lower latency for AI data centres, aligning with hyperscaler demand for dense fibre networks and scalable data centre infrastructures. The Europe patent win further reinforces the company’s IP moat and helps sustain competitive advantages in European markets, alongside the already strong regional footprint across the UK and Europe.
Now, how should one interpret these dynamics for Sterlite Tech share price in practical terms? The near-term trajectory will hinge on execution – converting order intake into revenue, managing supply chain and delivery timelines, and sustaining high gross margins as AI data centre networks scale. The long-run driver remains the AI-led digital infrastructure cycle, which is broad-based and not limited to a single geography. For retail investors, the key is to monitor how well Sterlite Tech translates its robust order book into cash flow, how the company manages working capital during rapid growth, and how external factors like macro headwinds or semiconductor and fibre supply dynamics may influence sentiment.
It’s also helpful to view Sterlite Tech’s progress through the lens of the company’s broader AI-ready portfolio. The CONCAT and MMC innovations position Sterlite Tech to deliver higher-density solutions that are essential for 800G and above data centre networks. The record open order book and the QIP-driven balance-sheet strengthening provide a solid platform for meaningful growth, but investors should still consider execution risk and potential competitive pressures in optical connectivity markets. In short, the story blends strong top-line growth with improving profitability and a more robust capital framework, which could support a re-rating of Sterlite Tech stock over time as orders convert into sustained cash flow.
Frequently Asked Questions
What were Sterlite Tech's key Q1 FY27 results?
Revenue for Q1 FY27 was Rs 1,910 crore, up 87% YoY from Rs 1,019 crore; PAT was Rs 197 crore, up 870% YoY from Rs 10 crore; EBITDA was Rs 397 crore with a margin of 20.8%.
What drove Sterlite Tech's growth in Q1 FY27?
AI data centre connectivity orders drove growth, including a multi-year contract worth US$1.11 billion (over Rs 10,000 crore) and hyperscaler orders over US$100 million.
What is the Sterlite Tech open order book at the end of Q1 FY27?
The open order book stood at Rs 18,618 crore, a record high.
What balance-sheet actions did Sterlite Tech take in Q1 FY27?
Sterlite Tech achieved net debt-free status after raising Rs 1,500 crore via a QIP.
What product innovations were announced in Q1 FY27?
New CONCAT pre-connectorized plug-and-play solutions and US Conec-certified MMC pre-terminated solutions aiming to increase cabling density for 800G and higher-speed networks.
How did credit ratings react to the results?
CRISIL revised its rating outlook to Stable, and ICRA upgraded Sterlite Tech’s rating to AA (Stable).
Conclusion
Retail investors should view Sterlite Tech’s Q1 FY27 as a validation of its AI-ready digital infrastructure strategy, with a record open order book, robust AI data centre orders and a strengthened balance sheet. The combination of a 87% YoY revenue surge to Rs 1,910 crore, 870% PAT growth to Rs 197 crore, and a net debt-free position after a Rs 1,500 crore QIP, creates a durable growth scaffold. The path ahead hinges on execution, order backlog conversion, and continued demand for high-density fibre connectivity in AI data centres. The next step for investors is to apply a backlog-to-revenue lens to assess delivery risk and revenue visibility as Sterlite Tech scales its AI-enabled portfolio.
Open your trading and demat account here
Reference :
1 : Economictimes
Latest Articles
Sterlite Tech Share Price Outlook After Q1 FY27: AI-Driven Growth And Record Open Book


Key Takeaways
- Sterlite Tech Q1 FY27 revenue rose 87% YoY to Rs 1,910 crore, with PAT at Rs 197 crore.
- AI data centre orders worth US$1.11 billion (over Rs 10,000 crore) and hyperscaler orders over US$100 million boosted growth.
- Open order book hit a record Rs 18,618 crore, signaling strong revenue visibility ahead.
- The company raised Rs 1,500 crore via QIP, achieving net debt-free status and a positive rating outlook.
Investors tracking the sterlite tech share price will be watching Sterlite Tech's Q1 FY27 results, which delivered a blockbuster quarter. Revenue for the quarter ended June 30 stood at Rs 1,910 crore, up 87% YoY from Rs 1,019 crore, while PAT rose to Rs 197 crore, up 870% from Rs 10 crore a year earlier. The sequential revenue rose 33% from Rs 1,441 crore in Q4 FY26, painting a picture of sustained momentum. The March quarter PAT was Rs 59 crore, a reminder that quarterly numbers can vary, even as the overall trajectory remains positive.
EBITDA for the quarter was Rs 397 crore, and the EBITDA margin stood at 20.8%. EBITDA in the prior quarter was Rs 218 crore, and EBITDA in the previous period (Q1) was Rs 140 crore. The open order book reached Rs 18,618 crore, a record, reflecting strong order intake across AI data centre connectivity products. This backdrop sets the stage for a continued AI-led buildout of digital infrastructure that increasingly relies on high density fibre, low latency networks and plug and play solutions.
The AI data centre orders were the headline driver: a multi-year contract worth US$1.11 billion (more than Rs 10,000 crore) to supply optical connectivity products for next-generation AI data centres. In addition, multiple hyperscaler orders worth more than US$100 million were secured for Neuralis, Sterlite Tech’s integrated data centre solutions portfolio. An additional strategic order for long-haul, dark-fibre high-density micro-cables was placed with a major connectivity infrastructure provider. The data centre demand rationale is clear – modern AI workloads demand higher fibre density and faster data transmission, and Sterlite Tech positions itself as a supplier of optical fibre, cables and integrated connectivity products for AI data centre buildouts.
From a balance sheet perspective, Sterlite Tech achieved net debt-free status during the quarter after raising Rs 1,500 crore through a qualified institutional placement (QIP). This fundraise strengthens the balance sheet and provides capital to support the next growth phase. Rating agencies reacted positively: CRISIL revised its rating outlook to Stable, and ICRA upgraded the company’s credit rating to AA (Stable). This improvement in credit standing adds resilience to the growth story as it scales its AI data centre footprint and expands the AI-ready portfolio.
The AI portfolio focus remains sharp. New products include CONCAT, a pre-connectorized plug and play solution aimed at reducing onsite labour and installation costs. Sterlite Tech also introduced US Conec-certified MMC pre-terminated solutions, which can deliver a three-times increase in cabling density to support 800G and higher-speed AI data centre networks. These innovations are part of an AI-ready digital infrastructure portfolio designed for data centres that require higher bandwidth, lower latency and denser fibre networks. Europe is a key piece of the geography, with a decisive patent win strengthening Sterlite Tech’s IP moat across the UK and Europe, where the portfolio now includes more than 785 patents.
Geographic expansion remains a strategic driver. The European footprint complements the company’s growth in other regions and aligns with AI data centre investments by hyperscalers and telecom operators. The combination of AI-enabled product offerings, a record open order book, and a strengthened balance sheet positions Sterlite Tech to execute on multi year AI data centre rollouts. This is a setup that investors will want to monitor closely as the company translates order bookings into recurring revenue and margin expansion over the coming quarters.
For readers seeking deeper, institution-grade stock research while navigating this growth phase, consider Swastika's Sarthi AI stock assistant to compare Sterlite Tech with peers and build a data-driven view on potential entry points and risk controls. This kind of tool can be especially useful for retail investors who want a structured framework to assess AI-enabled growth stories in the tech connectivity space.
Sterlite Tech Share Price Outlook After Record Q1 FY27 Results
The numbers above frame a growth narrative that has meaningful implications for Sterlite Tech’s share price trajectory. A revenue base of Rs 1,910 crore in Q1 FY27, up 87% YoY, alongside a PAT of Rs 197 crore and a robust EBITDA margin, suggests the company is converting AI-enabled demand into tangible profitability. The sequential growth of 33% from Rs 1,441 crore in Q4 FY26 indicates sustained demand momentum across AI data centre connectivity products and related solutions, not just a one-off spike. For sterlite tech stock watchers, the combination of revenue growth and margin expansion is a positive signal, potentially underpinning a higher valuation multiple as the AI data centre cycle matures.
Open order book momentum is a particularly telling indicator. At Rs 18,618 crore, it is a new record, signaling strong revenue visibility across the next several quarters. The multi-year US$1.11 billion AI data centre order, which translates to more than Rs 10,000 crore, alongside hyperscaler orders over US$100 million, confirms that AI-driven digital infrastructure is a meaningful growth engine for Sterlite Tech. The company’s ability to win large orders for Neuralis and related data centre solutions demonstrates its positioning as a turnkey supplier for high-density fibre and integrated connectivity systems that AI workloads demand.
From a profitability perspective, EBITDA of Rs 397 crore and a 20.8% EBITDA margin reflect operating leverage as volumes scale. Comparisons to the prior quarter’s Rs 218 crore EBITDA and Rs 140 crore in Q1 of the previous year illustrate how the mix of orders and operating efficiency are driving margin expansion. The balance sheet also strengthened meaningfully, with the company achieving net debt-free status after raising Rs 1,500 crore via a QIP. The improved credit backdrop – CRISIL’s Stable outlook and ICRA’s AA rating (Stable) – reduces funding pressures and supports continued investment in AI-ready products and capacity expansion.
Innovation is also a core theme. CONCAT, a pre-connectorized plug-and-play solution, is designed to reduce onsite labour and installation costs, while MMC pre-terminated solutions certified by US Conec promise a three-times higher cabling density to support 800G networks. This suite of products underscores Sterlite Tech’s intent to deliver higher bandwidth with lower latency for AI data centres, aligning with hyperscaler demand for dense fibre networks and scalable data centre infrastructures. The Europe patent win further reinforces the company’s IP moat and helps sustain competitive advantages in European markets, alongside the already strong regional footprint across the UK and Europe.
Now, how should one interpret these dynamics for Sterlite Tech share price in practical terms? The near-term trajectory will hinge on execution – converting order intake into revenue, managing supply chain and delivery timelines, and sustaining high gross margins as AI data centre networks scale. The long-run driver remains the AI-led digital infrastructure cycle, which is broad-based and not limited to a single geography. For retail investors, the key is to monitor how well Sterlite Tech translates its robust order book into cash flow, how the company manages working capital during rapid growth, and how external factors like macro headwinds or semiconductor and fibre supply dynamics may influence sentiment.
It’s also helpful to view Sterlite Tech’s progress through the lens of the company’s broader AI-ready portfolio. The CONCAT and MMC innovations position Sterlite Tech to deliver higher-density solutions that are essential for 800G and above data centre networks. The record open order book and the QIP-driven balance-sheet strengthening provide a solid platform for meaningful growth, but investors should still consider execution risk and potential competitive pressures in optical connectivity markets. In short, the story blends strong top-line growth with improving profitability and a more robust capital framework, which could support a re-rating of Sterlite Tech stock over time as orders convert into sustained cash flow.
Frequently Asked Questions
What were Sterlite Tech's key Q1 FY27 results?
Revenue for Q1 FY27 was Rs 1,910 crore, up 87% YoY from Rs 1,019 crore; PAT was Rs 197 crore, up 870% YoY from Rs 10 crore; EBITDA was Rs 397 crore with a margin of 20.8%.
What drove Sterlite Tech's growth in Q1 FY27?
AI data centre connectivity orders drove growth, including a multi-year contract worth US$1.11 billion (over Rs 10,000 crore) and hyperscaler orders over US$100 million.
What is the Sterlite Tech open order book at the end of Q1 FY27?
The open order book stood at Rs 18,618 crore, a record high.
What balance-sheet actions did Sterlite Tech take in Q1 FY27?
Sterlite Tech achieved net debt-free status after raising Rs 1,500 crore via a QIP.
What product innovations were announced in Q1 FY27?
New CONCAT pre-connectorized plug-and-play solutions and US Conec-certified MMC pre-terminated solutions aiming to increase cabling density for 800G and higher-speed networks.
How did credit ratings react to the results?
CRISIL revised its rating outlook to Stable, and ICRA upgraded Sterlite Tech’s rating to AA (Stable).
Conclusion
Retail investors should view Sterlite Tech’s Q1 FY27 as a validation of its AI-ready digital infrastructure strategy, with a record open order book, robust AI data centre orders and a strengthened balance sheet. The combination of a 87% YoY revenue surge to Rs 1,910 crore, 870% PAT growth to Rs 197 crore, and a net debt-free position after a Rs 1,500 crore QIP, creates a durable growth scaffold. The path ahead hinges on execution, order backlog conversion, and continued demand for high-density fibre connectivity in AI data centres. The next step for investors is to apply a backlog-to-revenue lens to assess delivery risk and revenue visibility as Sterlite Tech scales its AI-enabled portfolio.
Open your trading and demat account here
Reference :
1 : Economictimes

IOC Share Price Insights: Petrol And Diesel Prices Hold Steady As Crude Tops $100
Key Takeaways
- Domestic petrol and diesel prices were unchanged across major Indian cities on July 24, even as global crude briefly topped $100.
- Brent crude traded around $99.97 per barrel and WTI around $91.49, marking a weekly gain of about 13.5%.
- The Centre’s pricing mechanism shields consumers through May 25 revisions, with no move to ethanol blending beyond 20%.
- A city-by-city price snapshot helps investors gauge regional exposure while monitoring IOC share price, bpcl stock price, and hpcl share price moves.
In India, the term ioc share price is a quick lens for watching how energy giants move with global oil. On July 24, petrol and diesel prices stayed unchanged across major cities even as crude briefly topped $100 a barrel amid escalating geopolitical tensions in West Asia. Brent price traded around $99.97 per barrel as of 0126 GMT, down 0.72% from the previous session after touching triple-digit levels earlier. The benchmark has gained about 13.5% this week. West Texas Intermediate (WTI) crude stood at $91.49 per barrel, lower by 0.76%. The domestic pricing mechanism–administered by state-owned oil marketing companies–continues to shield retail consumers from volatility in international oil markets. For investors tracking energy stocks, watch ioc share price, bpcl stock price, and hpcl share price movements for a fuller view of the sector's trajectory.
How Domestic Fuel Pricing In India Shields Retail Investors From Global Oil Volatility
The Indian price regime for petrol and diesel relies on a transparent, periodically revised framework that aligns pump prices with broader policy and market signals. This structure helps cushion households and small investors from sudden spikes in Brent or WTI. On May 25, a revision framework was implemented that remains in effect, with state-owned oil marketing companies (OMCs) adjusting prices in line with a central calibration. As a result, on July 24, retail petrol and diesel rates in New Delhi, Mumbai, Kolkata, Bengaluru, Chennai, Hyderabad, Jaipur and Lucknow stayed steady despite the global crude rally. The domestic price shield does not mean commodity prices are irrelevant to Indian markets–it means policy tools and distribution networks translate global risk into manageable domestic outcomes.


IOC Share Price And Indian Oil Stocks: What Retail Investors Should Track
For a retail investor, the ioc share price is a useful barometer to gauge the energy sector's exposure to global oil dynamics. IOC, BPCL and HPCL are the three major public-sector players in India, and their stock trajectories often move with crude signals and refinery margins. When crude edges higher, the ioc share price might reflect shifts in refining margins and government subsidies, while bpcl stock price and hpcl share price movements can diverge on product mix, marketing margins and regional demand. Keep an eye on how domestic price stability interacts with these stock price moves–they are not perfectly synchronized but together paint a more complete picture of sector risk and opportunity.
Citywise Petrol And Diesel Price Trends On July 24: A Data Snapshot
Here is a snapshot of the latest pump prices across major Indian cities on July 24. The following data shows petrol and diesel rates per litre in each city, illustrating the regional spread even when the national average remains steady.
| City | Petrol (₹/litre) | Diesel (₹/litre) |
|---|---|---|
| New Delhi | ₹102.12 | ₹95.20 |
| Mumbai | ₹111.21 | ₹97.83 |
| Kolkata | ₹113.51 | ₹99.82 |
| Bengaluru | ₹110.44 | ₹98.39 |
| Chennai | ₹107.76 | ₹99.55 |
| Hyderabad | ₹115.73 | ₹103.82 |
| Jaipur | ₹113.50 | ₹98.50 |
| Lucknow | ₹101.89 | ₹95.36 |
Crude Price Movements And Domestic Impact On Indian Fuel Rates
Global crude prices hovered around the $100 mark during the day, with Brent trading near $99.97 per barrel at 0126 GMT and WTI at about $91.49 per barrel. The week saw Brent rise roughly 13.5%, while WTI stayed softer. Despite these gains and the elevated geopolitical risks in West Asia, domestic fuel prices in India remained unchanged on July 24, thanks to the domestic pricing mechanism and OMCs’ cautious alignment with May 25 revisions. This divergence between international oil volatility and Indian pump prices underscores the importance of policy instruments in managing retail risk for households and small investors alike.
Centre Clarifies Position On E20 Petrol
The government has not taken a decision to raise ethanol blending in petrol beyond the current 20% level. There is no proposal to restore E0 or E10 petrol supplies. Premium petrol variants sold by public sector retailers–XP100 from Indian Oil, poWer100 from Hindustan Petroleum, and Speed100 from Bharat Petroleum–will continue to be supplied without ethanol blending. Any future proposal to increase ethanol blending beyond 20% would be considered only after scientific studies and consultations with automobile manufacturers, oil marketing companies and research institutions. The decision framework preserves the balance between environmental goals, engine compatibility, and retail affordability.
For investors seeking a practical way to navigate this environment, focus on how policy shifts and refinery margins translate into stock performance for major oil majors and downstream players. Swastika's Sarthi AI stock assistant can help you synthesize this data with your existing watchlist to identify material move signals in real time.
Frequently Asked Questions
What is the petrol price in New Delhi on July 24, 2026?
Petrol in New Delhi is ₹102.12 per litre and Diesel ₹95.20 per litre.
Has ethanol blending in petrol been increased beyond 20%?
No decision has been taken to raise ethanol blending beyond 20%, and there is no proposal to restore E0 or E10 petrol.
What were the Brent and WTI crude prices around July 24, 2026?
Brent crude priced around $99.97 per barrel and WTI around $91.49 per barrel.
Why did domestic petrol prices remain unchanged despite higher global crude?
The domestic pricing mechanism, managed by state-owned oil marketing companies with a May 25 revision framework, shields consumers from international volatility.
Where can investors look for stock-level insights on energy stocks like IOC?
Investors can use Swastika's Sarthi AI stock assistant for institutional-grade research on stocks and indices.
Conclusion
The price stability of petrol and diesel across Indian cities on July 24, even as global crude flirted with the $100 benchmark, underscores how domestic policy channels and state-led distribution networks can insulate consumers from immediate price shocks. For retail investors, this environment suggests that energy-equity exposure should be evaluated through a dual lens: how crude signals translate into margins and stock moves, and how policy steps such as the May 25 revision affect pump-price resilience. The ioc share price will reflect global oil tides, but the domestic shield means gradual, not abrupt, price realization for households–and a reason to diversify into downstream stocks with improving margins and sustainable demand.
Take the next step by building a focused energy sector watchlist, testing a simple mental model like “policy shield plus margin growth,” and using Swastika’s Sarthi AI stock assistant to validate assumptions with data-driven insights.
Cg Power Share Price: Q1 Results Signal Growth, Margin Pressure, And Nashik Plant Plans
Key Takeaways
- cg power share price moved as CG Power posted Q1 revenue up 14% and net profit up 16.3% YoY.
- EBITDA margin contracted to 12.1% from 13.2%, signaling margin pressure even as topline grows.
- The company announced brownfield expansions for switchgear and its EPD segment, including a cg power nashik plant.
- Intraday price action showed a fall of up to 5.19% to Rs 838.80, with mid-session trading around Rs 857.20.
cg power share price watchers were listening closely as CG Power and Industrial Solutions Ltd released its June quarter results. Consolidated net profit rose to Rs 313 crore, up 16.3% year-on-year (YoY), while revenue climbed 14% to Rs 3,281 crore. EBITDA stood at Rs 397 crore, up 4.3% YoY, with an EBITDA margin of 12.1% (contracted from 13.2%). Other income rose sharply to Rs 83.6 crore from Rs 28.3 crore, and tax expense increased to Rs 114.6 crore from Rs 96.9 crore. The company also outlined brownfield manufacturing plans for switchgear and its Energy and Power Distribution (EPD) segment, including a brownfield unit in Nashik.
The cg power earnings narrative for the quarter paints a mixed picture. Topline growth signals underlying demand for CG Power's electrical equipment, especially in distribution and switchgear segments, but earnings were tempered by a margin squeeze and higher tax outflows. The firm emphasized capacity expansion through brownfield projects to support future growth. In particular, the plan includes a brownfield manufacturing unit for switchgear and expansion within the EPD segment, with another brownfield facility planned in Nashik, a key manufacturing hub in western India. The proposed cg power nashik plant aligns with a broader strategy to de-risk supply chains and shorten delivery cycles for domestic orders.
| Metric | Value |
|---|---|
| Revenue | Rs 3,281 crore (+14% YoY) |
| Net Profit | Rs 313 crore (+16.3% YoY) |
| EBITDA | Rs 397 crore (+4.3% YoY) |
| EBITDA Margin | 12.1% (vs 13.2% prior) |
| Other Income | Rs 83.6 crore |
| Tax Expense | Rs 114.6 crore |
Market reaction to the results reveals the complexity of the current environment. The cg power share price fell as much as 5.19% intraday to Rs 838.80 apiece on the NSE, and was trading 3.01% lower at Rs 857.20 per share as of 2:36 PM. These moves reflect a balance between robust topline growth and the pressure points in margin, tax outflows, and the execution risk associated with expansion plans. Investors typically weigh the strength of revenue growth against the health of margins and the pace at which new capacity can be integrated into production lines.
Cg Power Share Price Q1 Results: Revenue, Profit, And Market Reaction
The quarter’s headline figures show a resilient revenue trajectory. Revenue rose to Rs 3,281 crore, up 14% YoY from Rs 2,878 crore, while net profit extended gains to Rs 313 crore, up 16.3% YoY from Rs 269.2 crore. EBITDA improved to Rs 397 crore, up 4.3% YoY from Rs 381 crore, but the EBITDA margin narrowed to 12.1% from 13.2% previously. The combination of stronger top-line performance and softer margins paints a classic growth-versus-efficiency dynamic that investors monitor closely when evaluating the stock’s short- to medium-term potential. Other income surged to Rs 83.6 crore, a meaningful uplift from Rs 28.3 crore, providing a cushion to the earnings line. Tax expense rose to Rs 114.6 crore from Rs 96.9 crore, which also tempered net profit expansion. The growth in revenue and profit is healthy, but margin compression remains a focal point for future performance.
Cg Power Results: Revenue Growth And Margin Contraction
From the cg power results perspective, the 14% topline growth underscores continued demand for CG Power’s portfolio of switchgear and EPD solutions in a developing market. Yet the contraction of EBITDA margin to 12.1% from 13.2% highlights the cost and pricing pressures that often accompany rapid capacity expansion and changes in product mix. The 4.3% rise in EBITDA, while positive, may not fully translate into proportional net profit gains given the tax expense increase and the higher other income that supported earnings in the quarter. Investors should consider how the company’s improved topline might translate into steadier earnings if execution steps, such as cost containment and efficiency gains from the Nashik and other brownfield expansions, begin to contribute more meaningfully in the upcoming quarters.
Expansion Plans: Cg Power Nashik Plant And Brownfield Capacities
CG Power’s guidance includes brownfield manufacturing units for switchgear and for the Energy and Power Distribution (EPD) segment, alongside another brownfield unit in Nashik. The mention of a cg power nashik plant is particularly attention-worthy for investors who assess domestic manufacturing strength as a driver of long-term profitability. Brownfield expansions can offer faster ramp-ups and cost advantages if executed efficiently, potentially helping to improve margins over time as new production lines scale up and become more productive. The Nashik site, positioned within a major manufacturing belt, could help CG Power better serve regional customers and shorten supply chains for critical electrical equipment used in infrastructure projects and industrial modules.
Moreover, the switchgear segment, referenced in the expansion plan, remains a core part of CG Power’s business mix. The integration of a brownfield unit for switchgear with other capacity increases in the EPD segment can create synergies across procurement, manufacturing, and distribution. For investors, the path to a stronger earnings trajectory lies in the efficient absorption of incremental capacity, favorable product mix shifts, and the ability to maintain price discipline amid competitive forces. As always, execution risk remains a factor, and the Nashik plant’s performance over the next few quarters will be a bellwether for how effectively these expansions translate into higher margins and higher returns on invested capital.
For those who want deeper, institution-grade stock insights, Swastika’s Sarthi AI stock assistant can help simulate scenarios, compare peers, and test investment assumptions. Swastika's Sarthi AI stock assistant is a handy tool to explore how CG Power might perform as its capacity comes online and as market conditions evolve. This is where retail investors can bridge the gap between the numbers and practical investment decisions.
Investing Takeaways For Retail Investors And The Role Of Cg Power Earnings
From a retail-investor lens, the Q1 numbers suggest a growth engine backed by a clear strategic plan, but with a caveat: margins are under pressure as inputs and competitive dynamics weigh on profitability. The revenue story remains intact, supported by the company’s diversified exposure across switchgear and EPD products, and by ongoing expansion of manufacturing capacity through brownfield projects. The cg power earnings improvement is real, but the rate of profit expansion will depend on how quickly new capacity translates into higher volumes, better utilization, and improved cost structures as the Nashik plant and other brownfield facilities scale up. For investors, the key questions are: Will the new capacity translate into sustained margin recovery? How will tax outflows evolve as profitability grows? And how effectively can the company manage input costs and pricing in a competitive market?
Frequently Asked Questions
What were CG Power's consolidated revenue and net profit for the June quarter?
Consolidated revenue stood at Rs 3,281 crore, up 14% year over year, while net profit rose to Rs 313 crore, up 16.3% YoY.
What happened to cg power share price after the Q1 results?
The stock fell intraday as much as 5.19% to Rs 838.80 per share on the NSE, and was trading about 3.01% lower at Rs 857.20 per share as of 2:36 PM.
What was the EBITDA margin in Q1 and how did it compare to the previous year?
EBITDA margin was 12.1%, down from 13.2% in the prior year.
What expansions did CG Power announce?
The company plans brownfield manufacturing units for switchgear and its Energy and Power Distribution (EPD) segment, including a brownfield unit in Nashik.
What were other income and tax expense in Q1?
Other income was Rs 83.6 crore, up from Rs 28.3 crore, and tax expense rose to Rs 114.6 crore from Rs 96.9 crore.
Conclusion
This article was published without a generated conclusion. Please review and add a conclusion before publishing.
Open your trading and demat account here
Reference :
1 : Ndtvprofit

Mirae Asset Mutual Fund Login: A Deep Dive Into Mirae Asset Platinum SIF Sectoral Debt Long-Short Fund
Key Takeaways
- SEBI has received the SID draft for the mirae asset platinum sif Sectoral Debt Long-Short Fund, marking Mirae Asset's second SIF offering and first debt-focused strategy.
- The scheme adopts an interval investment strategy and aims to invest in high-yield debt instruments, with CRISIL Composite Credit Risk Index as the Tier-I benchmark.
- Subscriptions would be at NAV-based prices on all business days, but the offer is awaiting regulatory approval before investors can participate.
- Asset managers are increasingly eyeing the SIF framework to bring differentiated strategies beyond traditional mutual funds, signaling broader portfolio flexibility.
Could a sectoral debt long-short strategy redefine risk and return for Indian retail investors? The answer is evolving as SEBI’s Specialised Investment Fund (SIF) framework begins to catalyze differentiated product ideas. As of 24th July 2026 - 04:12 pm, the latest draft papers reveal a Sectoral Debt Long-Short Fund under the mirae asset sif umbrella, positioning it as the fund house’s second offering in the SIF segment and its first debt-focused strategy. For readers who search for mirae asset mutual fund login to monitor fund disclosures and track developments, this draft signals how access to information and evolving product design can influence decision-making.
The filing underscores a broader industry push to move beyond traditional mutual funds, offering strategies that can adapt to sector-specific credit landscapes. The draft SID clearly states the plan to employ an interval investment strategy, a feature that could alter deployment windows and liquidity management. In practical terms, the fund intends to earn returns by taking long and short positions in debt securities across targeted sectors, with the fund manager granted discretion to adjust credit and interest-rate risk in response to shifting market dynamics. This dynamic approach is a hallmark of the mirae asset sif framework, which seeks to combine active risk management with diversified exposure.
At the heart of the strategy is a focus on high-yield debt instruments. These securities typically offer higher yields than top-rated bonds but come with relatively higher credit risk. The benchmark selected for performance evaluation is the CRISIL Composite Credit Risk Index, designated as the Tier-I benchmark for the proposed scheme. This benchmark will serve as the primary reference point for assessing the fund’s performance after launch, ensuring that investors have a clear yardstick for risk-adjusted returns. The fund’s portfolio construction and sector allocation will depend on prevailing market conditions and the investment strategy adopted by the fund manager within the framework laid out in the SID.
What does this mean for you as a retail investor? The creation of a Sectoral Debt Long-Short Fund within the SIF structure reflects an industry-wide willingness to blend credit markets with flexible duration and sector bets. It also highlights how asset managers are experimenting with seven-figure (and higher) risk overlays in debt markets, aiming to capture yield premiums while hedging some downside via short positions. The fund’s status as a second offering under mirae asset sif signals growing appetite for differentiated approaches within the SIF space, expanding the set of viable options beyond conventional mutual funds. As with any new strategy, the key questions revolve around liquidity windows, risk controls, sector concentration, and how performance will be measured against a benchmark that captures credit risk and sectoral dynamics. For further clarity on specific fund details, some investors may refer to the phrase mirae asset emerging bluechip fund details in the context of related fund documentation, while monitoring the official SID for precise disclosures.
For those who want deeper qualitative insights and stock-level perspectives, Swastika offers a thoughtful resource through Swastika's Sarthi AI stock assistant, designed to augment retail investors’ toolkits with institutional-grade research. In parallel, continuing education about regime changes, liquidity cycles, and credit risk will be essential as SEBI completes its regulatory review of this new offering.
How The Mirae Asset Platinum SIF Sectoral Debt Long-Short Fund Uses An Interval Investment Strategy
The draft scheme, referred to in the documents as the mirae asset platinum sif Sectoral Debt Long-Short Fund, embodies an interval investment strategy that marks a practical application of the SIF concept in debt markets. The interval approach is described as an active investment strategy where the fund manager can adjust position sizes and risk exposures in response to evolving market conditions. In this context, the fund would pursue a balanced calculus of long exposures to high-yield debt securities in sectors deemed attractive, while maintaining short positions to hedge against credit deterioration or rising interest rates. The idea is to harvest yield from credit-sensitive instruments while containing downside through selective short bets, a structure that could offer a different risk/return profile than traditional buy-and-hold debt funds.
In the drafting notes, the portfolio construction for mirae asset platinum sif would depend on the market backdrop, with sector allocation driven by macro signals, credit spreads, and credit risk assessments. The emphasis on high-yield debt implies that the strategy may carry elevated credit risk relative to investment-grade peers; thus, performance would hinge on selective security selection and timing. The interval strategy would also shape liquidity management, as interval funds typically operate with redemption windows that are designed to balance liquidity with the fund’s ability to deploy capital into long and short debt positions. Taken together, these elements sketch a fund that is designed to be nimble in a credit-cycle environment, aiming to produce alpha through sector bets and credit-risk assessment.
From an investor-access standpoint, the fund’s setup under the mirae asset sif umbrella signals an intent to leverage a specialized structure under SEBI’s regulatory framework. The plan to pilot a debt-focused long-short approach within the SIF framework has drawn interest from other asset managers seeking differentiated investment products with broader portfolio flexibility than conventional mutual fund schemes. Until SEBI completes its review, the precise menu of subscription windows, minimum investment requirements, and fee structures remains to be announced. In the meantime, readers who want to connect the dots between fund-level strategy and its markets might also explore how mirae asset platinum sif would interact with sector exposures, credit risk, and yield dynamics in current market conditions.
For investors evaluating this type of strategy, the SIF structure could offer a distinctive path–one that blends sector-specific debt opportunities with downside hedges through short positions and a disciplined risk framework. As with any credit-centric approach, the outcome will depend on how effectively the fund manager can anticipate sector trajectories and manage credit risk across a changing interest-rate landscape. Investors should stay tuned to the SID’s updates and SEBI’s regulatory review timeline, and consider how such a fund could align with their risk tolerance, liquidity needs, and overall portfolio objectives.
To stay engaged or to get more granular, you can refer to the mirae asset emerging bluechip fund details as a comparative lens for how fund documentation presents strategies and risk disclosures; this can offer a baseline for understanding how sectoral bets in the debt space are framed in regulatory documentation and what to watch for in final disclosures.
The Focus On High-Yield Debt And The CRISIL Benchmark: What Investors Should Track
The draft SID explicitly states that the proposed scheme would predominantly invest in high-yield debt instruments. The appeal of high-yield debt is the potential for higher returns, but this must be weighed against the higher credit risk inherent in lower-rated issuances. The benchmark chosen for evaluating the fund’s performance is the CRISIL Composite Credit Risk Index, designated as the Tier-I benchmark. For investors, this emphasizes the need to scrutinize how the fund’s credit selection, sector concentration, and risk controls compare against the benchmark’s credit risk dynamics. Monitoring this benchmark can provide a practical lens for assessing how the fund navigates defaults, sector shocks, or rating transitions that could influence yields and capital preservation.
The fund’s ability to adapt its sector allocations in response to market conditions will be central to its risk/return profile. Because the strategy involves long and short positions in debt securities, a nuanced understanding of sectoral risk, macro credit transmission channels, and liquidity management will be essential for investors seeking to interpret performance relative to a credit-risk benchmark. This dynamic also means that the fund’s volatility could differ from traditional fixed-income products, underscoring the importance of aligning expectations with the strategy’s long-short design and interval liquidity features.
For readers seeking a more concrete sense of how this could play out, consider how the fund’s performance would interact with shifts in credit spreads or sector-specific credit events. The ongoing regulatory review will determine the precise structure, including redemption windows and pricing mechanics, but the core mandate–targeting high-yield debt with a long-short approach under a rigorous benchmark–points to a differentiated offering within the SIF landscape.
Regulatory And Investor Access: NAV-Based Pricing On All Business Days
One of the practical implications highlighted in the SID is that applications under the mirae asset platinum sif scheme would be at NAV-based prices on all business days. This pricing approach provides a transparent and timely reference point for investors, ensuring that subscription decisions align with the fund’s net asset value as market conditions evolve. However, the ultimate availability of the fund to investors will depend on the SEBI review and clearance process. Until regulatory approvals are in place, the offer remains in the drafting stage, and no formal subscriptions can be accepted.
From an investor’s perspective, this means keeping a close eye on regulatory milestones and official disclosures. The SIF framework itself is designed to expand the universe of investment strategies beyond those offered by conventional mutual funds, and the mirae asset sif platform is positioning this particular product as a pioneering debt-focused long-short strategy. Retail investors should align expectations around liquidity, capital preservation, and risk-adjusted returns within the context of a sectoral long-short approach, and monitor how the fund’s NAV-based pricing interacts with market liquidity during subscription windows once approved.
What This Means For Retail Investors And Your Next Steps
Retail investors should take a structured approach when a new fund enters the regulatory queue. The mirae asset sif draft reveals a strategy that aims to blend long and short debt exposures with a focus on high-yield instruments, guided by a benchmark that tracks credit risk. Investors who are evaluating this option should consider their risk tolerance, liquidity needs, and how a sectoral long-short debt strategy complements their existing fixed-income exposure. The interval investment framework suggests a different liquidity cadence than conventional funds, which could impact how and when capital is available for redemptions or reallocations.
As the regulatory review unfolds, keep an eye on the fund’s official SID, press notes, and SEBI advisories for details on minimum investment amounts, target sectors, and any risk disclosures that accompany a debt-focused long-short strategy. In the same breath, consider how this fund could fit into a diversified portfolio–potentially offering higher yield opportunities within a measured framework of risk controls. Investors should also be mindful of how sector concentration might interact with macro credit cycles and how the fund’s performance would be measured against the CRISIL index benchmark over different market regimes.
For readers who want to deepen their understanding beyond high-level concepts, the mirae asset emerging bluechip fund details phrase can serve as a comparative reference point for how fund disclosures present strategy, risk, and performance expectations. This broader context helps investors assess how sector-specific debt strategies are framed in regulatory documents and how they map to actual market exposures. If you want a practical, data-driven way to interpret these kinds of proposals, you can explore the Sarthi AI stock assistant to illuminate sector exposures and risk considerations at a granular level.
Frequently Asked Questions
What is the mirae asset platinum sif Sectoral Debt Long-Short Fund?
It is the Sectoral Debt Long-Short Fund proposed under the mirae asset sif framework, designed as Mirae Asset's second Specialised Investment Fund offering and the first debt-focused strategy within SIF. The fund plans to invest in high-yield debt instruments and uses an interval investment strategy, with the CRISIL Composite Credit Risk Index as the Tier-I benchmark.
When will investors be able to subscribe to this fund?
Subscriptions would occur only after SEBI reviews and grants necessary clearances. As per the draft SID, applications under the scheme would be at NAV-based prices on all business days once approved.
What does the interval investment strategy mean for this scheme?
The interval investment strategy is an active approach that allows the fund manager to adjust credit risk and interest-rate risk according to market dynamics. It involves investing in both long and short positions in debt securities across selected sectors.
What benchmark will guide the fund's performance?
The CRISIL Composite Credit Risk Index has been selected as the Tier-I benchmark, serving as the primary reference point for evaluating the scheme’s performance after launch.
Why is the SIF framework significant for retail investors?
The Specialised Investment Fund framework is designed to offer investment strategies beyond traditional mutual funds, enabling asset managers to introduce differentiated products with broader portfolio flexibility. This fund represents Mirae Asset’s expansion within the SIF space and indicates growing interest from other asset managers as well.
Conclusion
The mirae asset sif draft for a Sectoral Debt Long-Short Fund signals an important step in expanding the toolkit available to retail investors under SEBI’s new specialized framework. With interval investment mechanics, a focus on high-yield debt, and a CRISIL Composite Credit Risk Index benchmark, the fund aims to balance yield opportunities with sector risk controls in a way that conventional mutual funds may not. For investors, the key takeaway is to monitor regulatory status closely, evaluate how long-short sector bets could fit within your risk tolerance, and prepare for a potential new avenue of fixed-income exposure that blends credit analysis with dynamic risk management. The next step is straightforward: stay informed, assess your own portfolio needs, and be ready to engage with the fund once SEBI provides the required clearances.
Welspun Corp Share Price Angle After Rs 67.66 Crore Investment In Welspun Captive Power Generation
Key Takeaways
- Welspun Corp board approves Rs 67.66 crore investment to acquire 51% stake in Welspun Captive Power Generation.
- Post-deal, WCPGL ownership rises to 74% and becomes a subsidiary of Welspun Corp.
- 1,50,64,213 equity shares of Rs 10 each are involved in the transfer.
- Investors should monitor the welspun corp share price as the integration unfolds.
Investors watching the welspun corp share price will want to understand the board's decision on July 24, 2026, when Welspun Corp approved a Rs 67.66 crore investment to acquire 51% of Welspun Captive Power Generation (WCPGL) from promoter group Welspun Living (WLL). Upon completion, the aggregate equity stake of the company, together with its subsidiaries, in WCPGL will rise from 23% to 74%, turning WCPGL into a subsidiary of Welspun Corp.
Welspun Corp Share Price Outlook After Rs 67.66 Crore Investment In Welspun Captive Power Generation
The consolidation of control in WCPGL directly affects the power-generation assets that feed Welspun Corp's steel manufacturing operations. With 74% ownership, Welspun Corp gains greater leverage over decisions related to captive power supply, which can translate into more predictable energy costs and potentially improved margins over the medium term. However, the near-term trajectory for the welspun corp share price will hinge on how effectively WCPGL scales its output, negotiates favorable PPAs, and manages the capital required to sustain capacity expansion.
In practice, investors should expect a period of integration risk: aligning WCPGL's governance structure, integrating procurement and energy-management systems, and ensuring that WCPGL's project pipeline aligns with Welspun's capital allocation plan. If WCPGL delivers on capacity expansion and efficiency gains, the welcomed consequence could be a more stable cash flow profile for Welspun Corp, supporting the long-term welspun corp share price trajectory. The company may also consider transparent disclosures of energy savings and efficiency metrics, which can refuel investor confidence in the stock's earnings visibility.
Deal Terms And The Share Count
The board approved the acquisition of an additional 51% equity stake in WCPGL from Welspun Living (WLL), a promoter group company, at a consideration of Rs 67.66 crore. The equity shares involved are 1,50,64,213, with a face value of Rs 10 each. This implies a substantial consolidation of control in WCPGL under Welspun Corp and its subsidiaries, raising their aggregate stake in WCPGL from 23% to 74% after completion.
Table: Pre-Deal vs Post-Deal Ownership And Shares
| Metric | Pre-Deal | Post-Deal |
|---|---|---|
| Welspun Corp Group In WCPGL Ownership | 23% | 74% |
| Equity Shares Involved | To be announced | 1,50,64,213 |
| Deal Value | To be announced | Rs 67.66 crore |
From 23% To 74%: Ownership Build And Subsidiary Status
With the completion of the transaction, WCPGL will become a subsidiary of Welspun Corp. This structural shift aligns WCPGL’s governance with Welspun's broader strategy of strengthening energy resilience for its manufacturing base. The consequence is a more coherent financial view of Welspun's energy assets within a single corporate umbrella, reducing the fragmentation that often accompanies minority stakes in critical assets. Investors should monitor how this consolidation affects the debt-equity mix and the capital allocation framework, as well as any changes in WCPGL’s project financing posture.
Operationally, a 74% stake provides Welspun Corp with greater leverage to guide WCPGL's strategy and investment decisions. It can enable swifter decision-making on new capacity additions, maintenance cycles, and energy procurement terms. Yet, the success of this approach rests on WCPGL’s ability to deliver predictable generation output, maintain favorable tariffs, and navigate regulatory requirements that govern captive power generation in India.
Strategic Rationale For Retail Investors: Energy Resilience And Growth Potential
The core rationale is energy resilience. Captive power generation reduces exposure to volatile electricity tariffs and fosters cost discipline across Welspun's steel operations. If WCPGL continues to optimize its generation mix, secure favorable PPAs, and scale its capacity at a pace that matches Welspun’s production needs, the resulting cost savings could bolster EBITDA margins and cash flow generation. For retail investors, this means improved earnings clarity–assuming the project pipeline and execution risk are managed prudently.
Additionally, this deal could unlock strategic financing opportunities. A stronger captive generation platform may attract favorable tariff arrangements and more efficient capital allocation, potentially enabling Welspun to pursue other growth initiatives with better financing costs. However, as with any leverage-driven expansion, investors should keep an eye on debt levels and liquidity over the next few quarters as the integration progresses.
Risks, Monitoring, And The Path Forward For Welspun Corp Share Price
As the deal closes and WCPGL grows its footprint, investors should monitor regulatory filings, PPAs, and WCPGL's capacity-utilization metrics. Any deviation from expected performance, higher-than-anticipated capex, or delays in project execution could affect the welspun corp share price. In addition, energy-market volatility and changes in policy could influence the profitability of captive generation projects and the associated cash flows to Welspun Corp. A disciplined monitoring framework, including quarterly disclosures on WCPGL’s generation output, capacity additions, and efficiency gains, will help investors gauge the deal's impact on earnings power.
For investors who want a more dynamic, scenario-based view, Swastika's Sarthi AI stock assistant can provide tailored simulations and sensitivity analyses. Swastika's Sarthi AI stock assistant can help you explore outcomes under different energy pricing and capacity-utilization assumptions.
What Investors Should Watch Next: Integration Milestones, Cash Flows, And Pass-Through Effects
In the near term, the key questions are: How quickly will WCPGL complete its capacity expansion and integrate with Welspun's manufacturing lines? Will WCPGL secure favorable PPAs and maintain a stable revenue stream from captive generation? How will the increased stake affect Welspun's debt posture and cash flows? A positive trajectory would involve steady ramp-up of capacity without significant cost overruns, leading to improved energy-cost savings that translate into higher consolidated EBITDA margins and a more resilient welspun corp share price over time.
From a research perspective, consider constructing a baseline scenario around energy-captured savings, PPAs, and capacity-utilization rates to judge the deal's long-term value. The transformation is not just about ownership; it is about a more integrated energy backbone for Welspun's operations. Stakeholders should examine the precision of financial projections, the spread between captive generation costs and grid tariffs, and the timeline for realizing the expected benefits.
Frequently Asked Questions
What is the deal value and stake?
Rs 67.66 crore for a 51% equity stake in Welspun Captive Power Generation (WCPGL) acquired from promoter Welspun Living (WLL).
What is the post-deal ownership of WCPGL for Welspun Corp and its subsidiaries?
Post-completion, Welspun Corp and its subsidiaries will hold 74% of WCPGL, up from 23% prior to the transaction.
How many equity shares were involved in the transfer?
1,50,64,213 equity shares of face value Rs 10 each were transferred.
When did Welspun Corp's board approve the investment?
The board approved the investment at its meeting on 24 July 2026.
What happens to Welspun Captive Power Generation after the deal?
WCPGL will become a subsidiary of Welspun Corp after completion.
Conclusion
The Welspun board’s decision to acquire a 51% stake in Welspun Captive Power Generation for Rs 67.66 crore and push the combined stake to 74% marks a significant strategic shift. For retail investors, this is more than a corporate reshuffle; it’s a step toward energy-enabled consistency within a diversified manufacturing group, potentially reducing energy-related volatility in Welspun’s earnings. The real test will be execution–how quickly WCPGL scales its captive capacity, optimizes energy costs, and translates those efficiencies into steadier cash flow and improved margins.
Open your trading and demat account here
Reference :
.jpg)
Indo-MIM IPO Review 2026: Should You Subscribe?
Indo-MIM Limited IPO appears suitable for long-term investors looking to invest in a global precision engineering company with strong technological capabilities, consistent financial growth, and leadership in a niche manufacturing segment. The company's dominant position in Metal Injection Moulding (MIM), improving profitability, healthy return ratios, and reasonable long-term growth prospects make it an attractive business. However, investors should also consider the premium valuation, export dependence, and customer concentration before applying.
Unlike many manufacturing IPOs that compete primarily on scale, Indo-MIM operates in a highly specialised engineering segment where technical expertise, certifications, and long-standing customer relationships create significant entry barriers. This makes the investment case more dependent on business quality than short-term market sentiment.
TRY SARTHI - YOUR AI STOCK ASSISTANT
Why Indo-MIM Stands Out Among Manufacturing Companies
Many engineering companies manufacture standard industrial products that can easily be sourced from multiple suppliers. Indo-MIM operates differently.
The company specialises in Metal Injection Molding (MIM), an advanced manufacturing technology used to produce highly complex, miniature precision components that traditional machining or casting methods cannot manufacture economically.
This capability has helped Indo-MIM become the world's largest MIM component manufacturer, with an estimated 6.8% global market share in 2025.
Its products are used in industries where quality standards are extremely stringent, including:
- Automotive
- Medical devices
- Aerospace
- Defence
- Consumer electronics
- Industrial engineering
These industries require extensive supplier qualification, making customer relationships highly sticky once established.
A Business Built on High Entry Barriers
One of Indo-MIM's biggest competitive strengths isn't just its manufacturing capacity, it's the difficulty competitors face in replacing it.
For customers operating in sectors like aerospace, defence, and medical devices, changing component suppliers is a lengthy process involving:
- Product redesign
- Regulatory approvals
- Tool validation
- Quality audits
- Material testing
- Production trials
This process can take two to three years, making supplier switching expensive and time-consuming.
As a result, Indo-MIM enjoys a remarkable 91–92% repeat customer rate, providing better revenue stability than many traditional manufacturing businesses.
The company also controls several stages of production internally, including metal powder processing and feedstock preparation, helping maintain product consistency while improving margins.
Indo-MIM IPO: Key Details at a Glance
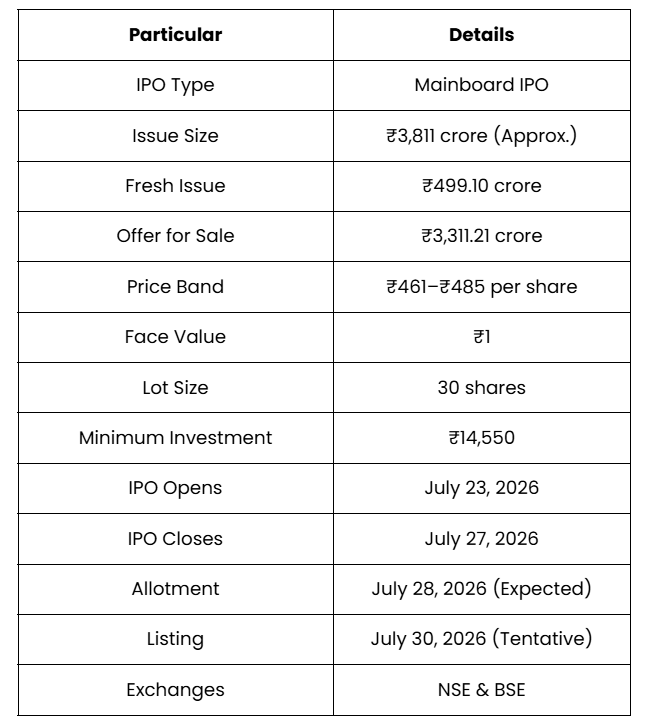
The fresh issue proceeds will primarily be used to repay outstanding borrowings, helping strengthen the company's balance sheet. Unlike pure Offer for Sale IPOs, Indo-MIM also raises fresh capital, meaning part of the money benefits the business directly.
Where Does Indo-MIM Generate Its Revenue?
Indo-MIM has built a diversified customer base across multiple industries instead of depending on a single sector. Its FY26 revenue mix reflects this balanced approach.
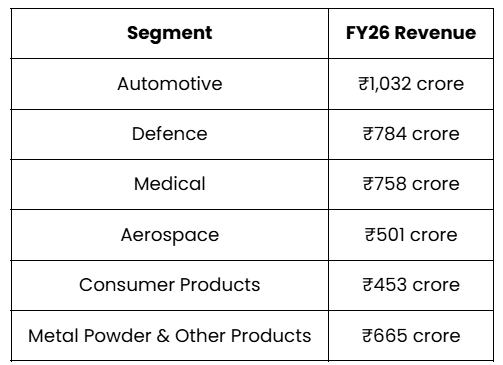
Automotive remains the largest contributor, but medical and aerospace have emerged as the fastest-growing businesses due to increasing demand for high-value precision components.
The company manufactures over 9,000 different products, serving customers across 55 countries through 15 manufacturing facilities located in India, the US, the UK, and Mexico.
This diversified revenue base reduces dependence on any single industry while allowing Indo-MIM to benefit from multiple long-term manufacturing trends.
Financial Performance: Is Indo-MIM Delivering Consistent Growth?
A good IPO is backed by more than just an interesting business model—it should also demonstrate consistent financial performance. Indo-MIM has delivered healthy growth across revenue, profitability, and return ratios over the past few years.
For FY26, the company reported total income of ₹4,320.70 crore, while revenue from operations stood at ₹4,192.98 crore. Its Profit After Tax (PAT) increased to ₹533.54 crore, supported by a better product mix, operational efficiencies, and strong demand from high-value sectors such as medical and aerospace. The company has also maintained healthy profitability margins:
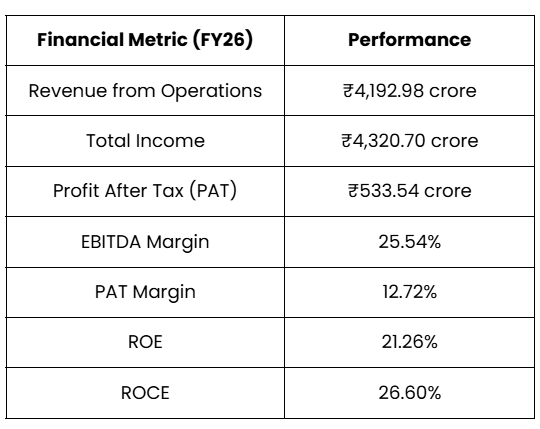
Between FY24 and FY26, revenue grew at a 21% CAGR, while profit increased at an even faster 37% CAGR. This indicates that the company has not only expanded its business but has also improved operating efficiency over time.
Another encouraging aspect is its strong return ratios. An ROE above 20% and ROCE of over 26% suggest that the company has been able to generate attractive returns on shareholder capital while maintaining operational discipline.
What Supports Indo-MIM's Long-Term Growth Story?
Several structural factors support the company's long-term outlook beyond the IPO.
Global Leadership in a Niche Industry
Unlike conventional engineering businesses, Metal Injection Moulding is a specialised manufacturing process with relatively few global players. Indo-MIM has established itself as the market leader by combining scale, technical expertise, and continuous product development. Its global market share of 6.8% has remained stable for several years, reinforcing its leadership position.
Strong Customer Retention
The company's repeat customer rate of more than 90% is one of its biggest competitive advantages. Customers operating in regulated industries generally continue sourcing components from approved suppliers for many years, resulting in stable repeat orders and better earnings visibility.
Diversified End Markets
Indo-MIM serves industries that are expected to witness long-term growth, including:
- Electric vehicles
- Defence manufacturing
- Aerospace
- Medical devices
- Consumer electronics
- Industrial automation
Since demand comes from multiple industries, weakness in one segment may be offset by growth in another.
Global Manufacturing Presence
The company operates 15 manufacturing facilities spread across India, the United States, the United Kingdom, and Mexico. This global footprint enables Indo-MIM to serve international customers more efficiently while reducing dependence on any single geography.
Factors Investors Should Carefully Evaluate Before Applying for Indo-MIM IPO
Despite its strengths, Indo-MIM is not without risks. Investors should consider these factors before applying for the IPO.
Heavy Dependence on Export Markets
Approximately 77% of FY26 revenue came from international markets. While exports provide access to larger markets, they also expose the company to:
- Currency fluctuations
- Trade policy changes
- Global economic slowdowns
- Geopolitical uncertainties
A prolonged slowdown in global manufacturing could affect future demand.
Customer Concentration
Although Indo-MIM serves numerous industries, its top 10 customers contributed nearly 38% of total revenue during FY26. The loss of a few large customers or delays in orders from key clients could impact financial performance.
Low Capacity Utilisation
Interestingly, the company's core MIM manufacturing facilities operated at only 30.6% capacity utilisation during FY26. This can be viewed in two different ways:
Positive View: The company has sufficient spare capacity to accommodate future growth without significant capital expenditure.
Risk View: Lower utilisation also means higher fixed costs are spread across fewer units, which can limit profitability if demand does not improve. Investors should monitor whether capacity utilisation increases over the next few years.
Dependence on Imported Raw Materials
Around 61% of raw materials were imported during FY26. This exposes the business to:
- Foreign exchange volatility
- Import restrictions
- Global supply chain disruptions
- Commodity price fluctuations
These factors could influence manufacturing costs and operating margins.
Regulatory and Legal Matters
According to the company's disclosures, Indo-MIM is involved in multiple tax and regulatory proceedings amounting to approximately ₹421 crore.
In addition, the Ministry of Corporate Affairs has issued show-cause notices relating to the appointment of a cost auditor for certain financial years. While the company has provided its explanation, investors should continue to monitor the outcome of these proceedings as part of their overall risk assessment.
Is the IPO Valuation Reasonable?
One of the biggest questions investors ask before applying for an IPO is whether the company is fairly priced. At the upper price band of ₹485, Indo-MIM is valued at a Price-to-Earnings (P/E) ratio of around 44–45x based on its FY26 earnings.
At first glance, this may appear expensive compared to several traditional manufacturing companies. However, Indo-MIM isn't a conventional engineering business. It operates in a niche technology-driven segment with limited global competition, high entry barriers, and strong pricing power.
Interestingly, there are no directly listed MIM companies in India, making peer comparison difficult. Its closest listed global peer, Jiangsu Gian Technology in China, trades at a significantly higher valuation of around 148x earnings. While international valuations should not be compared directly due to differences in business models and markets, the comparison suggests that Indo-MIM's pricing is not excessive for a market-leading niche manufacturer. Moreover, investors are also paying for:
- Global leadership in Metal Injection Moulding
- High customer retention
- Healthy profitability
- Strong return ratios
- Diversified end-user industries
- Established manufacturing footprint across multiple countries
Overall, while the IPO is not cheap in absolute terms, the valuation appears reasonable considering the quality of the business and its competitive positioning.
What is Driving Strong Investor Interest?
The IPO has already attracted significant institutional attention even before opening to the public. Ahead of the public issue, Indo-MIM raised approximately ₹1,141 crore from 92 anchor investors, including several globally recognised institutions such as:
- Goldman Sachs
- BlackRock
- ICICI Prudential Mutual Fund
- HDFC Mutual Fund
- SBI Mutual Fund
- Government Pension Fund Global
Strong participation from reputed institutional investors often reflects confidence in the company's long-term business prospects, although it should not be treated as an investment recommendation by itself.
Another reason for the positive sentiment is the company's unique positioning. Unlike many manufacturing IPOs entering crowded industries, Indo-MIM operates in a niche segment with limited global competition, making it a differentiated opportunity for investors.
Expert Opinion
As published in Business Standard, Santosh Meena, Head of Research at Swastika Investmart, considers Indo-MIM the strongest IPO among the current mainboard offerings. He believes the company's global leadership in Metal Injection Molding (MIM), diversified business across high-growth sectors, and the use of fresh issue proceeds to reduce debt strengthen its long-term investment case. According to him, Indo-MIM offers the best combination of long-term growth potential and listing gain prospects among the IPOs currently open for subscription.
Indo-MIM IPO Subscription Status and GMP
Investor participation during the first day of bidding indicates encouraging demand across categories.
Subscription Status (Day 1)
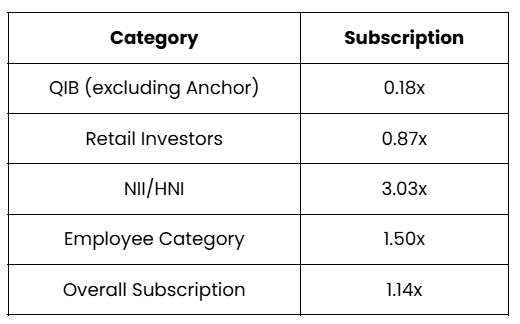
The strongest demand came from the Non-Institutional Investor (NII/HNI) category, while retail participation was still building on the opening day. Since IPO subscriptions typically increase during the final days, investors often watch subscription trends closely before making listing gain expectations.
Grey Market Premium (GMP)
As of July 23, 2026, the Indo-MIM IPO GMP is reported between ₹185 and ₹205. Based on the upper issue price of ₹485, the grey market indicates an estimated listing price of approximately ₹670–₹690, implying a potential listing premium of around 38% to 42%.
However, investors should remember that GMP is an unofficial market indicator based on demand in the grey market. It can change significantly before listing and should not be the sole basis for an investment decision.
Should You Apply for the Indo-MIM IPO?
The answer largely depends on your investment objective and risk appetite.
You may consider applying if you:
- Prefer investing in companies with global market leadership.
- Want exposure to advanced manufacturing and precision engineering.
- Have a medium- to long-term investment horizon.
- Appreciate businesses with strong return ratios and healthy profitability.
- Are comfortable investing in export-oriented manufacturing companies.
You may consider avoiding or waiting if you:
- Prefer low-valuation opportunities.
- Are uncomfortable with export-related risks.
- Prefer companies with diversified domestic revenue.
- Want businesses with lower customer concentration.
- Are primarily looking for predictable short-term listing gains.
Like every IPO, Indo-MIM should be evaluated based on your portfolio allocation and financial goals rather than only on market buzz or GMP.
Final Verdict - Apply or Not?
Indo-MIM is not just another engineering company entering the stock market. It has built a global leadership position in Metal Injection Moulding through decades of technical expertise, continuous innovation, and strong customer relationships.
The company combines healthy financial performance with high entry barriers, diversified end-user industries, and a business model that is difficult to replicate. While the IPO carries risks such as export dependence, customer concentration, and regulatory proceedings, these are partly balanced by its strong competitive advantages and improving profitability.
Considering its market leadership, healthy balance sheet, attractive return ratios, and long-term industry opportunities, the Indo-MIM IPO appears suitable for investors with a long-term investment horizon. Short-term listing performance, however, will continue to depend on subscription demand, market conditions, and overall investor sentiment.
Frequently Asked Questions (FAQs)
Why is Metal Injection Moulding (MIM) considered a high-entry-barrier business?
Metal Injection Moulding combines metallurgy with precision moulding to manufacture highly complex components that are difficult or uneconomical to produce using conventional machining. The technology requires specialised equipment, technical know-how, and years of customer qualification, making it difficult for new competitors to enter the market.
Why is Indo-MIM's repeat customer rate so high?
Most customers operate in highly regulated industries such as aerospace, defence, and medical devices. Switching suppliers involves lengthy testing, certifications, tooling changes, and regulatory approvals, which creates long-term customer relationships and encourages repeat business.
How will the fresh issue benefit the company?
A significant portion of the fresh issue proceeds will be used to repay or prepay outstanding borrowings. Lower debt can improve financial flexibility, reduce interest costs, and strengthen the balance sheet over the long term.
Does low capacity utilisation indicate weak demand?
Not necessarily. Lower utilisation also means the company has significant production capacity available to meet future demand without making major capital investments. If order volumes increase, this spare capacity can improve operating leverage and profitability.
Why are medical and aerospace segments becoming more important for Indo-MIM?
These industries require highly specialised precision components with stringent quality standards. Such products generally offer higher margins than standard engineering parts, helping improve the company's profitability and long-term growth potential.
Why are anchor investors important in an IPO?
Anchor investors are large institutional investors who invest before the IPO opens to the public. Their participation often reflects institutional confidence in the business, although retail investors should still conduct their own analysis before investing.
Conclusion
Indo-MIM combines global leadership, specialised manufacturing expertise, and strong financial performance, making it one of the notable engineering IPOs in recent years. Investors should balance its long-term growth potential against the associated business risks before making an investment decision. For more IPO reviews, stock market updates, and expert market insights, stay connected with Swastika Investmart.
Big Budget


Popular Articles





.avif)
.avif)

.avif)



START YOUR INVESTMENT JOURNEY
Get personalized advice from our experts
- Dedicated RM Support
- Smooth and Fast Trading App
