


Share Price Saudi Aramco And The Global Energy Narrative: A Guide For Indian Retail Investors




Key Takeaways
- Brent crude rose around 27% in two weeks, settling near $96.78 per barrel.
- US paused strikes on Iran while Houthis attacked Saudi oil facilities, signaling supply risks.
- On July 25, Indian petrol prices ranged widely, with Hyderabad petrol at ₹117.07 and Chandigarh diesel at ₹89.47.
- Retail investors can use Swastika's Sarthi AI stock assistant to track Aramco related moves and energy stocks for smarter decisions.
In a world where Brent crude has surged around 27% in two weeks, the share price saudi aramco and the energy narrative are no longer just headlines. For Indian retail investors, understanding these energy moves translates into smarter decisions about fuel exposure and stock portfolios. Brent settled at $96.78 per barrel on Friday as markets closed, with the US pausing strikes on Iran even as Houthis attacked Saudi oil installations in two ports on the Red Sea coast. The energy picture - 25 July's data on Indian refining and fuel rates across major cities - powers transportation, aviation, industries and households across the country.
How The Share Price Saudi Aramco Reflects Global Energy Flows For Indian Investors
In energy markets, the share price Saudi Aramco moves with global supply risk and price signals. The Brent movement described earlier shows how a single company can reflect the entire energy value chain. The aramco share price provides a constant read on supply shocks and demand changes in the Gulf and beyond. Traders also watch aramco stock news and saudi aramco market cap as barometers of how resilient energy assets perform during volatility. For Indian investors, the saudi aramco stock price and related energy assets give a real-time pulse on global energy flows.


Brent Crude Movements And What They Mean For Indian Retail Investors
Brent crude has moved sharply higher, rising about 27% in the past two weeks. The price dynamics are a reminder that energy markets are highly interconnected: global tensions, refinery capacity, and shipping constraints feed into domestic fuel costs and stock performance. The crude settlement near $96.78 per barrel shows that even in a paused-strike environment, supply concerns and demand recovery can sustain elevated prices. For Indian investors, this translates into heightened sensitivity for energy names, inflation-linked sectors and the consumer budget.
What The $96.78 Crude Settlement Means For Indian Fuel Costs And Stocks
The $96.78 per barrel crude settlement aligns with a patchwork across India: New Delhi petrol ₹102.12, Diesel ₹95.20; Kolkata petrol ₹113.51, Diesel ₹99.82; Mumbai petrol ₹111.21, Diesel ₹97.83; Chennai petrol ₹107.76, Diesel ₹99.55; Gurugram petrol ₹102.97, Diesel ₹95.64; Noida petrol ₹101.96, Diesel ₹95.44; Bengaluru petrol ₹111.68, Diesel ₹99.56; Bhubaneswar petrol ₹109.33, Diesel ₹101.02; Chandigarh petrol ₹101.54, Diesel ₹89.47; Hyderabad petrol ₹117.07, Diesel ₹105.22; Jaipur petrol ₹113.51, Diesel ₹98.54; Lucknow petrol ₹101.56, Diesel ₹95.06; Patna petrol ₹113.37, Diesel ₹99.36; Thiruvananthapuram petrol ₹115.49, Diesel ₹104.41. The 25 July update on energy refining notes that India operates 23 oil refineries that transform crude oil into a diverse range of fuels and petroleum products that power transportation, aviation, industries, agriculture and households.
City-Wise Petrol And Diesel Prices On 25 July 2026 And Their Investment Implications
There is a broad dispersion in domestic fuel rates, reflecting both local distribution dynamics and global energy costs. Below is a snapshot of petrol and diesel rates in major Indian cities as of 25 July 2026.
| City | Petrol (₹) | Diesel (₹) |
|---|---|---|
| New Delhi | ₹102.12 | ₹95.20 |
| Kolkata | ₹113.51 | ₹99.82 |
| Mumbai | ₹111.21 | ₹97.83 |
| Chennai | ₹107.76 | ₹99.55 |
| Gurugram | ₹102.97 | ₹95.64 |
| Noida | ₹101.96 | ₹95.44 |
| Bengaluru | ₹111.68 | ₹99.56 |
| Bhubaneswar | ₹109.33 | ₹101.02 |
| Chandigarh | ₹101.54 | ₹89.47 |
| Hyderabad | ₹117.07 | ₹105.22 |
| Jaipur | ₹113.51 | ₹98.54 |
| Lucknow | ₹101.56 | ₹95.06 |
| Patna | ₹113.37 | ₹99.36 |
| Thiruvananthapuram | ₹115.49 | ₹104.41 |
Note: On 25 July, data from Good Returns indicate the Indian refining capacity is a global hub, transforming crude into a diverse range of fuels and petroleum products used across transport, aviation, industry and households. The energy narrative also notes India not only meets domestic needs but also exports high-quality petroleum products, strengthening global energy supply chains and reinforcing India's position in the landscape.
In the US-Iran tension landscape, the two-way escalation around the Strait of Hormuz continues to fuel energy risk. Jizan and Yanbu port towns housing Aramco facilities were attacked, prompting Saudi-led coalition strikes on Houthi positions in response. The pause in new strikes by the US underscores the complexity of policy responses and their impact on energy pricing and Aramco’s operations. The reference to the 17 June peace deal underscores the fragility of regional stability and its potential consequences for energy markets.
For deeper qualitative and quantitative insight on energy stocks and Aramco-linked assets, Swastika offers research products and Swastika's Sarthi AI stock assistant to help tailor stock screens to energy price regimes and geopolitical risk scenarios.
Related Reads
Frequently Asked Questions
What does the Brent crude price movement indicate for Indian investors?
Brent crude rose about 27% in two weeks and settled around $96.78 per barrel, signaling elevated energy risk, potential inflationary pressure, and greater sensitivity in energy-heavy stocks and funds.
How do petrol and diesel price data across Indian cities on 25 July illustrate domestic price dispersion?
The data show wide variation: petrol ranges from roughly ₹101.54 to ₹117.07 and diesel from ₹89.47 to ₹105.22 across cities.
What is the impact of US-Iran tensions on energy markets and Aramco-linked assets?
Tensions add supply risk; the US paused new strikes on Iran while attacks on Saudi Aramco facilities occurred, highlighting how geopolitical risk can influence energy prices and Aramco-linked equities.
Where can I get deeper energy stock analysis and Aramco moves?
Swastika offers its Sarthi AI stock assistant for tailored energy stock insights and scenario planning.
What does aramco share price signal for investors?
aramco share price signals how Saudi Aramco's stock tracks global energy flows and risk, serving as a proxy for energy-market health and potential impacts on related Indian stocks.
Conclusion
Retail investors should treat energy price signals as a leading indicator for equity exposure within the broader portfolio. The energy narrative–from Brent’s moves to Indian fuel cost dispersion and Aramco-linked equities–provides a framework for smarter risk management and smarter entry points. Build a simple energy scenario in your watchlist: if Brent or the aramco share price trends higher on geopolitical risk, consider rebalancing toward inflation-resilient sectors or energy-linked funds, while monitoring the domestic fuel price curve.
Open your trading and demat account here
Reference :
1 : Livemint
Latest Articles
Share Price Saudi Aramco And The Global Energy Narrative: A Guide For Indian Retail Investors


Key Takeaways
- Brent crude rose around 27% in two weeks, settling near $96.78 per barrel.
- US paused strikes on Iran while Houthis attacked Saudi oil facilities, signaling supply risks.
- On July 25, Indian petrol prices ranged widely, with Hyderabad petrol at ₹117.07 and Chandigarh diesel at ₹89.47.
- Retail investors can use Swastika's Sarthi AI stock assistant to track Aramco related moves and energy stocks for smarter decisions.
In a world where Brent crude has surged around 27% in two weeks, the share price saudi aramco and the energy narrative are no longer just headlines. For Indian retail investors, understanding these energy moves translates into smarter decisions about fuel exposure and stock portfolios. Brent settled at $96.78 per barrel on Friday as markets closed, with the US pausing strikes on Iran even as Houthis attacked Saudi oil installations in two ports on the Red Sea coast. The energy picture - 25 July's data on Indian refining and fuel rates across major cities - powers transportation, aviation, industries and households across the country.
How The Share Price Saudi Aramco Reflects Global Energy Flows For Indian Investors
In energy markets, the share price Saudi Aramco moves with global supply risk and price signals. The Brent movement described earlier shows how a single company can reflect the entire energy value chain. The aramco share price provides a constant read on supply shocks and demand changes in the Gulf and beyond. Traders also watch aramco stock news and saudi aramco market cap as barometers of how resilient energy assets perform during volatility. For Indian investors, the saudi aramco stock price and related energy assets give a real-time pulse on global energy flows.
Brent Crude Movements And What They Mean For Indian Retail Investors
Brent crude has moved sharply higher, rising about 27% in the past two weeks. The price dynamics are a reminder that energy markets are highly interconnected: global tensions, refinery capacity, and shipping constraints feed into domestic fuel costs and stock performance. The crude settlement near $96.78 per barrel shows that even in a paused-strike environment, supply concerns and demand recovery can sustain elevated prices. For Indian investors, this translates into heightened sensitivity for energy names, inflation-linked sectors and the consumer budget.
What The $96.78 Crude Settlement Means For Indian Fuel Costs And Stocks
The $96.78 per barrel crude settlement aligns with a patchwork across India: New Delhi petrol ₹102.12, Diesel ₹95.20; Kolkata petrol ₹113.51, Diesel ₹99.82; Mumbai petrol ₹111.21, Diesel ₹97.83; Chennai petrol ₹107.76, Diesel ₹99.55; Gurugram petrol ₹102.97, Diesel ₹95.64; Noida petrol ₹101.96, Diesel ₹95.44; Bengaluru petrol ₹111.68, Diesel ₹99.56; Bhubaneswar petrol ₹109.33, Diesel ₹101.02; Chandigarh petrol ₹101.54, Diesel ₹89.47; Hyderabad petrol ₹117.07, Diesel ₹105.22; Jaipur petrol ₹113.51, Diesel ₹98.54; Lucknow petrol ₹101.56, Diesel ₹95.06; Patna petrol ₹113.37, Diesel ₹99.36; Thiruvananthapuram petrol ₹115.49, Diesel ₹104.41. The 25 July update on energy refining notes that India operates 23 oil refineries that transform crude oil into a diverse range of fuels and petroleum products that power transportation, aviation, industries, agriculture and households.
City-Wise Petrol And Diesel Prices On 25 July 2026 And Their Investment Implications
There is a broad dispersion in domestic fuel rates, reflecting both local distribution dynamics and global energy costs. Below is a snapshot of petrol and diesel rates in major Indian cities as of 25 July 2026.
| City | Petrol (₹) | Diesel (₹) |
|---|---|---|
| New Delhi | ₹102.12 | ₹95.20 |
| Kolkata | ₹113.51 | ₹99.82 |
| Mumbai | ₹111.21 | ₹97.83 |
| Chennai | ₹107.76 | ₹99.55 |
| Gurugram | ₹102.97 | ₹95.64 |
| Noida | ₹101.96 | ₹95.44 |
| Bengaluru | ₹111.68 | ₹99.56 |
| Bhubaneswar | ₹109.33 | ₹101.02 |
| Chandigarh | ₹101.54 | ₹89.47 |
| Hyderabad | ₹117.07 | ₹105.22 |
| Jaipur | ₹113.51 | ₹98.54 |
| Lucknow | ₹101.56 | ₹95.06 |
| Patna | ₹113.37 | ₹99.36 |
| Thiruvananthapuram | ₹115.49 | ₹104.41 |
Note: On 25 July, data from Good Returns indicate the Indian refining capacity is a global hub, transforming crude into a diverse range of fuels and petroleum products used across transport, aviation, industry and households. The energy narrative also notes India not only meets domestic needs but also exports high-quality petroleum products, strengthening global energy supply chains and reinforcing India's position in the landscape.
In the US-Iran tension landscape, the two-way escalation around the Strait of Hormuz continues to fuel energy risk. Jizan and Yanbu port towns housing Aramco facilities were attacked, prompting Saudi-led coalition strikes on Houthi positions in response. The pause in new strikes by the US underscores the complexity of policy responses and their impact on energy pricing and Aramco’s operations. The reference to the 17 June peace deal underscores the fragility of regional stability and its potential consequences for energy markets.
For deeper qualitative and quantitative insight on energy stocks and Aramco-linked assets, Swastika offers research products and Swastika's Sarthi AI stock assistant to help tailor stock screens to energy price regimes and geopolitical risk scenarios.
Related Reads
Frequently Asked Questions
What does the Brent crude price movement indicate for Indian investors?
Brent crude rose about 27% in two weeks and settled around $96.78 per barrel, signaling elevated energy risk, potential inflationary pressure, and greater sensitivity in energy-heavy stocks and funds.
How do petrol and diesel price data across Indian cities on 25 July illustrate domestic price dispersion?
The data show wide variation: petrol ranges from roughly ₹101.54 to ₹117.07 and diesel from ₹89.47 to ₹105.22 across cities.
What is the impact of US-Iran tensions on energy markets and Aramco-linked assets?
Tensions add supply risk; the US paused new strikes on Iran while attacks on Saudi Aramco facilities occurred, highlighting how geopolitical risk can influence energy prices and Aramco-linked equities.
Where can I get deeper energy stock analysis and Aramco moves?
Swastika offers its Sarthi AI stock assistant for tailored energy stock insights and scenario planning.
What does aramco share price signal for investors?
aramco share price signals how Saudi Aramco's stock tracks global energy flows and risk, serving as a proxy for energy-market health and potential impacts on related Indian stocks.
Conclusion
Retail investors should treat energy price signals as a leading indicator for equity exposure within the broader portfolio. The energy narrative–from Brent’s moves to Indian fuel cost dispersion and Aramco-linked equities–provides a framework for smarter risk management and smarter entry points. Build a simple energy scenario in your watchlist: if Brent or the aramco share price trends higher on geopolitical risk, consider rebalancing toward inflation-resilient sectors or energy-linked funds, while monitoring the domestic fuel price curve.
Open your trading and demat account here
Reference :
1 : Livemint

SBI Share Price: What Retail Investors Should Watch In 2026
Key Takeaways
- On 25 Jul 2026 at 18:21 IST, an Adyar, Chennai incident involving Kayalvizhi drew attention to branch governance.
- The SBI bank filed a police complaint after CCTV visuals captured the moment of confrontation.
- Investors should watch sbi share price and related state bank of india stock price trends for signals.
- Swastika's Sarthi AI stock assistant offers deeper stock insights.
On 25 Jul 2026, 18:21 IST, Adyar, Chennai witnessed a branch incident at an SBI location housed in a building described as Kayalvizhi's building. Kayalvizhi, daughter of MK Alagiri, reportedly slapped the SBI bank manager in a dispute that began over a non-functioning lift inside the building. CCTV visuals captured the moment, and the bank filed a police complaint. This is not merely local drama; it is a real-time study of how governance signals, customer experience, and media narratives can influence perceptions of the sbi share price.
What The Adyar Incident Reveals About Governance Risk For The State Bank Of India
The Adyar episode highlights how governance and customer-safety concerns can cascade into investor sentiment. When a branch-level incident becomes public, it can amplify perceptions about controls, risk management, and accountability–factors that historically feed into the state of the sbi bank news cycle. While CCTV visuals provide a documented record of the moment, the lasting takeaway for the retail investor is how such signals interact with broader macro trends and with the sbi stock price movements. In the short run, the event may create noise in the headlines, but long-run price discovery remains driven by fundamentals like loan growth, asset quality, and capital adequacy. For observers, it also underscores why tracking the state bank of india shares and broader sbi bank news remains essential for a holistic view of the banking sector.
Impact On The SBI Share Price Short-Term And What It Means For Retail Investors
News events with governance content can trigger short-term volatility in the sbi share price as traders price in governance risk and potential changes in internal controls. Investors should not assume a direct causal link from a single incident to the entire price trajectory. Instead, view price action as a function of how such signals affect risk premia, funding costs, and the bank's ability to sustain growth. The key is to compare the incident-driven movement with the broader context of Indian banking sector trends and the macro backdrop–because the sbi stock price often reflects a blend of idiosyncratic news and system-wide dynamics. In practice, prudent investors anchor decisions to fundamentals such as capital adequacy, loan growth, and asset quality while monitoring sentiment shifts that such events can induce.
How Local Narrative Interacts With Banking Sector Trends
The Adyar event sits within a larger banking system story. As the sector gradually returns to growth, investors watch for how SBI manages customer experience, compliance, and governance, which in turn can influence both the sbi bank news tone and the sbi stock price’s medium-term path. A single incident will rarely move the state bank of india stock price meaningfully on its own; what matters is the speed and clarity of the bank's response, the transparency of investigations, and the quality of public communications. For retail investors, synthesizing local incidents with sector-wide indicators–such as credit growth dynamics, asset quality, capitalization levels, and regulatory developments–offers a more reliable read on the trajectory of the state bank of india shares and the overall market sentiment for this pillar of Indian finance.
What To Watch Next For Sbi Stock Price And State Bank Of India Shares
To navigate post-event price action, retail investors should maintain a simple checklist: monitor ongoing sbi branch news and sbi bank news from credible sources; track the sbi stock price for noise versus trend; observe state bank of india stock price changes alongside loan growth and asset quality; and consider how governance resolutions and leadership communications might alter risk pricing. An orderly approach is essential because the bank’s fundamentals–capital adequacy, earnings stability, and growth trajectory–ultimately shape the long-run trajectory of the state bank of india shares, independent of any single incident. This approach helps prevent overreaction to local news and keeps focus on the aspects that truly move fundamentals over time.
Related Reads
Frequently Asked Questions
What happened at the SBI branch in Adyar on July 25, 2026?
According to the source material, Kayalvizhi, daughter of MK Alagiri, arrived at an SBI bank branch in Adyar, Chennai, to discuss a non-functioning lift. An argument with the bank manager escalated and she reportedly slapped him. CCTV visuals captured the moment, and the bank filed a police complaint.
Who is Kayalvizhi in relation to MK Alagiri?
Kayalvizhi is the daughter of MK Alagiri (Mu. Ka. Alagiri).
What actions did SBI take following the incident?
The bank filed a police complaint at the local station and CCTV visuals were used as part of the record.
What is the video title text associated with this incident?
The video title text included a sensational phrase: Breaking : மு.க.அழகிரி மகள் அடாவடி.. கன்னத்தில் விழுந்த பளார் அடி.. | MK Alagiri | Attack.
Where can readers learn more about Swastika's research tools?
Readers can explore Swastika's AI stock assistant via this link: Swastika's Sarthi AI stock assistant: https://www.swastika.co.in/sarthi
Conclusion
Retail investors should treat this Adyar incident as a reminder that governance signals and public narratives can influence sentiment in the near term, even as fundamentals quietly drive long-run outcomes. The event underscores the importance of watching not only the sbi share price but also the broader context–state bank of india stock price trends, state bank of india shares, and sbi bank news–when forming a view on SBI’s resilience and its growth trajectory. As you translate these signals into your own portfolio framework, use a steady mental model: separate noise from fundamentals, corrobor news with fundamentals, and test your view against sector benchmarks. A practical next step is to integrate news signals with a disciplined checklist and consider how governance-related news affects risk pricing in your investment horizon.
Open your trading and demat account here
Reference :
1 : Polimernews

Understanding SBI Savings Tax: Why Keeping Money In A Savings Account May Lose Real Value To Tax And Inflation
Key Takeaways
- Keeping money in a savings account above exemptions can trigger sbi savings tax on interest.
- At 2.70%–3.50% gross yields, after-tax returns hover around 2.41%; inflation around 5% can erode real value.
- Senior citizens benefit from exemptions under 80TTA (10,000) and 80TTB (50,000) per financial year, reducing tax impact.
- Practical options to cushion losses include auto sweep to FD, sbi liquid funds, and sbi arbitrage funds.
Most retail investors assume that money parked in a bank savings account grows risk-free. Yet, when balances exceed tax-exemption thresholds, a phenomenon often left unspoken can erode real value – the sbi savings tax on interest earnings. The current savings account interest range sits between 2.70% and 3.50% per year, and under the present income tax rules, interest earned above a threshold is taxed as part of total income. The question is: how big is the bite, and what can you do about it?
To understand the math, consider the core numbers and rules that govern your bank balances. The typical savings account offers 2.70% to 3.50% interest. For individuals aged 60 and above, the 80TTA exemption allows up to Rs 10,000 per financial year on savings account interest. Senior citizens also benefit from 80TTB, which provides an exemption up to Rs 50,000 per financial year and extends to all interest bearing instruments, including savings accounts, RD, and FD. The balance of interest beyond these exemptions gets taxed as part of your total income, potentially at your slab rate.
In a simple scenario, suppose you earn 3.50% gross interest. The tax bite could be around 1.09% (assuming a 30% tax slab on the portion of interest that falls outside exemptions). That leaves post tax interest of about 2.41%. If inflation runs at roughly 5%, the annual loss in real value would be around 3.09%. In other words, funds kept in a savings account above the exemption thresholds can steadily lose purchasing power over time if you don’t optimize allocations. These figures reflect the core data and regulatory framework, not a single bank’s offer.
Table: Quick snapshot of the key data points
| Metric | Value |
|---|---|
| Current Savings Account Interest Range | 2.70% – 3.50% |
| Exemption Under 80TTA (60+ Individuals) | Rs 10,000 per financial year |
| Exemption Under 80TTB (Senior Citizens) | Rs 50,000 per financial year |
| Tax On Interest (Assuming 30% Slab, After Threshold) | Approximately 1.09% |
| Post Tax Interest | Approximately 2.41% |
| Inflation Assumed | About 5% |
| Real Annual Loss (With Inflation) | Approximately 3.09% |
What this means for a retail investor is straightforward: the combination of tax on interest above exemptions and inflation can turn a nominal savings gain into a real value erosion. It’s not that savings accounts are inherently bad; it’s that the tax framework and inflation dynamics fundamentally change the value proposition of keeping a large cash balance parked in a basic savings facility. If you want to stay ahead of this erosion, you need a structured plan that respects the tax rules while seeking safer, higher quality yield options for portions of your cash.
Exemption Rules: 80TTA And 80TTB Explained For Savings Account Interest
The tax exemptions that matter for savings account interest hinge on two sections of the Income Tax Act, and they apply differently depending on age and instrument type. Under 80TTA, individuals aged 60 and above can claim a maximum exemption of Rs 10,000 per financial year on savings account interest. Importantly, 80TTA applies only to savings account interest; it does not extend to fixed deposits (FD) or recurring deposits (RD). In contrast, 80TTB is a broader concession crafted for senior citizens aged 60 and above. It offers a higher exemption ceiling of Rs 50,000 per financial year and covers interest earned from savings accounts as well as RD, FD, and all other interest bearing instruments. The practical effect is that a senior citizen can shelter a larger slice of interest income from tax, which directly improves after tax cash flow from cash holdings.
For instance, if you are in the 30% tax slab and you have a sizable savings balance, the portion of interest that exceeds these exemption thresholds will be taxed at your slab rate. This is the core reason why the marginal benefit of keeping more funds in a savings account diminishes with higher balances. This is not a one size fits all rule; the thresholds are per financial year, and the exemptions apply to the specific instrument categories described above. Investors should map their cash across instruments with these limits in mind to optimize tax outcomes over the year.
Guarding Your Savings With Auto Sweep, SBI Liquid Funds, And SBI Arbitrage Funds
To combat the immediate drag from taxes on interest, many investors look to practical strategies that can improve risk adjusted cash returns while staying within regulatory boundaries. One widely used approach is an auto sweep mechanism. An auto sweep automatically shifts excess balance above a chosen threshold to a higher yield instrument, typically a fixed deposit. The FD rate referenced in this guard strategy is around 6% to 7% in many market settings, offering a meaningful uplift over plain savings interest while preserving liquidity. In practice, an sbi auto sweep (or similar feature) helps you earn a higher yield on ancillary cash without actively managing the instrument allocation every day.
A second line of defense is allocation to liquid mutual funds. These funds are designed to maintain high liquidity while aiming for returns that comfortably exceed ordinary savings account rates. They are pitched as safer, more return efficient cash alternatives compared to keeping funds purely in a savings account. The idea is to keep reserves in a compound instrument that can be redeemed quickly, providing liquidity while potentially delivering better after tax outcomes than a flat savings interest rate.
Third, some investors consider sbi arbitrage funds as part of their cash strategy. The content notes a tax treatment advantage for gains under this plan, with a stated exemption up to Rs 1.25 lakh per year on gains from arbitrage funds. This can be an attractive tax efficient way to access relatively stable equity like returns while keeping a portion of cash in a tax efficient wrapper. It is essential to understand the specific tax treatment of arbitrage funds–these funds are equity oriented and have unique tax rules compared to pure debt instruments. The correct balance depends on your tax bracket, risk tolerance, and investment horizon.
When integrating these options, it’s prudent to consider the interplay between your sbi savings tax exposure and the tax characteristics of alternative cash instruments. Always align your choice with your liquidity needs, risk appetite, and the tax optimizing rules that apply to your financial year. If you want deeper, stock level research that can complement your macro cash strategy, you can explore Swastika's Swastika's Sarthi AI stock assistant for institutional grade insights on any stock or index.
Practical Steps To Protect The Real Value Of Your Savings: An Actionable Plan
Armed with the tax thresholds and returns profile, here is a concise plan retail investors can start using today. First, assess and optimize your sbi savings account minimum balance. Maintaining the minimum can help avoid service charges while keeping your cash accessible. However, do not let the balance swell purely to harvest exemption; the tax on interest above thresholds still applies and inflation can erode value if the bulk sits in a low return vehicle.
- Step 1: Map your cash across the bands that trigger exemptions (80TTA ₹10,000 for 60+, 80TTB ₹50,000 for senior citizens). Only the portion of interest above these thresholds is taxed, so plan the balance accordingly.
- Step 2: Use an sbi auto sweep to move excess cash into a higher yield FD with rates around 6–7%. This locks in better pre tax returns on the idle portion of the balance while keeping liquidity in check.
- Step 3: Consider allocating a portion to sbi liquid funds for liquidity with potentially higher after tax yields than a standard savings account, while still preserving safety and ease of redemption.
- Step 4: For larger tax efficient gains, explore sbi arbitrage funds as a tax efficient cash alternative, subject to your risk tolerance and horizon. Remember the exemption up to Rs 1.25 lakh per year applies to gains from arbitrage funds, which can help in tax planning.
- Step 5: Review your overall portfolio for inflation risk. If your living expenses or financial goals demand real gains, rebalance toward instruments with better post tax inflation protection. Always compare post tax yields after applying exemptions and slab rates to avoid over allocating to low return cash.
- Step 6: Use educational tools and professional guidance to stay updated on exemptions and rates. If you want a deeper, data driven look at stock and index opportunities that complement a cash plan, click the Sarthi link above.
These steps integrate the core tax and inflation dynamics with practical vehicle choices, allowing a retail investor to optimize cash management while staying aligned with SEBI regulatory norms. The aim is to keep the liquidity you need while protecting purchasing power over time rather than chasing nominal gains that vanish under inflation and taxes.
Frequently Asked Questions
What exactly is SBI savings tax and who bears it?
SBI savings tax refers to the tax on interest earned from savings account balances once you exceed the applicable exemptions. The excess interest is added to your total income and taxed at your slab rate. The exemptions come from 80TTA (up to Rs 10,000 for those aged 60+) and 80TTB (up to Rs 50,000 for senior citizens) depending on the instrument category.
What are the exemptions under 80TTA and 80TTB for savings account interest?
80TTA provides an exemption up to Rs 10,000 per financial year on savings account interest for individuals aged 60 and above. 80TTB provides a higher exemption up to Rs 50,000 per financial year for senior citizens and applies to savings accounts as well as RD, FD, and all interest‑bearing instruments.
How does the tax on savings account interest affect a typical 30% slab investor?
For a person in the 30% tax slab, interest earned beyond the 80TTA/80TTB exemptions is taxed at the slab rate. With a gross rate of 3.50%, tax could be around 1.09%, leaving post‑tax interest near 2.41%. If inflation is about 5%, real value declines by roughly 3.09% per year on that cash.
What are practical ways to guard against tax losses on savings income?
Practical methods include using an auto sweep to move excess cash into higher‑yield fixed deposits (FDs around 6–7%), considering sbi liquid funds for higher liquidity with potentially better post‑tax yields, and evaluating sbi arbitrage funds, which offer tax exemptions on gains up to Rs 1.25 lakh per year. Always balance liquidity, risk, and tax efficiency for your situation.
Where can I get deeper insights to align cash strategies with stock opportunities?
For institutional‑level insights on stocks and indices that can complement a cash strategy, you can explore Swastika's Sarthi AI stock assistant:Swastika's Sarthi AI stock assistant.
Conclusion
Real value matters more than nominal interest. For an Indian retail investor, the combination of sbi savings tax and inflation means that large cash balances in a plain savings account can erode purchasing power over a financial year. By understanding 80TTA and 80TTB exemptions, leveraging auto sweep, and considering higher yield, tax efficient options like sbi liquid funds and sbi arbitrage funds, you can stack the odds in favor of preserving value while maintaining liquidity. The next step is to translate this understanding into a concrete, implementable plan for your cash: review your balances, align instrument choices with your exemption thresholds, and adopt a disciplined approach to harvesting higher post tax yields without sacrificing access to funds when you need them.
Open your trading and demat account here
Reference :
1 : Tamil

Wipro Share Price And Ex-Date Week: Navigating 110+ Dividend Payouts And Bonus Issues
Key Takeaways
- More than 110 stocks fixed record dates for dividends and bonuses this week.
- UltraTech Cement leads payouts with Rs 240 per share on Thursday.
- Britannia leads on Friday with Rs 90.5 per share.
- Investors must hold shares before the record date to qualify for payouts.
As the ex-date week for dividends and bonus issues unfolds, more than 110 stocks have fixed record dates for payouts. This milestone puts the spotlight on the wipro share price as investors weigh upcoming dividends and bonus issues. If you hold shares on the record date, you stand to receive the payout; if not, the entitlement slips away. This guide decodes what this week means for retail investors and how to position your portfolio for the rest of the week.
Between Monday, July 27, and Friday, July 31, a wave of corporate actions spans among large-cap, mid-cap, and a few small-cap names. Notable payouts include UltraTech Cement’s Rs 240 per share; Britannia’s Rs 90.5 per share; and a layered mix of final dividends, interim payouts, and bonus issues. The list is dynamic and tentative, with more names likely to be added as firms finalize boardroom approvals and regulatory clearances. For an investor, the keys are timing, eligibility, and how these payouts interact with price action and portfolio taxation considerations.
With that in mind, this piece provides a practical, investor-friendly view: what to expect, how to qualify, and how to avoid missing out on a single rupee of the promised payout. The aim is to empower you to confirm record dates, verify your demat holdings, and adjust your expectations as the ex-date week unfolds. If you want deeper, stock-specific insights as the dates move, consider Swastika's Sarthi AI stock assistant for real-time signals and analysis.
Notes: The schedule here reflects the reported fixed record dates and dividend actions within the given week. The list remains tentative, as additional corporations may fix record dates or announce new actions in the days ahead. The figures cited for per-share payouts are the amounts disclosed for each stock’s dividend or final payout and are subject to regulatory and corporate actions confirmation.
Wipro Share Price Movements Ahead Of The Ex-Date Week
Forward-looking investors often anchor decisions on the wipro share price as the ex-date window approaches. The week’s action includes a mix of interim and final dividends, as well as potential bonus issues across a broad set of names. Notably, Wipro itself announced an interim dividend of Rs 2 per equity share along with its Q1 results earlier this month. The historical context around the dividend history of wipro provides a useful frame for how payouts have interacted with price behavior in prior ex-date cycles–though each week can diverge on macro or company-specific news. The current calendar for July 27–31 makes one thing clear: eligibility hinges on holding shares in your demat account on the record date, and the market typically absorbs such corporate actions with price adjustments that reflect the payout magnitude and broader market dynamics.
As you scan the list of actions for the week, remember that record dates are not price guarantees. A stock can still move on momentum, earnings expectations, and sectoral flows even as investors seek to lock in dividends. The practical implication for you as a retail investor is straightforward: identify the ex-date you care about, confirm your holding, and plan around the payout window so you don’t miss a potential entitlement. If you want a tailored, stock-by-stock risk and opportunity view through the week, Swastika’s Sarthi AI stock assistant can help you monitor live updates and adjust your strategy in real time.
Dividend History Of Wipro And Its Impact On The Stock Movement
The dividend history of wipro provides a useful reference for how payout events can influence investor behavior. This week, the stock is part of a broad schedule that includes an interim dividend of Rs 2 per equity share. While the date-specific price action can vary, such distributions historically contribute to a predictable income overlay for long-term holders and a marginal near-term price impact for traders who are positioning around the ex-date. Understanding the dividend history of wipro helps set expectations about yield realization, tax treatment, and the potential for temporary price pressure around the record date. As with all corporate actions, the actual outcome will depend on market supply-demand dynamics, the quantum of the payout, and investor sentiment in the days surrounding the ex-date window.
In practice, retail investors should confirm the exact record date and ensure the shares are in the demat on that date. Even though a dividend history of wipro can illuminate past behavior, it does not guarantee future outcomes. The current week’s actions–along with other concurrent payouts–can interact with sector rotations, global cues, and domestic liquidity conditions, shaping short-term price moves in ways that aren’t solely defined by the dividend amount. The core takeaway remains: put your holdings in order for the record date, and stack your analysis with live signals that can guide entry/exit timing as events unfold.
Ultratech Cement Dividend: Rs 240 Per Share On Ex-Date Week
Among this week’s payout landscape, the ultratech cement dividend stands out for its size. On Thursday, July 30, the company has finalized a final dividend of Rs 240 per share, the top per-share payout in this ex-date sequence. For a retail investor, such a large payout can influence the perceived value of the stock around the ex-date, especially in a sector where capital-intensive players are commonly watched for value inflection around corporate actions. While the cash outflow from the company’s perspective is straightforward, price discovery around the ex-date often reflects a balance between the dividend pull and the stock’s long-term growth narrative. Investors should consider how such a payout interacts with their overall risk profile and portfolio liquidity during the week.
In examining the broader payout pattern for Ultratech Cement, it’s important to note that the ex-date window includes other firms with smaller per-share payouts. The presence of a Rs 240 dividend highlights the scale of some corporate actions in Indian markets and can serve as a reminder to check eligibility carefully, especially if you hold related sector stocks or have cross-holdings. Always ensure your demat records align with the date that matters for the payout you’re chasing, because even a strong payout on one name doesn’t automatically translate into a universal market move across the week.
Britannia Dividend And Other High Payouts On The Week's Final Ex-Date
As Friday closes the ex-date window, Britannia Industries features a robust dividend line: a final dividend of Rs 90.5 per share, making it the highest on Friday’s list. The Britannia dividend represents an attractive yield in a brand-driven consumer staple space, a category that often attracts steady demand and relatively predictable cash flows. While the extreme payout on Friday by Britannia stands out, other names on the Friday list–such as Eicher Motors with Rs 82 per share and AstraZeneca Pharma India with Rs 36–contribute to a diversified spectrum of payouts across sectors. From a practical standpoint, investors should align their payout expectations with their risk tolerance and portfolio diversification goals, especially when multiple high-payout stocks converge in a single week’s ex-date window.
The record-date-driven moves across the week should not obscure the basic eligibility rule: you must hold the stock on the record date to qualify for the dividend, final or interim payouts. This is a fundamental tenet of corporate actions and a straightforward way to ensure you capture entitlements when the ex-date culminates in a wave of distributions. If you’re managing a basket of holdings with various record dates, a calendar-based approach can help avoid accidental exclusion from payouts that could add to your income stream or reinvestment opportunities.
DLF Dividend And Other Key Corporate Actions In The July 27–31 Window
DLF appears in this week’s list with a final dividend on its action list; the DLF dividend reflects the broader appetite for value creation through shareholder returns during this period. While the exact per-share amount for DLF’s dividend is modest relative to UltraTech Cement’s standout payout, it still contributes to the week’s overall cash-return profile and provides a useful data point for investors tracking sector and stock-specific payout momentum. Across the same window, Persistent Systems also figures prominently with a final dividend of Rs 18 per share, marking a notable highlight for Monday’s ex-date actions. The presence of multiple high-payouts across days underlines the importance of timing and record-date discipline for investors who aim to maximize yield without compromising portfolio balance.
Persistent Systems Dividend: Rs 18 Per Share Highlight Of Monday Ex-Date
On Monday, a standout among the ex-record date stocks was Persistent Systems, which declared a final dividend of Rs 18 per share–an amount that marked Monday’s highest payout among the ex-date group. This payout underscores how software and tech-driven software services players still use dividends to return capital to shareholders, even as growth narratives and margins evolve. For investors, such a payout can contribute to a stock’s total return profile, particularly for those who track yield alongside growth potential. In the context of the week’s broader actions, Persistent Systems’ Rs 18 per share is a reminder that not all high payouts come from commodity or infrastructure heavyweights; software and tech manufacturing can also feature meaningful distributions during ex-date periods.
As you map the week’s payouts, consider how the Monday-highest payout interacts with the remaining days’ actions, and how your own portfolio’s sector allocation might influence the marginal benefit of including or excluding such names. While the per-share amount draws attention, the real decision for most investors lies in whether to hold through the record date and how to balance timing with the rest of the portfolio’s risk and liquidity requirements. For more granular analysis, the Sarthi AI stock assistant can help you gauge the interplay between payout size, stock volatility, and your personal investment goals.
Power Finance Corporation Dividend History And Its Implications
The Power Finance Corporation’s dividend history–specifically, a per-share payout of Rs 3–fits into the week’s mosaic of actions where both large and smaller corporates contribute to the collective ex-date narrative. While PFC’s Rs 3 per share may not command headlines like UltraTech Cement’s Rs 240, it remains an important anchor for investors focused on steady credit and infrastructure finance exposure. Such payouts, when viewed in aggregate, can tint the week’s risk-reward calculus, especially for traders and yield-focused investors who balance income with credit-cycle exposure. As with all dividends in this window, eligibility hinges on holding the shares on the record date; the payout itself becomes part of the total return picture once received and reinvested or spent according to your strategy.
Week-At-A-Glance: Ex-Date Payouts By Date
The most practical way to digest the week’s actions is through a quick, date-by-date snapshot. The following table captures the notable per-share payouts and the stocks most commonly cited in the week’s ex-date window. It’s a concise reference you can use to align your calendar with the payout schedule and to help you ensure you’re properly positioned before the record dates.
| Date (Record Date Window) | Highest Payout (Rs Per Share) | Stock With Highest Payout |
|---|---|---|
| July 27 (Mon) | Rs 18 | Persistent Systems |
| July 28 (Tue) | Rs 11 | Solar Industries |
| July 29 (Wed) | Rs 18 | Siemens |
| July 30 (Thu) | Rs 240 | UltraTech Cement |
| July 31 (Fri) | Rs 90.5 | Britannia Industries |
The table above highlights the arithmetic of the ex-date window: a mix of high and modest payouts across varied sectors, with UltraTech Cement and Britannia at the extremes on the high end. Remember that these numbers are per-share payouts and, depending on your holdings, can translate into meaningful cash accruals as the week unfolds. The schedule remains dynamic; more names could be added, and existing actions could adjust based on corporate approvals and regulatory steps. For investors who want to stay ahead, a daily check against the official corporate action calendar is prudent, along with a simple risk-check on any mid-week price moves that could accompany the ex-date announcements.
Practical Guide: How To Qualify For These Corporate Actions And Protect Your Gains
Qualifying for dividends and bonuses hinges on a fundamental principle: you must own the stock on the record date. In practice, that means confirming your holding and ensuring it remains in your demat account through the record date, even if you plan to sell later in the week. If you’re chasing a specific payout, such as UltraTech Cement’s Rs 240 per share or Britannia’s Rs 90.5, you’ll want to maintain the position until the record date and be prepared for small-to-moderate price swings around that date. Market participants often adjust positions in anticipation of ex-date payouts, which can create a short window of heightened volatility–even for otherwise stable names.
Frequently Asked Questions
What stocks turn ex-date in the July 27–31 window?
More than 110 companies fixed record dates for dividends and bonuses; notable names include Wipro, UltraTech Cement, Britannia, DLF, Persistent Systems and Godrej Properties, among others; the week spans from Monday to Friday.
What is the highest dividend payout among the stocks this week?
UltraTech Cement offers Rs 240 per share on Thursday, the top per-share payout of the week; Britannia Industries pays Rs 90.5 per share on Friday; On Wednesday, Siemens pays Rs 18 per share.
What does a record date mean for dividends and bonuses?
The record date is the cut-off date; you must own the shares in your demat account on the record date to receive the dividend or bonus; selling before or after the record date does not affect eligibility once the date passes.
Which stock fixed the highest payout on Monday, July 27?
Persistent Systems had the highest payout among Monday ex-record date stocks, with Rs 18 per share.
Where can I see a consolidated view of the week's payouts?
A consolidated table summarizes the payouts by date: July 27 (Persistent Systems Rs 18), July 28 (Solar Industries Rs 11), July 29 (Siemens Rs 18), July 30 (UltraTech Cement Rs 240), July 31 (Britannia Rs 90.5). More names may be added as the schedule evolves.
Conclusion
The ex-date week for dividends and bonuses is a practical reminder that corporate actions can subtly tilt the return profile of a retail investor’s portfolio. With more than 110 stocks fixing record dates and a top payout of Rs 240 per share from UltraTech Cement on Thursday, the window offers both opportunity and risk. The other end of the spectrum–like Britannia’s Rs 90.5 per share
Open your trading and demat account here
Reference :
1 : Economictimes

Idfc First Bank Stock Price Outlook After Q1 Profit Surge: NII Growth, NIM Expansion And Loan Momentum
Key Takeaways
- Q1 profit hits ₹1,075 crore–the bank's highest-ever June-quarter figure.
- NII rises 21% YoY to ₹5,972 crore, driving the top-line momentum.
- NIM expands to 5.96% and ROA climbs to 1.06%, signaling improving profitability.
- RAM book and loans grow robustly: ₹3.05 lakh crore and ₹2.41 lakh crore, with provisioning at ₹515 crore.
For investors tracking idfc first bank stock price, the June quarter delivered a sharp signal: profits rose to ₹1,075 crore–the highest quarterly figure in the bank's history for a June quarter–driven by a robust rise in net interest income and improved margins. As of June 30, 2026, the bank also reported a YoY profit improvement from ₹463 crore in the prior year, underscoring a clear trajectory in profitability. The quarter's numbers reflect a broad-based momentum across lending segments, with a 21% YoY rise in NII to ₹5,972 crore. Net interest income was supported by a combination of loan growth and a favorable funding mix, contributing to the highest ever quarterly profit for IDFC First Bank in this period. The margin expansion to 5.96% from 5.71% a year ago–an increase of 25 basis points–underlines an improving earning profile as the bank's asset quality stabilizes.
The bank's management described the momentum as broad-based, with strong business momentum and a gradually improving risk posture. MD & CEO V Vaidyanathan noted that provisions as a percentage of loans are coming down and that investments in building the bank are starting to pay off, corroborating the narrative of an expanding margin profile and healthier return metrics. All figures referenced are as of June 30, 2026, providing a clean snapshot of the quarter’s performance and the quality of the earnings runway ahead.
Idfc First Bank Stock Price: Q1 Profit Surges To ₹1,075 Crore
The June quarter’s performance is led by NII of ₹5,972 crore, a YoY rise of 21% from ₹4,933 crore in the prior year. This uplift in net interest income supported a quarterly profit of ₹1,075 crore–the bank’s highest-ever for a June quarter. The NIM stood at 5.96%, up from 5.71% a year earlier, marking a 25 basis point expansion. Return on assets (ROA) also improved to 1.06% versus 0.54% in Q1FY26, reflecting a stronger efficiency and asset productivity profile within the bank’s operating framework.
Key Growth Drivers Behind The NII Jump
Incremental loan growth drivers were evident across mortgage, vehicle, corporate and consumer lending. Loans and advances rose to ₹3.05 lakh crore as of June 30, 2026, from ₹2.53 lakh crore a year earlier–a robust 20.6% YoY growth. This loan expansion underpins the NII expansion and reinforces the bank’s diversified loan mix as a source of durable earnings. The RAM book, representing Retail, Agri and MSME lending, grew to ₹2.41 lakh crore, up 18.2% YoY from ₹2.04 lakh crore. This growth underscores the bank’s structural emphasis on granular, retail-led growth, which historically carries a favorable risk profile and potential for cross-sell across segments.
RAM Book Momentum And The Path To Retail, Agri And MSME Growth
The 18.2% YoY expansion in the RAM book demonstrates that the bank is successfully leveraging its Retail, Agriculture and MSME franchises to drive asset growth while maintaining an improving credit quality backdrop. A stronger RAM base complements the mortgage and vehicle lending momentum, helping the bank deliver a more stable earnings cadence. This mix also positions IDFC First Bank to benefit from the ongoing consumption-led growth in the Indian economy, while the diversified RAM segment mitigates concentration risk across a single segment.
Risk Management: Provisioning Buffer And The Rest Of The Year
The CGFMU claim of ₹515 crore is noted as part of a prudent provisioning approach, designed to cushion the impact of potential volatility from monsoon outcomes or fuel price movements later in the year. This provisioning stance is prudent and aligned with best practices for macro-uncertainty, while management indicated that the provisioning as a percentage of loans is coming down–a positive signal for the balance-sheet quality and the earnings trajectory. Taken together, these buffers provide a cushion while the bank sustains its growth and margins over the medium term.
Valuation, The Stock Price Narrative, And How Retail Investors Should Think
From a price and value standpoint, the idfc first bank stock price narrative could remain constructive if the bank can sustain NII momentum and NIM expansion. A durable NII lift, aided by loan growth and improved asset-quality metrics, tends to support earnings visibility and potential re-rating relative to peers with similar risk profiles. However, investors should consider macro risks–like monsoon strength and energy price volatility–within their valuation framework. The prudent approach is to monitor quarterly NII, NIM and RAM book growth, and to test these against macro scenarios to assess upside and downside price sensitivity.
For deeper stock-specific insights, try Swastika's Sarthi AI stock assistant.
Related Reads
Frequently Asked Questions
What was IDFC First Bank's Q1 profit for the June quarter 2026?
IDFC First Bank reported a profit of ₹1,075 crore for the June quarter, the highest-ever quarterly figure.
What was IDFC First Bank's Net Interest Income (NII) in Q1 2026?
IDFC First Bank's NII was ₹5,972 crore in the June quarter, up 21% year-over-year from ₹4,933 crore.
What is IDFC First Bank's NIM in the June quarter?
The bank's NIM stood at 5.96% in the June quarter, up from 5.71% a year earlier.
What is the RAM book size and growth?
RAM book size is ₹2.41 lakh crore, up 18.2% year-on-year from ₹2.04 lakh crore.
What is the total loans and advances growth YoY?
Loans and advances stood at ₹3.05 lakh crore as of June 30, 2026, up about 20.6% YoY.
Conclusion
Retail investors should take away that IDFC First Bank's June quarter performance signals a shift toward more sustainable profitability, supported by NII strength, margin expansion and robust loan growth. The RAM book growth and prudent provisioning buffer add balance to the earnings outlook in a potentially volatile year.
Next steps: adopt a framework to compare quarterly NII and NIM alongside macro indicators like monsoon performance and energy price movements. Use Swastika's Sarthi AI stock assistant to model scenarios and set price targets with a disciplined risk buffer.
Open your trading and demat account here
Reference :
1 : Economictimes
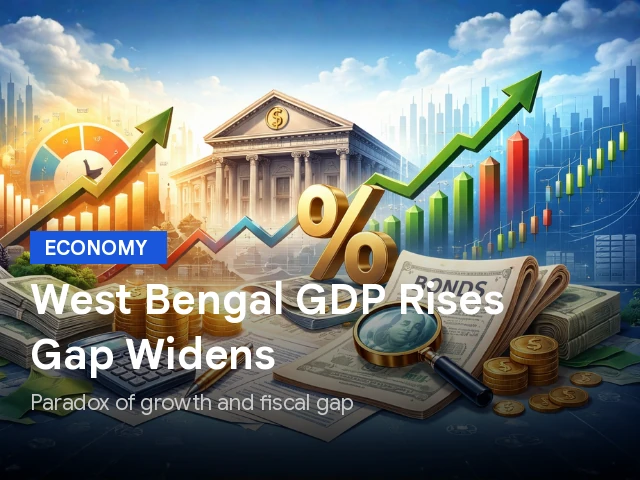
West Bengal GDP Growth: A CAG Audit Deep Dive Into 2015-25 Trends And Fiscal Dynamics
Key Takeaways
- west bengal gdp growth rose from Rs 7.97 lakh crore in 2015-16 to Rs 18.15 lakh crore in 2024-25, a 9.57% CAGR.
- In 2024-25, west bengal gdp growth reached 9.91% while revenue buoyancy stayed below 1, with 52% of receipts from the Centre.
- West Bengal posted a revenue deficit of Rs 39,727 crore (2.19% of GSDP) and a fiscal deficit of Rs 61,924 crore (3.41%).
- Capital expenditure fell 25% to Rs 21,622 crore (1.19% of GSDP); budgetary savings totaled Rs 70,662.25 crore (18.09% of allocation).
The year 2024-25 reveals a paradox at the heart of West Bengal's economy: a state that has seen west bengal gdp growth accelerate on the back of a robust expansion in the GSDP, yet its fiscal metrics show a widening gap between receipts and expenditure. The GSDP rose from Rs 7.97 lakh crore in 2015-16 to Rs 18.15 lakh crore in 2024-25, a compound annual growth rate (CAGR) of 9.57% over the decade. In 2024-25 alone, the GSDP growth stood at 9.91%, signaling a broad-based expansion across sectors while revenue and fiscal deficits shadow the growth. This dynamic matters for investors because growth alone does not translate into healthy public finances. The State Finances Audit Report, prepared by the Comptroller and Auditor General, provides the data backbone for these conclusions.
West Bengal GDP Growth: A Decade Of Expansion And The Fiscal Trade-Offs
From 2015-16 to 2024-25, GSDP expanded from Rs 7.97 lakh crore to Rs 18.15 lakh crore, a 9.57% CAGR. The year 2024-25 alone delivered a GSDP growth of 9.91%, signaling a broad-based expansion across agriculture, industry, and services. Yet the fiscal picture reveals revenue deficits and rising borrowings that constrain the state's policy space for investment and social spending. The report notes that revenue receipts rose to Rs 2,13,700 crore in 2024-25, up 6.71% year over year, with transfers from the Centre accounting for 52% of total receipts, underscoring the central support underpinning the fiscal framework. Buoyancy remained below one, implying revenue growth did not keep pace with the rise in GSDP.
| Indicator | Value |
|---|---|
| GSDP (2015-16) | Rs 7.97 lakh crore |
| GSDP (2024-25) | Rs 18.15 lakh crore |
| GSDP CAGR (2015-16 to 2024-25) | 9.57% |
| GSDP Growth (2024-25) | 9.91% |
| Revenue Receipts (2024-25) | Rs 2,13,700 crore (+6.71% YoY) |
| Revenue Expenditure (2024-25) | Rs 2,53,427 crore (118.59% of receipts) |
| Centre Transfers (as share of receipts) | 52% |
| Revenue Deficit (2024-25) | Rs 39,727 crore (2.19% of GSDP) |
| Fiscal Deficit (2024-25) | Rs 61,924 crore (3.41% of GSDP) |
| FRBM Benchmark | 3.5% of GSDP |
| Outstanding Obligations (Mar 31, 2025) | 38.66% of GSDP |
| Capital Expenditure (2024-25) | Rs 21,622 crore ( 25% YoY) |
| CapEx as % of GSDP | 1.19% |
| Subsidy Expenditure (2024-25) | Rs 19,444 crore (+85.61% YoY) |
| Capital Expenditure 5-Year Trend | Rs 21,622 crore (2024-25); down 25% from prior year |
| Budgetary Savings | Rs 70,662.25 crore (18.09% of total allocation) |
| Budget Provision vs Actual | Spending Rs 3,19,975.79 crore vs Rs 3,90,638.04 crore provision |
| Excess Expenditure (2024-25) | Rs 13,486.92 crore under seven grants and one allocation |
| Unregularised Excess (2009-2024) | Rs 57,263.62 crore |
| Transfers to Personal Deposit Accounts (2024-25) | Rs 535.59 crore |
| Cess Not Moved To Public Account | Rs 1,809.66 crore |
The fiscal picture also highlights persistent revenue expenditure pressures. Net borrowings accounted for 41% of revenue expenditures, and subsidies climbed by 85.61% year over year. The subsidy dynamics point to deliberate policy choices, whether to support vulnerable groups or to sustain growth-oriented investments as the state narrows its deficit path. The State Finances Audit Report cautions that the absence of reserve funds has complicated the treatment of cess, with Rs 1,809.66 crore remaining in the cess pool not moved to the Public Account. These factors collectively shape how the budget is managed and where the room for new capital programs may come from.
Revenue And Expenditure Dynamics In 2024-25: The Clear Pattern
The fiscal year 2024-25 showcases a juxtaposition: high nominal and real growth on the GSDP line, but deficits that reflect recurring fiscal pressures. Revenue receipts rose by 6.71% to Rs 2,13,700 crore, yet revenue expenditures rose faster, with subsidies increasing and a substantial portion of the budget allocated to committed expenditures. The report notes that the outlays required funding social protection measures, subsidies, and subsidies in a setting where the capital formation rate–though essential for growth–slowed by 25% year over year. The combination of a 3.41% fiscal deficit relative to GSDP within the FRBM cap of 3.5% indicates a management of the deficit within statutory limits, but the absolute fiscal burden remains sizable.
Another notable pattern is the reliance on central transfers. With 52% of revenue receipts sourced from the Centre, the state's fiscal space is tightly tied to the Centre’s transfer mechanisms. In other words, growth in west bengal budget allocations is not entirely self-financed; the state depends significantly on external funding to sustain its outlays, including capital projects. As a retail investor, understanding this dynamic helps frame the risk-reward balance across public-backed investments and potential policy shifts that could accompany changes in federal support or debt sustainability concerns.
Capital Expenditures And Investment Trends: Reading The 2024-25 Data
Capital expenditure (CapEx) serves as a tangible signal of the state’s willingness to invest in infrastructure and productive capacity. In 2024-25, CapEx declined by 25% to Rs 21,622 crore, comprising just 1.19% of GSDP. This downward trend occurs against a backdrop of a growing economy and rising social needs. While a lower CapEx in a single year might reflect timing, project delays, or re-prioritization, the longer-term trajectory matters for investment climate and private-sector confidence. A sustained improvement in CapEx intensity would be a positive signal for investors seeking improved logistics, energy, and municipal infrastructure–areas that ultimately underpin business activity and consumer demand.
Subsidy expenditures rose sharply, up 85.61% YoY, signaling continued government efforts to cushion households and support key sectors. Subsidies, along with committed expenditures (which accounted for almost half of revenue expenditures over the previous five years and nearly 74% of revenue receipts in 2024-25), underscore the state’s active role in income and price stabilization. Net borrowings, which financed a portion of revenue expenditures, represented 41% of revenue outlays, illustrating a debt-financed dimension to the operating budget that has implications for debt sustainability and future fiscal space.
Budget Management And Irregular Expenditure: What The Numbers Signify
The State Finances Audit Report highlights efficiency gains in some areas of budget management, including a remarkable saving of Rs 70,662.25 crore, or 18.09% of total allocation, by spending Rs 3,19,975.79 crore against budget provisions of Rs 3,90,638.04 crore. In contrast, there was excess spending of Rs 13,486.92 crore in 2024-25 under seven grants and one allocation, suggesting legislative regularisation work is needed. Additionally, unregularised excess expenditure amounted to Rs 57,263.62 crore between 2009 and 2024, reflecting long-standing challenges in expenditure control and demand management. The transfer of Rs 535.59 crore from the Consolidated Fund to Personal Deposit Accounts (with a sizable share occurring in the last month of the fiscal year) raises governance questions around fund management and accountability. On a related note, cess collected during the year amounting to Rs 1,809.66 crore remained unallocated in the Public Account due to the absence of reserve funds, further illustrating the complexity of public finances. For investors, these indicators underscore the importance of transparent and predictable budgetary processes when assessing state-backed opportunities and credit risk.
Against this backdrop, the Bureau’s findings emphasize that while West Bengal’s economy demonstrates strong GSDP growth, the fiscal framework bears ongoing pressures from deficits, subsidies, and arrears in regularisation and reserve-fund creation. The 38.66% of GSDP outstanding obligations as of March 31, 2025, sits near the FRBM benchmark of 38%, highlighting a delicate balance between growth and debt management. The dependence on central transfers and the need for disciplined capital expenditure planning are critical themes for those tracking the state's investment climate and potential debt dynamics.
Outlook For 2025-26: What Investors Should Watch
As the state eyes the next fiscal year, several questions will shape the investment landscape. Will CapEx regain momentum and move higher than 1.19% of GSDP? Will the center’s transfer pattern sustain the revenue base or will there be adjustments that necessitate new revenue measures? How will subsidy dynamics evolve as the government targets social and developmental goals while maintaining macroeconomic stability? The State Finances Audit Report suggests that continuing governance reforms, prudent expenditure control, and transparent regularisation of excess spending will be critical to preserving fiscal space for growth-oriented investments. Retail investors should monitor trends in revenue receipts and the mix of subsidies and committed expenditures as cues for sectoral opportunities and potential credit risk shifts.
For a deeper, stock-level lens on how these macro fiscal dynamics might translate into market opportunities, consider using Swastika's Sarthi AI stock assistant, a tool designed to provide institutional-grade stock research for retail investors: Swastika's Sarthi AI stock assistant.
Frequently Asked Questions
What is the West Bengal GSDP growth from 2015-16 to 2024-25?
The GSDP grew at a compound annual growth rate (CAGR) of 9.57% from Rs 7.97 lakh crore in 2015-16 to Rs 18.15 lakh crore in 2024-25.
What was the GSDP growth rate in 2024-25?
The GSDP growth rate in 2024-25 was 9.91%.
What were the revenue deficit and fiscal deficit in 2024-25?
Revenue deficit: Rs 39,727 crore (2.19% of GSDP). Fiscal deficit: Rs 61,924 crore (3.41% of GSDP).
What portion of revenue receipts came from Centre transfers?
Centre transfers accounted for 52% of total revenue receipts.
What happened to capital expenditure in 2024-25?
Capital expenditure declined by 25% to Rs 21,622 crore, comprising 1.19% of GSDP.
Conclusion
In short, the west bengal budget and the west bengal fiscal deficit narratives are interlinked: growth creates opportunities, but sustainable policy choices determine how those opportunities translate into durable returns for investors. The next steps for the informed investor are to track changes in CapEx intensity, the pace of reforms in budgetary management, and the evolving role of central transfers in the state’s financing mix. This is the moment to test the resilience of the growth story against the backdrop of fiscal discipline–and to position portfolios accordingly with a clear view of risk and upside shaped by the data in the CAG’s State Finances Audit Report.
Big Budget


Popular Articles





.avif)
.avif)

.avif)



START YOUR INVESTMENT JOURNEY
Get personalized advice from our experts
- Dedicated RM Support
- Smooth and Fast Trading App
