


Infosys Share Price Trends And July 2026 Nifty F&O: A Retail Investor's Guide



Key Takeaways
- Nifty July 2026 futures closed at 24,345, a premium of 10.70 points over the cash close of 24,334.30.
- The Nifty 50 cash index jumped 261.55 points (1.09%) to 24,334.30, while India VIX advanced to 13.15.
- Infosys futures, reliance industries futures, and tcs futures led the top-traded stock futures in NSE F&O.
- The July 2026 F&O contracts expire on 28 July 2026; traders should watch expiry dynamics.
infosys share price momentum matters for retail investors because it anchors the tech-led segment of the market. Data from the NSE shows Nifty July 2026 futures closed at 24,345, a premium of 10.70 points over the cash close of 24,334.30. In the cash market, the Nifty 50 index jumped 261.55 points or 1.09% to 24,334.30, while the India VIX advanced 2.07% to 13.15. Infosys, Reliance Industries and Tata Consultancy Services (TCS) were the top-traded individual stock futures. The July 2026 F&O contracts will expire on 28 July 2026.
Infosys Share Price And Nifty July 2026 Futures Premium Analysis
The premium of 10.70 points on the Nifty July 2026 futures signal near-term optimism priced into the market even as expiry approaches. The presence of infosys futures, along with reliance industries futures and tcs futures, highlights liquidity concentration in the three heavyweight names that often drive the F&O tape. For retail traders, this environment suggests a pragmatic approach: monitor the futures curve, check risk budgets, and avoid over-leverage as expiry nears. If you want deeper stock-by-stock insights, explore Swastika's Sarthi AI stock assistant: Swastika's Sarthi AI stock assistant.
Market snapshot table (from NSE data) summarizes the move: the Nifty July 2026 futures sit at 24,345; the cash close at 24,334.30; the VIX at 13.15.
| Metric | Value | Notes |
|---|---|---|
| Nifty July 2026 futures | 24,345 | Premium: 10.70 over cash |
| Nifty Cash Close | 24,334.30 | Move: +261.55 |
| NSE India VIX | 13.15 | Up 2.07% |
| F&O Expiry | July 28, 2026 | Contract expiry date |
The stock-specific lens matters here. While the exact infosys stock price on the day isn't provided in this snapshot, the Infosys share price trajectory is often a proxy for how the IT space interprets macro signals. The top-traded contracts–infosys futures, reliance industries futures, and tcs futures–signal institutional preference for quality large caps as the expiry window looms. Retail players should check two angles: price action on the actual Infosys share price and the relative strength in the stock price of tcs to understand whether the leadership is broad-based or name-specific.
Nifty 50 Cash Index Movement And Market Signals For Retail Investors
The Nifty 50 cash index rose to 24,334.30, gaining 261.55 points, a 1.09% rise. The simultaneous uptick in VIX to 13.15 injects a dose of near-term volatility into the equation, which is a reminder to calibrate risk budgets and avoid panic exits. For a retail investor, that means aligning exposures to a structured plan–prefer core holdings, set stop losses, and avoid chasing momentum in a high volatility regime. The market's leadership in infosys futures, reliance industries futures, and tcs futures signals that the strength is concentrated among a few heavyweight names, not across the broad ensemble of stocks.
Contextually, watch the infosys stock price and the stock price of tcs as barometers of domestic tech momentum, while the reliance industries limited stock price (where available) can reflect energy-sector cues. A disciplined approach would be to build a focused watchlist that emphasizes durable earnings trajectories rather than overnight headlines, and to complement this with a measured F&O plan that respects expiry dynamics.
Top Traded Stock Futures In NSE F&AmpO And The Leaders Infosys Futures, Reliance Industries Futures, And TCS Futures
The NSE F&O segment highlighted infosys futures, reliance industries futures, and tcs futures as the most actively traded stock futures. This concentration underscores how traders position around tech leadership and diversified conglomerates, with liquidity flowing into a few marquee contracts. For retail participants, the takeaway is clear: use these anchors to calibrate risk and avoid broad speculative bets. Align your trades with a well-defined framework–entry, exit, and a cap on maximum loss per position.
From a stock-pair lens, the infosys stock price and the stock price of tcs can offer practical cross-checks: if both are moving in tandem with the index, you may be dealing with systemic risk; if one diverges, you might be encountering idiosyncratic factors. Similarly, the reliance industries futures and the corresponding stock price in reliance can help you gauge where energy-linked rotations are driving the market. The discipline of cross-referencing futures with cash prices helps prevent misreads in a high-volatility window.
Understanding India VIX And Its Implication On Retail Trades
The India VIX rose to 13.15, up 2.07% on the session. A rising VIX typically signals greater near-term volatility and can widen bid-ask spreads, supporting a more cautious trading posture for retail investors. In expiry-run landscapes like July 2026, VIX dynamics often accompany sharper price moves in front-line contracts such as infosys futures, reliance industries futures, and tcs futures. If you maintain a clear risk framework, you can leverage volatility–not fear–to structure better hedges and more precise entry-exit points.
In practical terms, observe how the infosys stock price moves in relation to the overall market and to the prices of tcs and reliance. This can reveal whether the volatility is systemic or idiosyncratic to a stock. And as always, use Sarthi to benchmark your stock thesis against institutional insights and research signals.
Expiry Dynamics And What To Watch Ahead Of July 28 Expiry
With the July 2026 F&O contracts expiring on 28 July 2026, expiry dynamics can introduce elevated volatility and liquidity shifts in the top-traded contracts. For retail traders, that means maintaining discipline: ensure you are not over-leveraged into expiry, align trades with your risk budget, and adjust stops as prices move. The presence of infosys futures, reliance industries futures, and tcs futures at the top of the activity list suggests that liquidity will likely gravitate toward these names during the expiry window, which can create crystallization opportunities if you know where to place your bets and how to protect them.
Frequently Asked Questions
What was the Nifty July 2026 futures premium over the cash market?
Nifty July 2026 futures closed at 24,345, a premium of 10.70 points over the cash close of 24,334.30.
Which stocks were the top-traded stock futures in the NSE F&O segment?
Infosys futures, reliance industries futures, and tcs futures were among the top-traded stock futures.
When do the July 2026 F&O contracts expire?
The July 2026 F&O contracts expire on 28 July 2026.
What was the Nifty 50 cash index movement?
The Nifty 50 index rose 261.55 points or 1.09% to 24,334.30.
What happened to the India VIX on that day?
The India VIX advanced 2.07% to 13.15.
Conclusion
The retail investor today faces a market where index moves, futures premiums, and sector leadership intersect with expiry dynamics. In this snapshot from July 2026, the Nifty 50 cash index advanced alongside a Nifty July 2026 futures premium, while the India VIX shows elevated near-term volatility. The leadership in top-traded stock futures–including infosys futures, reliance industries futures, and tcs futures–highlights where liquidity and conviction are concentrated. For an investor, the key takeaway is to keep risk discipline intact, watch the expiry window, and align your stock selections with durable growth narratives rather than chasing short-term moves.
Open your trading and demat account here
Reference :
Latest Articles
Infosys Share Price Trends And July 2026 Nifty F&O: A Retail Investor's Guide


Key Takeaways
- Nifty July 2026 futures closed at 24,345, a premium of 10.70 points over the cash close of 24,334.30.
- The Nifty 50 cash index jumped 261.55 points (1.09%) to 24,334.30, while India VIX advanced to 13.15.
- Infosys futures, reliance industries futures, and tcs futures led the top-traded stock futures in NSE F&O.
- The July 2026 F&O contracts expire on 28 July 2026; traders should watch expiry dynamics.
infosys share price momentum matters for retail investors because it anchors the tech-led segment of the market. Data from the NSE shows Nifty July 2026 futures closed at 24,345, a premium of 10.70 points over the cash close of 24,334.30. In the cash market, the Nifty 50 index jumped 261.55 points or 1.09% to 24,334.30, while the India VIX advanced 2.07% to 13.15. Infosys, Reliance Industries and Tata Consultancy Services (TCS) were the top-traded individual stock futures. The July 2026 F&O contracts will expire on 28 July 2026.
Infosys Share Price And Nifty July 2026 Futures Premium Analysis
The premium of 10.70 points on the Nifty July 2026 futures signal near-term optimism priced into the market even as expiry approaches. The presence of infosys futures, along with reliance industries futures and tcs futures, highlights liquidity concentration in the three heavyweight names that often drive the F&O tape. For retail traders, this environment suggests a pragmatic approach: monitor the futures curve, check risk budgets, and avoid over-leverage as expiry nears. If you want deeper stock-by-stock insights, explore Swastika's Sarthi AI stock assistant: Swastika's Sarthi AI stock assistant.
Market snapshot table (from NSE data) summarizes the move: the Nifty July 2026 futures sit at 24,345; the cash close at 24,334.30; the VIX at 13.15.
| Metric | Value | Notes |
|---|---|---|
| Nifty July 2026 futures | 24,345 | Premium: 10.70 over cash |
| Nifty Cash Close | 24,334.30 | Move: +261.55 |
| NSE India VIX | 13.15 | Up 2.07% |
| F&O Expiry | July 28, 2026 | Contract expiry date |
The stock-specific lens matters here. While the exact infosys stock price on the day isn't provided in this snapshot, the Infosys share price trajectory is often a proxy for how the IT space interprets macro signals. The top-traded contracts–infosys futures, reliance industries futures, and tcs futures–signal institutional preference for quality large caps as the expiry window looms. Retail players should check two angles: price action on the actual Infosys share price and the relative strength in the stock price of tcs to understand whether the leadership is broad-based or name-specific.
Nifty 50 Cash Index Movement And Market Signals For Retail Investors
The Nifty 50 cash index rose to 24,334.30, gaining 261.55 points, a 1.09% rise. The simultaneous uptick in VIX to 13.15 injects a dose of near-term volatility into the equation, which is a reminder to calibrate risk budgets and avoid panic exits. For a retail investor, that means aligning exposures to a structured plan–prefer core holdings, set stop losses, and avoid chasing momentum in a high volatility regime. The market's leadership in infosys futures, reliance industries futures, and tcs futures signals that the strength is concentrated among a few heavyweight names, not across the broad ensemble of stocks.
Contextually, watch the infosys stock price and the stock price of tcs as barometers of domestic tech momentum, while the reliance industries limited stock price (where available) can reflect energy-sector cues. A disciplined approach would be to build a focused watchlist that emphasizes durable earnings trajectories rather than overnight headlines, and to complement this with a measured F&O plan that respects expiry dynamics.
Top Traded Stock Futures In NSE F&AmpO And The Leaders Infosys Futures, Reliance Industries Futures, And TCS Futures
The NSE F&O segment highlighted infosys futures, reliance industries futures, and tcs futures as the most actively traded stock futures. This concentration underscores how traders position around tech leadership and diversified conglomerates, with liquidity flowing into a few marquee contracts. For retail participants, the takeaway is clear: use these anchors to calibrate risk and avoid broad speculative bets. Align your trades with a well-defined framework–entry, exit, and a cap on maximum loss per position.
From a stock-pair lens, the infosys stock price and the stock price of tcs can offer practical cross-checks: if both are moving in tandem with the index, you may be dealing with systemic risk; if one diverges, you might be encountering idiosyncratic factors. Similarly, the reliance industries futures and the corresponding stock price in reliance can help you gauge where energy-linked rotations are driving the market. The discipline of cross-referencing futures with cash prices helps prevent misreads in a high-volatility window.
Understanding India VIX And Its Implication On Retail Trades
The India VIX rose to 13.15, up 2.07% on the session. A rising VIX typically signals greater near-term volatility and can widen bid-ask spreads, supporting a more cautious trading posture for retail investors. In expiry-run landscapes like July 2026, VIX dynamics often accompany sharper price moves in front-line contracts such as infosys futures, reliance industries futures, and tcs futures. If you maintain a clear risk framework, you can leverage volatility–not fear–to structure better hedges and more precise entry-exit points.
In practical terms, observe how the infosys stock price moves in relation to the overall market and to the prices of tcs and reliance. This can reveal whether the volatility is systemic or idiosyncratic to a stock. And as always, use Sarthi to benchmark your stock thesis against institutional insights and research signals.
Expiry Dynamics And What To Watch Ahead Of July 28 Expiry
With the July 2026 F&O contracts expiring on 28 July 2026, expiry dynamics can introduce elevated volatility and liquidity shifts in the top-traded contracts. For retail traders, that means maintaining discipline: ensure you are not over-leveraged into expiry, align trades with your risk budget, and adjust stops as prices move. The presence of infosys futures, reliance industries futures, and tcs futures at the top of the activity list suggests that liquidity will likely gravitate toward these names during the expiry window, which can create crystallization opportunities if you know where to place your bets and how to protect them.
Frequently Asked Questions
What was the Nifty July 2026 futures premium over the cash market?
Nifty July 2026 futures closed at 24,345, a premium of 10.70 points over the cash close of 24,334.30.
Which stocks were the top-traded stock futures in the NSE F&O segment?
Infosys futures, reliance industries futures, and tcs futures were among the top-traded stock futures.
When do the July 2026 F&O contracts expire?
The July 2026 F&O contracts expire on 28 July 2026.
What was the Nifty 50 cash index movement?
The Nifty 50 index rose 261.55 points or 1.09% to 24,334.30.
What happened to the India VIX on that day?
The India VIX advanced 2.07% to 13.15.
Conclusion
The retail investor today faces a market where index moves, futures premiums, and sector leadership intersect with expiry dynamics. In this snapshot from July 2026, the Nifty 50 cash index advanced alongside a Nifty July 2026 futures premium, while the India VIX shows elevated near-term volatility. The leadership in top-traded stock futures–including infosys futures, reliance industries futures, and tcs futures–highlights where liquidity and conviction are concentrated. For an investor, the key takeaway is to keep risk discipline intact, watch the expiry window, and align your stock selections with durable growth narratives rather than chasing short-term moves.
Open your trading and demat account here
Reference :
Reliance Industries Share Price Outlook: Q1 EBITDA Momentum, Jio Growth, And Promoter Moves
Key Takeaways
- Brokerages expect consolidated EBITDA to grow 4–10% YoY in Q1.
- O2C EBITDA up 12.1% YoY; Retail EBITDA up 5.6% YoY, with revenue up about 12% YoY.
- Promoters raised stake to 50.48% in the June quarter via Rs 8,500–9,000 crore purchases.
- RIL stock trades around Rs 1,323.70, about 20% below its 52 week high of Rs 1,611.20.
Is the reliance industries share price ready to catch the next wave as Reliance Industries prepares to announce its Q1 FY27 numbers? The street expects consolidated EBITDA to rise 4–10% year‑on‑year, led by O2C, with Jio providing resilience against retail pressure.
O2C is expected to drive Q1 earnings, while the retail business may stay under pressure. The mix of segmental outlooks from brokerages paints a nuanced picture for the stock price reaction, but the direction appears supported by cross‑segment strength in O2C and Jio.
Here is a synthesis of the main calls and what they imply for the reliance industries share price, including the segment‑wise dynamics and the promoter/market actions that could shape sentiment in the near term.
Reliance Industries Share Price: Q1 EBITDA Growth And Key Drivers
The consensus range for consolidated EBITDA growth in Q1FY27 is 4–10% YoY. O2C is seen as the primary earnings driver, supported by strong SEZ refinery earnings and the absence of windfall tax; improved US ethane‑based petrochemicals and a softer rupee further aid margins.
Kotak Institutional Equities adds that consolidated EBITDA may grow 8.4% YoY and 5.4% QoQ in Q1FY27, with O2C EBITDA rising about 12.1% YoY. Retail EBITDA is expected to rise 5.6% YoY but fall 2.6% QoQ, with revenue growth around 12% YoY. The other side of the ledger includes upstream EBITDA from O&G that Nuvama estimates could fall 14% YoY, driven by a ~7% drop in KG‑D6 production, while Jefferies pegs upstream EBITDA down 21% YoY.
YES Securities notes retail revenue up 16% YoY to Rs 97,700 crore, but a 0.8% sequential decline. Jio ARPU growth and subscriber additions are expected to lift digital EBITDA by about 11% YoY. Motilal Oswal places standalone EBITDA at Rs 14,800 crore for the quarter, up 12% YoY.
In aggregate, brokerages sketch a picture where O2C and Jio drive the near‑term earnings trajectory, while upstream and retail exhibit bifurcated dynamics. This nuance matters for the reliance industries share price because the market often prices a composite of segmental signals rather than any single line item.
Reliance investors erased roughly Rs 3.53 lakh crore in wealth this year, a statistic that has amplified focus on whether Q1 can deliver on expectations. The stock price has moved, trading around Rs 1,323.70 on the NSE after having spent time near a 52‑week high of Rs 1,611.20 earlier in the year. Promoters hiked their stake by nearly 0.5 percentage points during the June quarter to 50.48%, supported by Rs 8,500–9,000 crore of purchases.
Srichakra Commercials LLP is the largest promoter stake at 10.93%, with Devarshi Commercials LLP, Karuna Commercial LLP, and Tattvam Enterprises LLP each holding about 8.06%. In the near term, oil and gas headwinds could weigh on the O&G EBITDA, underscoring the reliance on O2C and Jio for the earnings mix. Price context notes the live blog dates and timestamps as the market digests the Q1 preview, including updates around 04:22 PM and 06:52 PM IST on 17 Jul 2026.
Oil and gas drag aside, the broader narrative remains intact: a diversified powerhouse with dual engines in O2C and Jio that can help offset seasonal softness in retail margins. For investors seeking structured inputs beyond the public numbers, Swastika's Sarthi AI stock assistant offers an institutional‑grade lens on any stock or index: Swastika's Sarthi AI stock assistant.
Analyst Estimates For Q1FY27 EBITDA: Nomura, Kotak, Jefferies
Nomura projects consolidated EBITDA of Rs 44,900 crore for Q1FY27, up about 2% quarter‑on‑quarter. Kotak Institutional Equities presents a brighter 8.4% YoY growth and 5.4% QoQ, with O2C EBITDA rising 12.1% YoY and Retail EBITDA up 5.6% YoY (down 2.6% QoQ).
Nuvama provides a caution on O&G, with EBITDA down 14% YoY on a 7% drop in KG‑D6 production, while Jefferies expects upstream EBITDA to fall 21% YoY. YES Securities highlights Retail revenue at Rs 97,700 crore, up 16% YoY but down 0.8% sequentially. Motilal Oswal’s standalone EBITDA estimate stands at Rs 14,800 crore, up 12% YoY.
These discrete calls reflect a distribution of risk where O2C and Jio underpin the upside, while upstream and retail present pockets of pressure. The divergence among brokerages underscores the need for a holistic view that weighs segmental dynamics, currency tailwinds, and the pace of ARPU expansion across digital platforms.
Table: Analyst Estimates Snapshot
| Broker / Firm | Consolidated EBITDA (Q1FY27) | Key Takeaways |
|---|---|---|
| Nomura | Rs 44,900 crore | QoQ +2%; overall growth supported by O2C |
| Kotak Institutional Equities | 8.4% YoY, 5.4% QoQ | O2C +12.1% YoY; Retail +5.6% YoY; Retail QoQ -2.6% |
| Nuvama | -14% YoY (O&G) | KG‑D6 output down ~7% |
| Jefferies | -21% YoY (Upstream) | Upstream drag persists |
| YES Securities | Retail Rs 97,700 crore revenue | +16% YoY; -0.8% QoQ |
| Motilal Oswal | Rs 14,800 crore | Standalone EBITDA +12% YoY |
For readers who want deeper, granular notes, the combination of O2C strength and Jio momentum could be the primary unlock for the relief in the reliance industries share price, while downstream segments will require tighter margin management and cost controls to sustain earnings momentum.
Breakdown By Segment: O2C, Retail, O&AmpG, And Digital EBITDA
O2C EBITDA is expected to lead the pack with a 12.1% YoY rise, driven by SEZ refinery earnings and a favorable currency backdrop that mitigates some feedstock cost pressures. The absence of windfall taxes, along with improved US ethane‑based petrochemical margins, supports a resilient O2C trajectory even as rupee weakness persists. This segment’s robust performance can help cushion the overall EBITDA mix as the company navigates macro headwinds.
Retail EBITDA is forecast to be up 5.6% YoY but down 2.6% QoQ, with revenue growth around 12% YoY. This signals that the retail arm remains a source of steady revenue, but margin discipline is essential to sustain EBITDA in the near term. The outlook suggests that management might prioritize cash flow generation in retail to backfill investments across other segments.
Upstream EBITDA from O&G is under pressure, with Nuvama projecting a 14% YoY decline due to a 7% fall in KG‑D6 production. Jefferies mirrors a cautious stance, forecasting a 21% YoY drop in upstream EBITDA. Digital EBITDA is expected to rise about 11% YoY on higher ARPU and continued subscriber growth at Jio, illustrating the multi‑year transformation in Reliance’ s digital ecosystem.
Motilal Oswal’s inclusion of standalone EBITDA at Rs 14,800 crore (+12% YoY) emphasizes the stand‑alone depth of the business, which will likely be a foundation for the consolidated story in Q1FY27. Digital and telecom contributions remain critical levers for the group’s earnings resilience, offering a buffer against commodity cycles and gross margin volatility in the core businesses.
As you consider the segmental mix, note that the oil and gas drag could temper the margin expansion in upstream, while O2C and Jio offer a more stable cushion. The mix underscores the need to watch the macro factors–such as currency moves, oil price trajectories, and domestic consumption cycles–that can influence the reliance industries share price over the next few quarters.
Promoter activity in June–raising stake to 50.48% with purchases of Rs 8,500–9,000 crore–adds a layer of positive sentiment, suggesting alignment with the long‑term growth thesis across O2C, retail, and digital segments. The largest promoter stake remains Srichakra Commercials LLP at 10.93%, with Devarshi Commercials LLP, Karuna Commercial LLP, and Tattvam Enterprises LLP each at 8.06%, reinforcing the ownership base around a diversified portfolio of value drivers.
Price context notes remain relevant: the stock hovered around Rs 1,323.70 on the NSE, about 20% below its 52‑week high of Rs 1,611.20; this delta could attract value buyers if the Q1 FY27 narrative solidifies, particularly if O2C and Jio deliver on expectations while upstream setbacks are managed through hedges and capex discipline.
Promoter Holdings And Market Sentiment
Promoters raised their stake by nearly 0.5 percentage points during the June quarter to 50.48%, a move that analysts say reflects confidence in the multi‑segment growth story and could provide price support in a volatile market. The purchases were estimated to cost Rs 8,500–9,000 crore, underscoring the scale of this strategic re‑weighting. In the same breath, Srichakra Commercials LLP holds the largest promoter stake at 10.93%, while Devarshi Commercials LLP, Karuna Commercial LLP, and Tattvam Enterprises LLP each hold about 8.06%.
The market’s wealth destruction this year–approximately Rs 3.53 lakh crore–has sharpened focus on whether Q1 earnings can re‑ignite sentiment for the share price. Price commentary from the day’s live blog notes shows price context updates around the close of trading on 17 Jul 2026, highlighting the ongoing tug‑of‑war between value recognition and earnings risk. For long‑term investors, the promoter alignment could potentially improve confidence in the company’s capital allocation framework as it navigates the current cycle.
Oil and gas drag remains a risk, while O2C and digital monetization offer path to upside. The near‑term outlook hinges on O2C margin expansion, Jio’s ARPU trajectory, and the stabilization of upstream output to reduce the risk of a broader earnings miss. As always, a diversified approach that balances growth with risk management could be the prudent route for navigating the reliance industries share price over the next few quarters.
What It Means For The Reliance Industries Share Price: Risks And Opportunities
The Q1 outlook suggests that investors should focus on the O2C momentum and Jio’s ability to sustain ARPU growth as the primary drivers of the consolidated EBITDA trajectory. While upstream and retail present challenges, the overall earnings mix remains supported by a diversified platform with potential for cross‑segment synergies. If the O2C leverage remains strong and downstream margins stabilize, the reliance industries share price could re‑rate as earnings visibility improves and the market prices in the new growth trajectory.
Retail margins remain a watchpoint. A 12% YoY revenue growth is solid, but sustaining margin expansion will require tighter cost controls and a favorable macro environment. On the other hand, the Jio digitization strategy continues to bear fruit with an 11% YoY uplift in digital EBITDA, reinforcing the resilience of the company’s diversified business mix. The 50.48% promoter stake, combined with the Rs 8,500–9,000 crore investment, might also help underpin investor confidence during this period of earnings anticipation.
Related Reads
Frequently Asked Questions
What is the expected YoY range for consolidated EBITDA in Q1FY27 according to brokerages?
Consolidated EBITDA is expected to grow 4–10% YoY in Q1FY27.
Which segment is expected to drive Q1 earnings for Reliance Industries?
O2C EBITDA is expected to be the primary driver, supported by SEZ refinery earnings and favorable currency dynamics.
What is the promoter stake after the June quarter, and what was the approximate cost of the purchases?
Promoters raised their stake to 50.48% in the June quarter, with purchases estimated at Rs 8,500–9,000 crore.
What is the approximate current price of the stock and how does it compare to the 52‑week high?
The stock traded around Rs 1,323–1,324, about 20% below its 52‑week high of Rs 1,611.20.
What is the YES Securities view on retail revenue and its YoY growth?
YES Securities notes retail revenue up 16% YoY to Rs 97,700 crore, but down 0.8% sequentially.
Conclusion
Reliance Industries stands at a critical crossroads where Q1FY27 earnings can either reinforce a renewed stock‑price narrative or expose the weaknesses embedded in upstream and retail. The expected 4–10% YoY growth in consolidated EBITDA, driven by O2C along with Jio’s resilience, provides a constructive backdrop for the reliance industries share price. Yet, the near‑term risk remains from upstream volatility and margin pressures in Retail, which could cap the upside if macro factors deteriorate.
Open your trading and demat account here
Reference :
1 : Economictimes
Maruti Suzuki Share Price Outlook: QIP, Solar Milestones, And Key Movers On July 17
Key Takeaways
- Maruti Suzuki share price faces new catalysts as QIP, orders, and ex-dividends shape near-term moves.
- coal india limited stock price eyes a 200 MW solar milestone at Khavda after commissioning certificate.
- Nilkamal stock price and Ramkrishna Forgings stock move on bulk-deal activity and selling pressure.
- Kaynes Technology India enters F&O ban while several stocks go ex-dividend, signaling shifting liquidity.
What happens when a QIP, a solar milestone, and a regulatory dispute collide on a single trading day? For retail investors, the maruti suzuki share price tells you where sentiment is headed next. On July 17, a cluster of corporate actions, regulatory developments, and bulk-deal flows is shaping investor views across Indian equities. From PC Jeweller's plan to raise up to ₹1,000 crore via a Qualified Institutions Placement (QIP) to Coal India's 200 MW solar capacity commissioning at its 300 MW Khavda project in Gujarat, and Servotech Renewable Power System's 900 kW rooftop order spanning 12 locations in Uttar Pradesh, the backdrop is rich with implications for both individual names and the broader market.
In this guide, we connect the dots between corporate decisions, regulatory signals, and portfolio implications for a retail audience. The focus stocks–PC Jeweller, Coal India Limited, Servotech Renewable Power System, and Maruti Suzuki India–sit at the crossroads of capital raising, green-energy expansion, and legal/regulatory development. We also track how bulk-deal activity, ex-dividend dates, and F&O bans may influence liquidity and price action across the week.
Maruti Suzuki Share Price Outlook After Regulatory Order
The District Consumer Disputes Redressal Commission in Raipur directed Maruti Suzuki India to replace a customer’s vehicle with a new E20-compatible model. The company contends the vehicle was E20-compatible and capable of running on E20 fuel, as stated in the owner’s manual. The car in question was manufactured in January 2023 and sold in June 2024. Fuel from the vehicle reportedly showed signs of contamination, and certain relevant facts were not reflected in the Commission’s order. The maruti suzuki share price reaction to this regulatory action will depend on how the company demonstrates facts and how the court/commission interprets E20 compatibility and consumer remedies. For retail traders, this development underscores how regulatory findings can quickly influence perceived product compliance, risk, and brand sentiment–factors that often precede material moves in the stock’s price and options activity.
Investors should watch how management frames the regulatory narrative and whether any remediation measures or settlements emerge. In the immediate term, activity around the maruti suzuki share price may reflect hedging, risk re-pricing, and changes in long/short positioning as traders weigh the implications for future model launches and after-sales support linked to E20-compatible variants. For those seeking deeper stock-specific insights, Swastika's Sarthi AI stock assistant offers institutional-level research on any stock or index; you can explore it here: Swastika's Sarthi AI stock assistant.
Coal India Limited Stock Price And Solar Milestone In Gujarat
Coal India has received a commissioning certificate from the Gujarat Energy Development Agency for 200 MW of solar power capacity at its 300 MW solar project in Khavda, Gujarat. This milestone marks a meaningful expansion of the company’s renewable energy footprint and contributes to the state’s solar capacity targets. The coal india limited stock price reaction to this milestone will hinge on how investors view the alignment between a traditional coal company diversifying into renewables and the broader energy-transition narrative. While the project’s 200 MW contribution is material, market participants will also watch how the remaining 100 MW at the Khavda site, and related project timings, influence cash flow visibility and project risk premiums.
Servotech Stock Update: 900 KW Solar Rooftop Order Across Uttar Pradesh
Servotech Renewable Power System has secured an order for a 900 kW solar rooftop project covering 12 locations from the Rural Development Department of Uttar Pradesh. This order adds a meaningful expansion in rooftop solar deployments and underscores demand for distributed generation solutions in public-sector programs. The servotech stock narrative may benefit from the recurrent demand cycle for rooftop installations, potential project pipelines, and the company’s ability to execute multi-location deployments with grid interconnection requirements. As with the solar segment, execution risk, interconnection delays, and procurement timelines will influence near-term price dynamics and investor sentiment.
Bulk Deals And Their Implications For Laser Power And Infra, Nilkamal, Ramkrishna Forgings
Bulk-deal activity offers a snapshot of institutional sentiment and the selective reallocation of funds into or out of specific names. Notable exchanges include Nippon India Mutual Fund buying 16.95 lakh shares of Laser Power and Infra through two transactions worth ₹44.22 crore. Buoyant Opportunities Strategy and Buoyant Opportunities Strategy-III acquired 20 lakh shares, representing a 1.42% stake, for ₹53.8 crore. BofA Securities Europe SA purchased 9 lakh shares worth ₹23.63 crore, while Bank of India Mutual Fund bought 9.43 lakh shares for ₹24.83 crore. In Nilkamal, Abakkus Investment Managers acquired 2.8 lakh shares, or a 1.87% stake, for ₹37.39 crore. Conversely, Smallcap World Fund sold 12.89 lakh shares, equal to a 0.7% stake, in Ramkrishna Forgings for ₹74.01 crore. These moves reflect a selective tilt toward mid-cap and high-conviction names with visible earnings streams or growth catalysts, and they can influence liquidity and valuation multiples in the near term.
Corporate Actions And F&AmpO Ban: Ex-Dividend Stocks And Rights
Several stocks trade ex-dividend in this session, including HCL Technologies, Shree Cement, Kotak Mahindra Bank, Lupin, Bharat Heavy Electricals, Dabur India, MRF, Newgen Software Technologies, Pfizer, UPL, VA Tech Wabag and Idea. Indian Toners & Developers will trade ex-date for a stock split, while JB Chemicals & Pharmaceuticals trades ex-date for amalgamation. Minolta Finance has an ex-date for rights. Additionally, Kaynes Technology India has been placed under the F&O ban for the session. These corporate actions and regulatory developments can exert discrete pressure on volatility and sector rotation, creating short-term trading opportunities for nimble investors who align position sizing with event timing.
Frequently Asked Questions
What is PC Jeweller's QIP plan?
The board of PC Jeweller has approved a proposal to raise up to ₹1,000 crore through a Qualified Institutions Placement (QIP), to be completed in one or more tranches.
What solar milestone did Coal India achieve in Gujarat?
Coal India has received a commissioning certificate from the Gujarat Energy Development Agency for 200 MW of solar power capacity at its 300 MW Khavda solar project in Gujarat.
What order did Servotech Renewable Power System receive?
Servotech Renewable Power System has secured an order for a 900 kW solar rooftop project covering 12 locations from the Rural Development Department of Uttar Pradesh.
What is the Maruti Suzuki E20 issue about and what happened?
Maruti Suzuki India will challenge the July 14 order of the District Consumer Disputes Redressal Commission, Raipur, which directed replacement of a customer’s vehicle with a new E20-compatible model. The company says the vehicle was E20-compatible and capable of running on E20 fuel; the car was manufactured in January 2023 and sold in June 2024; the order alleged contamination and did not reflect certain facts.
Which stocks are trading ex-dividend and which are under F&O ban?
Ex-dividend stocks include HCL Technologies, Shree Cement, Kotak Mahindra Bank, Lupin, Bharat Heavy Electricals, Dabur India, MRF, Newgen Software Technologies, Pfizer, UPL, VA Tech Wabag, and Idea. Indian Toners & Developers has a stock split ex-date, JB Chemicals & Pharmaceuticals has an amalgamation ex-date, Minolta Finance has a rights ex-date, and Kaynes Technology India is under the F&O ban for the session.
Conclusion
The week’s constellation of events–QIPs, solar-capacity milestones, rooftop deployments, bulk-deal flows, and ex-dividend/F&O activity–creates a liquidity and sentiment framework that retail investors would do well to map against their own portfolios. The maruti suzuki share price, in particular, sits at the center of a narrative where regulatory clarity and product-compliance signals can translate into risk re-pricing and potential entry or exit points across auto-related equities and the broader market. Investors should track how management communications address E20 compatibility, how the Raipur order progresses, and how energy-transition headlines influence the pricing of both traditional and renewable-energy names. This is a period where stock-specific catalysts intersect with macro and regulatory dynamics, offering both opportunities and risks for patient, systematic investors.
Open your trading and demat account here
Reference :
1 : 5Paisa
Google A Stock Price: A Retail Investor's Deep Dive Into Alphabet Stock
Key Takeaways
- Understand google a stock price through fundamentals, catalysts, and risk.
- Learn the GOOG vs GOOGL distinction and what governance means for investors.
- Use a disciplined framework to evaluate Alphabet stock price movements from India.
- Explore Swastika's Sarthi AI stock assistant for deeper analysis.
In a market where the google a stock price whispers louder than earnings, retail investors need a framework to separate signal from noise. This guide decodes Alphabet's stock price movements, the two publicly traded classes, and practical steps for Indian investors to participate thoughtfully.
From GOOG to GOOGL and from Cloud to AI, Alphabet's price action is the sum of many moving parts. The article offers a disciplined approach to reading price action, evaluating catalysts, and limiting overreaction to headlines. We avoid sensational numbers and focus on durable investing insights that stand the test of time.
Google A Stock Price: What Drives The Trend For Alphabet Stock
Alphabet's stock price movement is a product of multiple intersecting forces: AI momentum, cloud growth, advertising cycles, regulatory expectations, and global macro signals. The google a stock price responds to quarterly earnings, revenue guidance, and the market's appetite for tech leadership. For Indian investors, understanding these drivers helps you align risk tolerance with time horizon. In this section, we unpack the main drivers behind Alphabet's price action and how to interpret them in relation to your own strategy.
First, AI momentum translates into product adoption and incremental revenue sources; second, Google Cloud's execution and competitive positioning shape long-run profitability; third, advertising market cycles influence top-line strength; fourth, buybacks and capital allocation provide support during volatility. The net result is a stock price that can be volatile in the short run but offers exposure to a durable growth story in the long run. When you read the google a stock price chart, look for trend direction, not just a single data point.
Alphabet Share Price And Alphabet Stock Price: Understanding The Two Class Structure
Alphabet stock price is affected by the company's dual-class structure. The alphabet share price is measured for both GOOG and GOOGL; GOOG (Class C) trades without voting rights, while GOOGL (Class A) carries one vote per share. There is Class B (not publicly traded) with many votes controlled by founders. The price differences between GOOG and GOOGL are typically small, reflecting market liquidity and arbitrage across the two classes. For Indian investors, understanding the governance implications helps in deciding which ticker fits your objectives; both deliver exposure to Alphabet's growth story.
From a pure price perspective, the Alphabet stock price (GOOGL and GOOG) will move in tandem with overall fundamentals; any premium or discount typically reflects liquidity, investor sentiment, and the relative demand for voting rights. Track the price separation over time to gauge whether the market is pricing governance differences into the valuations, or simply reacting to macro risk. The key is to avoid assuming a direct one-to-one mapping of one class to another; the two prices usually converge around major events, but the settlement and liquidity can produce short-lived mispricings.
How To Analyze The Stock Price With A Disciplined Framework
To analyze the stock price with discipline, adopt a four-step framework: horizon, drivers, valuation, and risk management. Step one: set your time horizon; a longer horizon reduces the impact of short-term volatility. Step two: identify the key growth drivers–AI, cloud, advertising, and collaboration with enterprise partners. Step three: assess valuation in context–compare price-to-earnings growth, revenue growth, and free cash flow quality rather than chasing a single multiple. Step four: calibrate risk through diversification and position sizing. Alphabet stock price responds to evolving technology trends and macro cycles, so align your research with a deliberate process. In practice, use both GOOG and GOOGL price movements to confirm signals and avoid overreacting to one-off events.
Practical metrics to monitor include revenue growth rate, operating margin, cloud contribution, AI product adoption, and capital allocation changes. While Alphabet tends to reinvest profits into R&D and acquisitions rather than pay dividends, strong free cash flow remains a key driver of value. Use moving averages such as the 50-day and 200-day lines to visualize trend direction, and be mindful of regime changes–bear markets require greater patience and smaller position sizing. For Indian investors, cross-border brokerage costs and currency considerations can influence the net returns, so factor those into your planning. To keep you focused, write down a thesis for Alphabet stock price and re-check it after quarterly results to determine whether to add, trim, or hold your position.
Macro Catalysts, Risks And The Indian Investor's Playbook For Alphabet Stock
Major catalysts that could lift Alphabet stock price include AI-driven product adoption, cloud market expansion, improved ad monetization, and meaningful buybacks or capital allocation signals. A robust AI strategy that translates to sustained revenue growth would support higher valuations over time. Conversely, risks include regulatory scrutiny, antitrust actions in key markets, and shifts in ad spend that could compress margins. Global macro conditions–interest rate trends, growth trajectories in digital advertising, and currency movements–also influence Alphabet stock price through risk premia and relative performance against peers. Building an India-focused playbook means combining global thesis with local tax, brokerage costs, and currency considerations to create a realistic expected return profile.
Develop a structured plan: define a risk budget, set entry points around strategic catalysts, and maintain discipline during volatility. A practical approach is to use a blended watchlist that tracks earnings cadence, AI product milestones, and cloud competition while avoiding overexposure to a single stock. Remember that Alphabet's growth catalysts are long-term; patience and regular review are essential. For this reason, many Indian investors prefer to allocate a portion of their equity to technology leaders with strong cash generation, balanced by diversification across sectors. If you’re ready to go deeper, Swastika's Sarthi AI stock assistant can help tailor insights to your portfolio stage: Swastika's Sarthi AI stock assistant.
Accessing Alphabet Stock From India: Practical Steps And Costs
Accessing Alphabet stock from India is feasible through global brokers that support US-listed equities. Indian investors can choose GOOG and GOOGL as the form of exposure; some platforms require ADRs or cross-border accounts. Understand the costs including brokerage, currency conversion, and settlement timelines; compare these with domestic options. For many Indian investors, building a process around dollar-cost averaging and a defined risk budget helps reduce the impact of currency swings and short-term price moves. Keep in mind tax implications and reporting requirements for cross-border investments, and work with a trusted financial advisor to ensure compliance and optimal structure.
Frequently Asked Questions
What is Alphabet stock and how is it traded?
Alphabet stock represents shares of Alphabet Inc., traded on US exchanges under GOOG and GOOGL tickers. Indian investors typically access Alphabet through global brokers or ADR listings.
What is GOOG vs GOOGL and why does it matter for investors?
GOOG (Class C) shares carry no voting rights, while GOOGL (Class A) shares provide one vote per share. The difference primarily affects governance influence for long-term holders, though price movements are often closely aligned.
How can Indian investors use Alphabet stock price data to inform decisions?
Investors should compare Alphabet stock price movements with fundamentals such as revenue growth, AI strategy, cloud growth, and advertising demand. Use a consistent horizon and avoid knee-jerk reactions to short-term moves.
What are the main catalysts and risks for Alphabet's stock price?
Catalysts include AI product adoption, cloud expansion, advertising monetization, share buybacks, and regulatory clarity. Risks include regulatory scrutiny, antitrust actions, macro weakness, and competition.
How can Swastika's Sarthi AI stock assistant help with Alphabet stock analysis?
Sarthi AI stock assistant provides institutional-level insights into stock and index analysis; it can help track price trends, catalysts, and risk indicators tailored for retail investors.
Conclusion
For the retail investor in India, Alphabet stock presents a blend of governance-driven exposure and long-term growth in AI, cloud, and digital advertising. The key is to anchor your view on durable drivers, manage risk with a disciplined process, and use governance structures to match your own preferences.
Open your trading and demat account here
Reference :
1 : Google
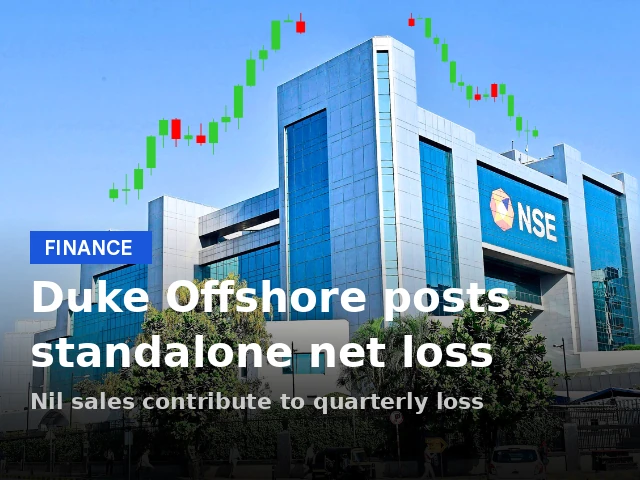
Duke Offshore Share Price Analysis: June 2026 Quarter Net Loss And Outlook
Key Takeaways
- duke offshore share price context shows June 2026 quarter posted standalone net loss of Rs 0.28 crore with zero sales.
- The prior quarter (June 2025) recorded a larger net loss of Rs 0.40 crore, with no sales.
- There were no sales reported in both quarters, so revenue generation remained nil.
- Investors should monitor the next quarter for any revenue or catalysts.
In markets that track micro-cap energy services, the duke offshore share price is more sensitive to catalysts than a single quarterly top line. The June 2026 quarter delivered a standalone net loss of Rs 0.28 crore with zero sales. For retail investors evaluating this name, the question isn't just about the loss–it is about what the absence of revenue implies for the stock's near-term moves and the longer-term prospects.
The quarter ended June 2026 marks a period where revenue did not flow in, reinforcing why the stock price's response hinges on qualitative signals–like orders, project commissions, or strategic pivoting–rather than current revenue. The June 2026 results show the loss narrowed from Rs 0.40 crore in June 2025 to Rs 0.28 crore, with nil sales in both periods. This narrower loss indicates some efficiency gains or cost containment, but it does not yet translate into profitability. The duke offshore share price narrative remains heavily influenced by outlook on revenue and execution rather than the current quarter's revenue; the data here reflects the company’s standalone results and was last updated on Jul 17, 2026.
Table: Quick Snapshot Of The June 2026 Quarter And The Prior Quarter
| Quarter Ended | Net Loss (Rs crore) | Sales |
|---|---|---|
| June 2026 | 0.28 | nil |
| June 2025 | 0.40 | nil |
The absence of sales in both quarters and the standalone nature of the results means the duke offshore share price narrative will hinge on future revenue catalysts rather than current earnings. Investors should note that these figures are from the company’s standalone results and reflect the situation as of the June 2026 quarter update; the last update was published on July 17, 2026. For readers seeking deeper, data-driven insights on stock dynamics, Swastika's Sarthi AI stock assistant can help model revenue scenarios and price pathways for the duke offshore share price.
Duke Offshore Share Price Context For June 2026 Quarter
The June 2026 quarter is characterized by a standalone net loss of Rs 0.28 crore and zero sales. Compared with the June 2025 quarter, the net loss narrowed by Rs 0.12 crore, continuing the pattern of limited top-line activity. The absence of sales in both periods underscores the need to evaluate units of cost and capital structure rather than revenue momentum when assessing the duke offshore share price. Investors should note that these figures are from the company’s standalone results and reflect the situation as of the June 2026 quarter update; the last update was published on July 17, 2026.
In practical terms, the duke offshore share price is likely to respond to what management communicates about future revenue prospects, project wins, and strategic steps to monetize assets. While the numbers indicate a narrower loss compared to the prior year, they do not provide a path to profitability, and the price action will hinge on near-term catalysts that signal revenue generation or improved cost structure. For additional clarity on potential revenue scenarios and their likely impact on price, you can consult Swastika's Sarthi AI stock assistant.
Impact Of Standalone Net Loss Of Rs 0.28 Crore On Duke Offshore Share Price
The standalone net loss of Rs 0.28 crore, coupled with nil sales, sets a baseline for evaluating near-term risk rather than value creation. From a portfolio perspective, the lack of revenue implies reliance on cost management and funding strategies to sustain operations. The duke offshore share price is sensitive to changes in liquidity or any announcement of an operational pivot that could unlock revenue potential. Investors should assess whether the company has a credible liquidity plan and a schedule for revenue realization in the coming quarters.
When comparing to the June 2025 quarter, the net loss has improved by Rs 0.12 crore, but the lack of top-line growth remains a major overhang on the valuation. In this context, the duke offshore share price will be influenced by how the company outlines its revenue trajectory–whether through new contracts, partnerships, or asset monetization–alongside its ability to manage expenses. For additional clarity on potential revenue scenarios and their likely impact on price, you can consult Swastika's Sarthi AI stock assistant.
Duke Offshore Revenue Outlook After No Sales In June 2026 Quarter
With zero sales in the June 2026 quarter, the focus shifts to catalysts that could generate revenue in subsequent quarters. Potential triggers include contract wins, project commencements, or strategic partnerships that provide revenue visibility. The duke offshore share price would likely respond to credible milestones that demonstrate progress toward revenue generation. Until such milestones are announced, investors should approach the stock with caution, recognizing the risk of capital being tied up in a micro-cap with no near-term revenue signal.
What Retail Investors Should Watch For In The Next Quarter
In the next quarter, the most important development would be the emergence of revenue–whether through new contracts, project commencements, or partnerships. Watch for updates on backlog, order inflows, and any guidance from management that reveals the path to revenue. The duke offshore share price will stay sensitive to such signals, especially if the company demonstrates a credible plan to monetize assets. In the meantime, maintain a disciplined risk framework, including position sizing and stop management, to navigate potential volatility in a stock that has yet to show top-line growth.
Investing Implications For Retail Investors Watching Duke Offshore Share Price
From an investment standpoint, the June 2026 quarter data signal a cautious stance rather than a buy decision based solely on current results. The standalone net loss of Rs 0.28 crore and nil sales mean there is no meaningful revenue progression to justify the current valuation. This environment favors investors who look for a defined plan for revenue generation, a credible path to profitability, and a reasonable runway to sustain operations. If you are considering an exposure to Duke Offshore, structure your position with a defined risk budget and a clear exit plan should upcoming quarters fail to show traction on revenue.
Frequently Asked Questions
What was Duke Offshore's standalone net loss for the June 2026 quarter?
Rs 0.28 crore.
Were there any sales in the June 2026 quarter for Duke Offshore?
No; sales were nil.
What was Duke Offshore's net loss in the June 2025 quarter?
Rs 0.40 crore.
Were there sales in the June 2025 quarter?
Nil.
When were the data last updated for this report?
Last Updated: Jul 17 2026 | 5:52 PM IST.
Conclusion
The June 2026 quarter presents a narrow lens on Duke Offshore: a standalone net loss of Rs 0.28 crore with no sales, improving from Rs 0.40 crore in the prior year’s quarter but still lacking revenue generation. For retail investors, the immediate takeaway is that price action will hinge on forward-looking signals–contracts, partnerships, and revenue milestones–rather than current earnings. The prudent approach is to await concrete revenue catalysts before forming a bullish thesis and to maintain risk controls that prioritise diversification and clear exit criteria.
Open your trading and demat account here
Reference :

OnePlus Share Price: Navigating North America And Europe Exit Rumors For Indian Investors
Key Takeaways
- OnePlus is reportedly trimming its North American and European markets, signaling a strategic pivot.
- Indian operations are claimed to continue normally, with India still considered an important market.
- The after-sales framework may shift to Oppo in certain markets, creating service-related uncertainty.
- Investors should monitor official statements, manage risk, and consider a diversified, long-term approach.
OnePlus Share Price Implications Of Global Market Restructuring
When a global smartphone brand hints at retreating from major markets, robust analysis becomes essential for retail investors. The current chatter around OnePlus indicates a possible restructuring that could see North America and Europe scaled back, with India once again held up as a key market. If you are watching oneplus share price in your watchlist or simply assessing risk, this isn’t a routine corporate reshuffle; it’s a signal about how the parent group’s strategy could influence profitability, branding, and the long-term investment case for any future listing or equity instrument tied to the ecosystem around OnePlus.
The supposed plan, attributed to Oppo's global business overhaul, suggests a shift away from launching new products in North America and Europe. This is not a formal exit in the immediate sense, but it implies resource reallocation, supply chain repositioning, and changes in regional after-sales support. For Indian investors, the central question isn’t solely about product launches; it’s about how the brand’s global footprint affects consumer demand, competitive positioning, and the financial runway of its parent group. The immediate implication for oneplus share price considerations, while OnePlus itself is not publicly traded on its own, is to monitor how such restructurings affect the market’s perception of the ecosystem and potential profitability.
OnePlus India Exit Rumors: Reality And Official Position
Many headlines allude to an exit from one or more markets; however, the current official stance from OnePlus is explicit: India’s operations continue normally and India remains a very important market for the brand. On the date of update, 16 July 2026 at 5:58 PM IST, OnePlus reiterated that there is no imminent plan to exit India. The day-to-day operations are continuing as before, and customers need not worry about service or updates in the near term. The phrase oneplus india exit may appear in rumors or media chatter, but the company has not disclosed any official plan to exit the Indian market. For investors, this means that any long-term thesis must hinge on India’s growing consumer base and the ecosystem the brand builds around its devices rather than on speculative exit scenarios.
OnePlus Europe Exit: Global Strategy Shifts And Investor Implications
Another part of the chatter concerns oneplus europe exit. The rumor suggests that opposed to continuing expansions, the brand’s global restructure might eventually withdraw from Europe as a separate market or adjust the depth of its product launches there. The primary claim is that Oppo’s changes would involve pulling back in North America and Europe, possibly shifting after-sales management to Oppo in those markets. If real, this would change the brand’s exposure to European consumer demand patterns, price sensitivity, and product mix. While India remains a priority, the investor’s frame of reference has to consider how European demand could affect the broader profitability of the Oppo ecosystem. At this stage there is no official confirmation, and the focus remains on the strategic implications rather than a confirmed move.
Impact On Investor Portfolios: Short-Term Volatility And Long-Term Fundamentals
Rumors of restructuring typically trigger short-term volatility in related stocks or in the broader ecosystem’s perception. Even if oneplus share price is not publicly traded, the ripple effects can be visible in the tech space as investors reposition around brand risk, supply chain shifts, and changes in service levels. For Indian retail investors, the key question is whether to stick to a long-term plan focused on fundamentals–brand strength, user base, and the economics of the ecosystem–versus trying to time the headlines. In the near term, the official stance that India is not exiting and that current users will continue to receive updates for some time provides a cushion, but the risk of narrative risk remains. The prudent approach is diversification, careful position sizing, and ensuring your exposure aligns with your risk tolerance. If you own tech exposures through adjacent devices or components, reevaluate concentration risk and reallocate gradually as more official clarity emerges.
What Retail Investors Should Do Now: A Practical Framework
Given the lack of official confirmation about regional exits and the potential for after-sales adjustments, investors should adopt a practical framework. First, track official statements and capex commentary from the parent group to gauge the pace and scope of any changes. Second, test the resilience of your portfolio to brand-level shocks by revisiting exposure to consumer electronics branding risk. Third, consider independent signals from Indian digital economy growth, smartphone demand, and replacement cycles to calibrate long-run potential of the ecosystem. Fourth, keep an eye on after-sales quality and service changes; if Oppo takes over, it could affect user experience, brand loyalty, and ultimately the value proposition. Fifth, use a research tool to validate any new opportunities that arise in the tech space–this is where Swastika's Sarthi AI stock assistant can help you screen stocks and indexes with an institutional-level lens. You can access it here: Swastika's Sarthi AI stock assistant.
Oppo After-Sales Strategy And Its Possible Role In Market Support
As reports suggest that Oppo may handle after-sales in some markets if there is a broader exit, this could have mixed implications. On one hand, a dedicated after-sales network could preserve support quality; on the other, it could introduce transitional risk as customers acclimate to a new service provider. In India, the current stance is that operations remain normal; thus, immediate service quality remains stable for the time being. For investors, the key question becomes: if Oppo takes over, will it meaningfully improve or degrade the user experience? The answer depends on execution and regional resource allocation. In any case, the strategic decision will shape consumer brand perception, which is a core driver of revenue growth and profitability in device ecosystems.
Frequently Asked Questions
What does the latest report say about OnePlus's global market strategy?
The report claims Oppo is restructuring its global business and OnePlus may stop launching new products in North America and Europe, with India operations reportedly continuing normally for now. There is no official confirmation of a full exit from any market.
Is OnePlus India exit confirmed?
No official exit is confirmed. OnePlus has stated that Indian operations are normal and India remains an important market.
Who would handle after-sales support if markets exit or shrink?
Some reports suggest Oppo could take over after-sales support in affected markets, but precise arrangements and timing remain unclear.
What should Indian retail investors do in light of these rumors?
Monitor official statements, diversify exposure to tech hardware and services, assess brand-risk in portfolios, and wait for clearer guidance before making large changes.
How might these rumors affect the OnePlus share price?
As OnePlus is not publicly traded on its own, there is no direct 'OnePlus share price.' Still, rumors can drive near-term volatility in related markets or the broader tech ecosystem as investors reassess risk and potential profitability of the parent group.
Conclusion
The retail investor’s takeaway is simple: treat rumors as signals about strategic direction but rely on official statements for decision-making. India’s market remains central to OnePlus’s long-run plans, and the company has asserted that operations there are normal and continuing. This is not a guarantee of no change, but it is a baseline; use it to calibrate your risk and design a portfolio that can withstand narrative-driven volatility in the near term.
Open your trading and demat account here
Reference :
1 : Aajtak
Big Budget


Popular Articles




.avif)
.avif)

.avif)



START YOUR INVESTMENT JOURNEY
Get personalized advice from our experts
- Dedicated RM Support
- Smooth and Fast Trading App
