


YouTube Copyright Policy: A Retail Investor's Guide To Content Rights And Compliance


Key Takeaways
- YouTube Copyright Policy governs what creators may publish and how content is monetized.
- Content ID and takedown notices can affect revenue streams for video-based businesses.
- Retail investors should monitor policy risk when evaluating stocks tied to media platforms.
- Swastika's Sarthi AI stock assistant helps investors assess policy-driven risk in stock research.
What if a single takedown could erase months of revenue for a content-driven business? In the Indian digital economy, the YouTube copyright policy shapes what creators can publish, how audiences access those videos, and ultimately how investors value media platforms. For retail investors, understanding the rules isn't optional–it's a prerequisite for evaluating exposure to content-driven revenue streams and platform risk. From licensing to takedown notices and Content ID claims, these rules influence everything from channel growth to potential dividends in stock prices tied to media and ad-supported tech companies.
As you navigate a world where online video is a core asset class, the policy’s implications extend beyond creators' calendars into the risk dashboard of investors. This article breaks down what the YouTube copyright policy entails, how copyright open access concepts interact with platform enforcement, and what it means for retail investors who analyze stocks exposed to digital content ecosystems. By the end, you’ll have a practical mental model and concrete steps to manage policy-driven risk in your portfolio. And if you ever want a data-driven second opinion on policy risk across stocks, Swastika's Sarthi AI stock assistant can help you compare exposures across holdings: Swastika's Sarthi AI stock assistant.
Understanding The YouTube Copyright Policy For Content Creators And Indian Investors
The YouTube copyright policy is built around protecting the rights of content owners while enabling a vibrant ecosystem of creators. At its core, the policy prohibits uploading content you do not own or license, unless you have explicit permission or a clear license that covers your use. For Indian creators and institutions that publish on YouTube, this means a rigorous approach to rights management, licensing negotiations, and documentation of permissions. YouTube relies on a blend of automated detection and user-flagging to identify potential infringements, with Content ID playing a central role in recognizing matches to licensed works or user-generated declarations of ownership.
When a potential infringement is detected, several outcomes are possible: a video can be blocked in one or more territories; it may trigger a revenue claim in favor of the rights holder; or the video can be removed entirely. In some cases, content may remain viewable but with limited monetization or with age restrictions. For creators who source third-party footage, music, or clips–especially in education or news channels–these rules demand careful licensing and licensing-tracking practices. The consequence for investors is that policy enforcement intensity can influence channel growth trajectories, advertising revenue profiles, and the overall risk premium assigned to media-tech stocks.


Copyright Open Access And Its Relationship With YouTube Content Rights
Copyright open access refers to content that can be freely accessed and reused under open licenses, such as Creative Commons (CC) licenses, or content that has permissions aligned with open-use terms. On YouTube, using CC-licensed assets or stock media that explicitly permits reuse can simplify compliance, provided you adhere to license terms. Open access content can accelerate education channels, explainer formats, and analysis videos by reducing licensing friction, but it also demands vigilance about license scope, attribution requirements, and potential policy overlays from rights holders who may place restrictions on monetization or distribution in certain regions.
For investors, carving out a policy-compliant content strategy across an ecosystem that includes user-generated content and licensed assets matters. If a company relies heavily on open-access content to drive engagement, the risk profile may diverge from a firm that compiles proprietary footage or licenses exclusive music catalogs. In practice, you should assess whether a portfolio company has established a clear rights-management framework, including license inventories, attribution controls, and third-party usage audits. Open access can improve cost efficiency, but it also introduces a distinct set of governance and compliance considerations that can influence cash flow and valuation thresholds during earnings seasons.
Implications For Stock Investors: Policy Risk In Media And Tech Names
Policy risk is not hypothetical for investors who track media platforms, education channels, or any business model anchored in user-generated content or licensed media. When the YouTube copyright policy is enforced more aggressively, creators may curb production, which can compress view counts and advertising revenue. In extreme scenarios, policy changes or heavy enforcement could trigger mass content removals–or at least a material reallocation of ad spend away from content that relies on third-party media rights. This creates a non-linear risk profile for stocks tied to ad revenue, licensing, and digital distribution.
From a stock-valuation perspective, investors should consider how a company’s monetization mix would react to shifts in policy enforcement. A business that depends heavily on original content with robust licensing protections might weather policy changes better than one relying primarily on compilations or user-generated content. In addition, the presence of robust compliance programs, clear rights inventories, and proactive risk management can become a source of competitive advantage that supports earnings resilience and downside protection during regulatory or enforcement cycles.
Practical Steps For Retail Investors To Monitor And Manage YouTube Policy Related Risks
First, map revenue exposure to content rights. If a company’s revenue depends significantly on user-generated content or third-party footage and music, assess how policy risk might compress monetization. Second, demand transparency on licensing and rights management. Look for disclosures about content licensing pipelines, licensing costs, and the effectiveness of Content ID or other rights enforcement mechanisms. Third, diversify content strategy risk across platforms. A business that can pivot to original content production, licensing-based models, or cross-platform distribution may be more resilient to policy changes on a single platform.
Frequently Asked Questions
What is the YouTube copyright policy?
YouTube's copyright policy prohibits uploading content you do not own or license, unless you have explicit permission or a valid license. YouTube uses automated tools like Content ID to identify copyrighted material and may remove videos, restrict views, or monetize content on behalf of rights holders.
How does Content ID work on YouTube?
Content ID compares uploaded videos against a library of licensed and claimed content. If a match is found, the rights holder may monetize the video, block it, or take other actions. Creators can dispute claims or pare down the infringing portions to stay compliant.
What is 'copyright open access' and how does it relate to YouTube?
Copyright open access refers to content available under open licenses that permit reuse, often with attribution. On YouTube, using open-licensed assets requires adherence to license terms and any attribution obligations; otherwise, policy enforcement may apply.
What steps can creators take to avoid copyright issues?
Create original content, obtain licenses for third-party media, use royalty-free or Creative Commons assets, maintain records of permissions, and leverage YouTube’s audio library to ensure compliance.
How can investors evaluate a stock's exposure to YouTube copyright policy?
Investors should examine revenue diversification, licensing commitments, and risk-management practices. Companies with strong rights-management, diversified platform exposure, and clear policy compliance are often better positioned to withstand policy shifts.
Conclusion
For Indian retail investors, understanding the YouTube copyright policy is not merely a content issue; it is a fundamental risk-management discipline that shapes how you assess media and tech stocks. The policy’s enforcement dynamics–how rights claims are triggered, how content is monetized, and how open-access assets fit into licensing strategies–directly affect cash flows, earnings quality, and investment outcomes in digital content ecosystems.
Open your trading and demat account here
Reference :
1 : Google
Latest Articles
YouTube Copyright Policy: A Retail Investor's Guide To Content Rights And Compliance


Key Takeaways
- YouTube Copyright Policy governs what creators may publish and how content is monetized.
- Content ID and takedown notices can affect revenue streams for video-based businesses.
- Retail investors should monitor policy risk when evaluating stocks tied to media platforms.
- Swastika's Sarthi AI stock assistant helps investors assess policy-driven risk in stock research.
What if a single takedown could erase months of revenue for a content-driven business? In the Indian digital economy, the YouTube copyright policy shapes what creators can publish, how audiences access those videos, and ultimately how investors value media platforms. For retail investors, understanding the rules isn't optional–it's a prerequisite for evaluating exposure to content-driven revenue streams and platform risk. From licensing to takedown notices and Content ID claims, these rules influence everything from channel growth to potential dividends in stock prices tied to media and ad-supported tech companies.
As you navigate a world where online video is a core asset class, the policy’s implications extend beyond creators' calendars into the risk dashboard of investors. This article breaks down what the YouTube copyright policy entails, how copyright open access concepts interact with platform enforcement, and what it means for retail investors who analyze stocks exposed to digital content ecosystems. By the end, you’ll have a practical mental model and concrete steps to manage policy-driven risk in your portfolio. And if you ever want a data-driven second opinion on policy risk across stocks, Swastika's Sarthi AI stock assistant can help you compare exposures across holdings: Swastika's Sarthi AI stock assistant.
Understanding The YouTube Copyright Policy For Content Creators And Indian Investors
The YouTube copyright policy is built around protecting the rights of content owners while enabling a vibrant ecosystem of creators. At its core, the policy prohibits uploading content you do not own or license, unless you have explicit permission or a clear license that covers your use. For Indian creators and institutions that publish on YouTube, this means a rigorous approach to rights management, licensing negotiations, and documentation of permissions. YouTube relies on a blend of automated detection and user-flagging to identify potential infringements, with Content ID playing a central role in recognizing matches to licensed works or user-generated declarations of ownership.
When a potential infringement is detected, several outcomes are possible: a video can be blocked in one or more territories; it may trigger a revenue claim in favor of the rights holder; or the video can be removed entirely. In some cases, content may remain viewable but with limited monetization or with age restrictions. For creators who source third-party footage, music, or clips–especially in education or news channels–these rules demand careful licensing and licensing-tracking practices. The consequence for investors is that policy enforcement intensity can influence channel growth trajectories, advertising revenue profiles, and the overall risk premium assigned to media-tech stocks.
Copyright Open Access And Its Relationship With YouTube Content Rights
Copyright open access refers to content that can be freely accessed and reused under open licenses, such as Creative Commons (CC) licenses, or content that has permissions aligned with open-use terms. On YouTube, using CC-licensed assets or stock media that explicitly permits reuse can simplify compliance, provided you adhere to license terms. Open access content can accelerate education channels, explainer formats, and analysis videos by reducing licensing friction, but it also demands vigilance about license scope, attribution requirements, and potential policy overlays from rights holders who may place restrictions on monetization or distribution in certain regions.
For investors, carving out a policy-compliant content strategy across an ecosystem that includes user-generated content and licensed assets matters. If a company relies heavily on open-access content to drive engagement, the risk profile may diverge from a firm that compiles proprietary footage or licenses exclusive music catalogs. In practice, you should assess whether a portfolio company has established a clear rights-management framework, including license inventories, attribution controls, and third-party usage audits. Open access can improve cost efficiency, but it also introduces a distinct set of governance and compliance considerations that can influence cash flow and valuation thresholds during earnings seasons.
Implications For Stock Investors: Policy Risk In Media And Tech Names
Policy risk is not hypothetical for investors who track media platforms, education channels, or any business model anchored in user-generated content or licensed media. When the YouTube copyright policy is enforced more aggressively, creators may curb production, which can compress view counts and advertising revenue. In extreme scenarios, policy changes or heavy enforcement could trigger mass content removals–or at least a material reallocation of ad spend away from content that relies on third-party media rights. This creates a non-linear risk profile for stocks tied to ad revenue, licensing, and digital distribution.
From a stock-valuation perspective, investors should consider how a company’s monetization mix would react to shifts in policy enforcement. A business that depends heavily on original content with robust licensing protections might weather policy changes better than one relying primarily on compilations or user-generated content. In addition, the presence of robust compliance programs, clear rights inventories, and proactive risk management can become a source of competitive advantage that supports earnings resilience and downside protection during regulatory or enforcement cycles.
Practical Steps For Retail Investors To Monitor And Manage YouTube Policy Related Risks
First, map revenue exposure to content rights. If a company’s revenue depends significantly on user-generated content or third-party footage and music, assess how policy risk might compress monetization. Second, demand transparency on licensing and rights management. Look for disclosures about content licensing pipelines, licensing costs, and the effectiveness of Content ID or other rights enforcement mechanisms. Third, diversify content strategy risk across platforms. A business that can pivot to original content production, licensing-based models, or cross-platform distribution may be more resilient to policy changes on a single platform.
Frequently Asked Questions
What is the YouTube copyright policy?
YouTube's copyright policy prohibits uploading content you do not own or license, unless you have explicit permission or a valid license. YouTube uses automated tools like Content ID to identify copyrighted material and may remove videos, restrict views, or monetize content on behalf of rights holders.
How does Content ID work on YouTube?
Content ID compares uploaded videos against a library of licensed and claimed content. If a match is found, the rights holder may monetize the video, block it, or take other actions. Creators can dispute claims or pare down the infringing portions to stay compliant.
What is 'copyright open access' and how does it relate to YouTube?
Copyright open access refers to content available under open licenses that permit reuse, often with attribution. On YouTube, using open-licensed assets requires adherence to license terms and any attribution obligations; otherwise, policy enforcement may apply.
What steps can creators take to avoid copyright issues?
Create original content, obtain licenses for third-party media, use royalty-free or Creative Commons assets, maintain records of permissions, and leverage YouTube’s audio library to ensure compliance.
How can investors evaluate a stock's exposure to YouTube copyright policy?
Investors should examine revenue diversification, licensing commitments, and risk-management practices. Companies with strong rights-management, diversified platform exposure, and clear policy compliance are often better positioned to withstand policy shifts.
Conclusion
For Indian retail investors, understanding the YouTube copyright policy is not merely a content issue; it is a fundamental risk-management discipline that shapes how you assess media and tech stocks. The policy’s enforcement dynamics–how rights claims are triggered, how content is monetized, and how open-access assets fit into licensing strategies–directly affect cash flows, earnings quality, and investment outcomes in digital content ecosystems.
Open your trading and demat account here
Reference :
1 : Google

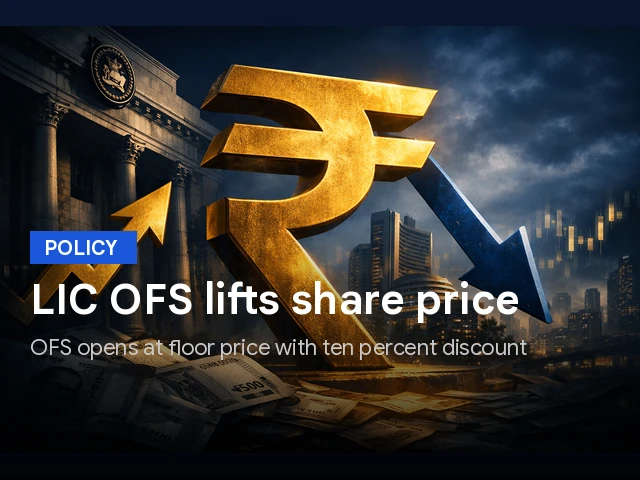
LIC Offer For Sale: How Retail Investors Can Navigate The OFS
Key Takeaways
- The LIC offer for sale includes a 2.5% base stake and a 4% green shoe option, totaling about Rs 31,410 crore.
- Retail investors get a Rs 10 per share discount, setting the entry price at Rs 372.
- LIC stock price moved sharply after the OFS news, with a 9% drop on the initial day for non-retail investors.
- Government ownership stands at 96.5% as of June 30, 2026, signaling a gradual increase in public float over time.
LIC Offer For Sale is not just another share sale; it is a test of market appetite for India's largest life insurer and a barometer for retail investors watching big government divestments. The base stake of 2.5% is complemented by a 4% green shoe option, while the floor price sits at Rs 382 per share–pulling the total OFS size to about Rs 31,410 crore. The discount to the previous close of Rs 391.3 is 3%, and retail participants can enter at Rs 372 after a Rs 10 per share discount. The OFS opened for non-retail investors on August 4 and was oversubscribed more than three times its offer size, paving the way for a dedicated retail window today.
For retail investors, the OFS structure matters. A minimum of 10% of the offer size is reserved for retail buyers, and the discount to the cut-off price can improve the entry price. The floor price of Rs 382 yields to 3% below the prior close, while the effective retail price comes to Rs 372 per share after the Rs 10 discount. This makes the LIC share price look attractive on a relative basis against listed private life insurers that trade at higher P/EV multiples. Market commentary suggests this OFS presents a compelling valuation given improving profitability and strong solvency, though persistence remains an area to watch. Investors will also watch the stock price of LIC and the LIC share price as markets digest the OFS.
LIC OFS Key Terms: Stake, Floor Price, And Discount
The OFS is structured to sell 2.5% of LIC's equity with a 4% green shoe option, bringing the total to an OFS size of nearly Rs 31,410 crore. The floor price is Rs 382 per share, implying a 3% discount relative to the prior close of Rs 391.3 on the NSE. Retail participants will get a Rs 10 per share discount on the cut-off price, resulting in an effective retail price of Rs 372 per share. A minimum of 10% of the offer size has been reserved for retail investors. The OFS opened for non-retail investors on August 4 and was oversubscribed more than 3 times its offer size; the window for retail investors opens today.
According to Ajit Mishra of Religare Broking, While persistence remains an area to watch, the combination of compelling valuation, improving profitability and market leadership makes the OFS an attractive long-term investment opportunity.
Reference :
1 : Economictimes
LIC used the OFS to accelerate divestment while maintaining a strong capital base. Notably, the government stake remains high, ensuring that the public float will gradually increase to comply with minimum public shareholding norms.
Retail Investors And The 10% Reservation: How The OFS Works
As noted, a minimum of 10% of the offer size is reserved for retail investors, with a Rs 10 per share discount on the cut-off price, yielding an effective entry price of Rs 372 per share for retail participants. This structure helps retail investors participate meaningfully in the OFS and aligns with the government’s objective of broader public ownership in LIC over time. The Retail and employees discount are separate from the base price; the base price remains Rs 382 in the floor price, with the 3% discount relative to the last close. The retail window opened after the non-retail window and has drawn strong interest as the OFS gets aggregated with the overall demand signal.
Embedded value and profitability are also in focus. At the effective retail price, analysts point to roughly 0.3x FY26 embedded value, while LIC's VNB margin rose to 21.2% in FY26 and the solvency ratio stood at 2.35x, painting a picture of a financially robust institution. The governance and leadership of LIC in the space remains strong, and the market dominance as a public sector leader provides a unique risk-reward dynamic for investors with a longer horizon.
LIC Shareholding Pattern And What It Means For Public Float
LIC's shareholding pattern shows government ownership at 96.5% as of June 30, 2026, underscoring its status as a cornerstone of India's financial sector. The public float must gradually increase to comply with minimum public shareholding requirements, a process accelerated by ongoing divestments. Retail participation has grown, with 20.92 lakh retail shareholders holding about 1.55% stake. This dynamic means a gradual broadening of ownership and potential shifts in liquidity and price formation as the public float expands over time. LIC's scale as India's largest life insurer and the world’s fourth most valuable insurance brand underscores the structural strengths that can support a long-run investment narrative, even as near-term volatility remains.
LIC Stock Price And Short-Term Moves After The OFS
LIC stock price plunged 9% on Tuesday after the OFS opened for non-retail investors, marking the biggest single-day plunge in more than two years. The stock has fallen over 8% in a week and 9% in a month. In longer-term terms, LIC stock price has delivered a negative return of 13% over one year, but gained around 19% in three years. The market capitalization sits near Rs 4.94 lakh crore. These moves reflect a mix of macro risk, OFS mechanics, and eventual re-rating as LIC reaches more public float; investors should watch for stabilization signals and any further updates on the OFS timeline.
Expert Opinion And The Investment Takeaway
According to Ajit Mishra of Religare Broking, While persistence remains an area to watch, the combination of compelling valuation, improving profitability and market leadership makes the OFS an attractive long-term investment opportunity.
In practice, this means retail investors could consider a measured, price-aware approach rather than jumping into the first price movement. The combination of a discounted retail entry price plus robust capital position makes a case for exploring the OFS as a potential long-term position if the risk appetite aligns with the scale of LIC's exposure to the public market.
For deeper, data-driven insights, consult Swastika's Sarthi AI stock assistant.
Related Reads
- LIC Share Price And LIC OFS: What The Government Stake Sale Means For LIC Stock And Public Float
- LIC Share Price Watch: LIC OFS, Stake Sale, And The Divestment Wave
- LIC Share Price Outlook: LIC OFS, Disinvestment, And The 6.5% Stake Sale
Frequently Asked Questions
What is the size and structure of the LIC offer for sale?
The LIC offer for sale comprises a 2.5% base stake, with an additional 4% green shoe option, totaling about Rs 31,410 crore.
What is the floor price of the LIC OFS and how does it relate to the previous close?
The floor price is Rs 382 per share, a discount of 3% to the prior close of Rs 391.3.
What is the effective retail price after the Rs 10 discount?
The effective retail price is Rs 372 per share after the Rs 10 per share discount.
What is LIC's government stake and what does that imply for public float?
The government owns 96.5% of LIC as of June 30, 2026, with a growing public float to meet minimum public shareholding norms over time.
How did LIC stock price react around the OFS?
LIC shares fell 9% on the OFS opening day for non-retail investors, with about an 8% drop over a week and a 9% drop over a month.
What is the analyst view on LIC OFS?
Analysts highlight compelling valuation, improving profitability, and market leadership, though persistence remains a factor to monitor.
Conclusion
In the near term, the LIC offer for sale negotiates a delicate balance between a meaningful stake sale and the market's appetite for a state-backed behemoth in insurance. The base stake of 2.5% plus a 4% green shoe option, a Rs 382 floor price, and Rs 372 effective retail price offer an entry point that can be reasonable if the embedded value and solvency metrics hold firm. The government remains a dominant owner (96.5% as of June 30, 2026), so the public float will grow gradually, and the next price moves will hinge on liquidity, growth, and regulatory expectations. For retail investors, the practical next step is to calibrate risk and capital allocation: consider a small, measured exposure under a defined risk cap, and monitor the LIC Shareholding Pattern as the float expands. Use a data-driven lens–evaluate price against embedded value, monitor solvency, and adjust position sizes as new public float materializes–before deciding on participation. To aid in deeper stock-level checks, consult Swastika's Sarthi AI stock assistant.
LIC Share Price After LIC OFS: Liquidity, Valuation, And Retail Demand
Key Takeaways
- LIC Share Price dynamics could improve as OFS increases free float and liquidity.
- Floor Price is ₹382, with Monday Close ₹428.50 and Current Price ₹391.
- Retail bids on Day 1 reached 323%, signaling appetite for LIC stock.
- Investors should focus on valuation, time horizon, and risk management, not just the discount.
LIC Share Price dynamics are in focus as the government’s stake sale opens with a ₹31,400 crore OFS and a floor price of ₹382 per share. The market has priced in a discount of about 10% against Monday’s ₹428.50 close, while the stock currently trades around ₹391 after a 7.86% session drop. This is the first stake sale since LIC’s 2022 listing, with 6.5% of the stake being offloaded to meet SEBI’s directive to lift public holding to 10%. The divestment push comes ahead of the May 2027 deadline and sits within the broader government divestment trajectory for FY27, which mobilized ₹20,274 crore via PSU divestment–the highest in four years out of the planned ₹80,000 crore.
The LIC OFS is not fresh capital; it is a government stake sale designed to increase liquidity and broaden ownership. For retail investors, the core question is whether the lic share price will reflect the greater float and improved price discovery in the weeks ahead, or whether near-term sentiment will keep prices choppy as the market digests the new public free float.
On Day 1, retail demand was robust: bids for LIC OFS stood at 323%. The offering size, floor price, and discount set up a live test of how the market prices a large, governance-driven stake sale in a blue-chip insurer. The price path over the next several weeks will depend on how the market digests the ratio between the floor and the prevailing price, and how institutional buyers view the long-term value in LIC's business.
| Metric | Value |
|---|---|
| Floor Price | ₹382 per share |
| Monday Close | ₹428.50 |
| Current Price | ₹391 |
| Discount To Close | Approximately 10% |
Experts note that the OFS opens a crucial liquidity channel. As a reference, embedded-value metrics from LIC's FY26 show robust profitability: Value of New Business (VNB) rose 41.6% to ₹14,179 crore with a VNB margin up 360 basis points to 21.2%. Profit after tax (PAT) climbed 19.3% to ₹57,419 crore, and total premium income grew 9.8% to ₹5.36 lakh crore. This backdrop supports a longer-term case for LIC, though the OFS itself is not capital for growth but a strategic liquidity move aligned to public-shareholding targets.
In the broader context, divestment momentum in FY27 reached ₹20,274 crore, the highest in four years, out of a plan to mobilize ₹80,000 crore. Retail appetite on day 1–323% bids–suggests strong engagement from smaller investors, even as the market weighs valuation and horizon. In this setup, float expansion from 3.5% to 10% could meaningfully deepen liquidity and lift index weights, according to market analysts.
According to Nitant Darekar of Bonanza, “Float tripling from 3.5 per cent to 10 per cent should meaningfully deepen liquidity and lift index weights.”
Reference :
Beyond the headline numbers, caution remains warranted. For retail investors, this OFS is as much about pricing discipline and a longer-term time horizon as it is about the immediate discount. A pro-member quote captures a balanced view: for retail participants, this looks more like a pricing-and-time-horizon decision than a pure “must-buy” opportunity, especially given LIC’s size, liquidity tracking, and the non-growth capital nature of this sale.
The floor price action and the discount set a clear anchor for price discovery. At ₹382 per share, the offer remains meaningfully detached from the high-water mark seen earlier in the LIC trading cycle, underscoring the need for patience and disciplined entry if one participates in the OFS. For readers seeking deeper data-centric insights, Swastika's Sarthi AI stock assistant can help tailor stock-specific decisions to your risk profile: Swastika's Sarthi AI stock assistant.
LIC Share Price Outlook After LIC OFS: Liquidity And Valuation
The OFS size of ₹31,400 crore is designed to boost public float and improve liquidity rather than fund growth initiatives. The market’s price discovery will hinge on how the market weights the discount to the close against the floor price and the ultimate mix of retail and institutional participation. LIC’s FY26 numbers reinforce a strong profitability backdrop: VNB growth, margins, and PAT are robust, but the OFS itself is a governance-driven mechanism that should not be conflated with fresh capital for expansion. The divestment push in FY27 and the higher completed PSU divestment tally point toward a broader government strategy to broaden ownership without diluting the core business model.
LIC OFS: What Retail Investors Need To Know About Floor Price And Bids
The floor price of ₹382 per share acts as a reference point for price discovery, with the market noting a close of ₹428.50 on the previous session and a current trading level near ₹391. On Day 1, retail participation was extraordinarily strong, recording 323% bids. This implies a robust appetite but also highlights the premium chalked into LIC stock by existing owners and traders who monitor the stock’s embedded value and government policy signals. The 6.5% offloaded stake is being oriented toward achieving a 10% public holding, a key SEBI directive guiding the divestment strategy for LIC.
From a practical standpoint, the OFS represents a discount entry point against a historically high-price anchor, but participants should calibrate expectations with the broader market environment and LIC’s long-term fundamentals. Price action will likely remain data-dependent over the next few weeks as auctions and allocations finalize and as global and domestic sentiment shifts in the context of the broader market backdrop.
LIC Stock: How OFS Affects Price Discovery And Index Weights
An increase in free float typically enhances liquidity and depth in trading, contributing to more efficient price discovery. The LIC OFS is projected to lift index weights due to the higher free float, which can impact passive and active funds that track LIC’s index components. The commentary around the OFS emphasizes that this event is about timing, pricing, and horizon more than immediate capital gains, suggesting that retail players should think in terms of long-term positioning rather than quick flips. The market's reaction will depend on how quickly the free float translates into broader participation and a stable trading environment.
LIC Share Price NSE: Cross-Exchange Pricing And Market Depth
LIC trades across major Indian exchanges, and the lic share price is typically influenced by cross-market arbitrage, liquidity, and the evolving free float. While the OFS is a single, government-led sale, the price discovery process benefits from broader market participation and the enhanced liquidity that follows a wider public float across exchanges. Traders should watch the consolidation between close-to-floor price dynamics and the flow of bids that reflect retail and institution sentiment. The market will also balance near-term volatility against LIC's underlying profitability metrics, including FY26 PAT and VNB performance, which support a longer-term case for the stock even as the OFS unfolds.
Time Horizon, Valuation, And A Practical Entry Strategy
Given LIC’s size and the OFS’s purpose, a practical approach for retail investors is to treat this as a liquidity-driven event rather than a growth catalyst. A laddered entry strategy or systematic investment plan can help manage price volatility, with attention paid to the floor price as an anchor and the current price as a risk buffer. The discount to close is a notable feature, but the long-term value propositions hinge on LIC's embedded-value metrics, profitability trajectory, and the government’s divestment path for FY27. Investors should consider their risk tolerance and time frame, and avoid overpaying near the top of the trading range during a period of price discovery driven by a large public-offer event.
Related Reads
- LIC Share Price And LIC OFS: What The Government Stake Sale Means For LIC Stock And Public Float
- LIC Share Price Watch: LIC OFS, Stake Sale, And The Divestment Wave
- LIC Share Price Outlook: LIC OFS, Disinvestment, And The 6.5% Stake Sale
Frequently Asked Questions
What is the size of LIC OFS?
The offer size is ₹31,400 crore.
What is the floor price for the LIC OFS?
The floor price is ₹382 per share.
Why is LIC conducting this OFS?
To comply with SEBI’s directive to increase public shareholding to 10%.
How did retail demand perform on Day 1 of the LIC OFS?
Retail bids on Day 1 stood at 323%.
What were LIC's FY26 results?
VNB rose 41.6% to ₹14,179 crore with a VNB margin of 21.2%; PAT rose 19.3% to ₹57,419 crore; Premium income rose 9.8% to ₹5.36 lakh crore.
Conclusion
In short, LIC's OFS could enhance liquidity and broaden ownership, which may gradually improve price formation and index weights over time. Retail investors should stay patient, observe how bids materialize, and apply a disciplined, horizon-based strategy to participate without overpaying. The next steps involve careful monitoring of the price path, the allocation mix, and the evolving market sentiment as LIC stock integrates a larger float into its operating narrative.

Ardee Industries IPO: Growth, Risks, And What It Means For Retail Investors
Key Takeaways
- Ardee Industries IPO marks a pivotal entry into India's lead recycling space.
- Revenue surged to ₹1,167 crore this year, with net profit rising from ₹9 crore to ₹85 crore (FY24–FY26).
- Exports rose to about 40% of revenue as capacity expanded from 54,750 MTPA to 104,025 MTPA.
- Investors should weigh debt, customer concentration, and regulatory hurdles against a growth story with a 15–17x EPS valuation.
A sharp new IPO is turning heads in India's lead recycling space: the Ardee Industries IPO. The Tirupati-based lead recycler plans to raise ₹425 crore, of which ₹320 crore is a fresh issue, to fund working capital and debt repayment of around ₹20 crore. With EV adoption, solar rooftops and telecom towers driving demand for lead-acid solutions, Ardee sits at the center of a growing circular economy. The question for retail investors is simple: can this growth story sustain post-listing, and at what price?
Ardee buys used batteries and lead-bearing waste, melts and purifies the metal in rotary furnaces, and then customizes it into refined lead and alloys used in batteries, cables, and electronics. The plant in Tirupati, Andhra Pradesh, is strategically located near Amara Raja Energy and Mobility and within reach of three ports, enabling faster deliveries and a meaningful cost edge. The company also benefits from a credible footprint, with its refined lead registered on the London Metal Exchange (LME) and an MCX listing that adds transparency for buyers and traders.
According to the IPO prospectus, Ardee intends to raise ₹425 crore, of which ₹320 crore will be a fresh issue to fund working capital and to repay around ₹20 crore of existing debt. The valuation sits at around ₹1,690 crore, implying a roughly 15–17x EPS of about ₹3. This valuation is modest relative to larger peers in the sector but makes sense when one considers Ardee's smaller scale, single-factory footprint, and higher customer concentration. The company has shown remarkable momentum: revenue rose to ₹1,167 crore this year, a 59% CAGR over the last few years, and net profits expanded from ₹9 crore to ₹85 crore between FY24 and FY26. EBITDA margins more than doubled from ~6% to ~13%.
Two levers explain the surge in production and margins: capacity expansion and more accessible import approvals for lead scrap. Ardee's capacity jumped from 54,750 MTPA in FY24 to 104,025 MTPA in FY25, and exports expanded from 17% of revenue in FY24 to almost 40% in FY26. Those improvements helped lift gross margins per tonne by nearly 30%. The export push also diversified the revenue mix and reduced reliance on a few large Indian customers. This creates a more resilient earnings profile as the company scales, assuming it can sustain its compliance track record and manage higher debt levels as it funds growth.
For the investment narrative, it helps to look at the larger sector dynamics. Lead recycling in India sits at the heart of the circular economy, with the bulk of lead recovered from scrap rather than mined ore. Ardee's plant is well-placed to capture demand growth because of its logistics footprint and the increasing stringency around importing lead scrap, which keeps informal players out and rewards regulated recyclers like Ardee that maintain strong ESG standards. The result is a business model that is simple to explain–buy scrap, refine, and sell refined lead and alloys at a premium–yet with meaningful complexity in process improvements and regulatory compliance that impact margins and capacity utilization.
Investors should consider several risk factors. The debt-to-equity ratio has been fairly high in FY24 and FY25, hovering between 2x and 4x, before easing to about 1.25x in FY26. Promoters’ stake will fall from 91% to about 67% post-IPO, which changes the ownership dynamics. Customer concentration remains a risk; more than 50 customers contribute to revenue, but the top ten account for roughly 90% of sales. While the plant's strategic location offers a cost advantage, the business still depends on obtaining and maintaining environmental clearances for importing lead scrap, a hurdle that can restrict capacity utilization in the near term. Valuation remains reasonable at 15–17x EPS given the scale and the mass of risk factors outlined above. In short, Ardee's growth story is compelling but not without substantial risks that investors should carefully weigh against the potential upside.
As you assess this opportunity, you might explore deeper stock insights with Swastika's Sarthi AI stock assistant: Swastika's Sarthi AI stock assistant. For more context on lead recycling peers and how Ardee stacks up, this article provides a framework you can apply to any new IPO in this niche.
Gravita Stock: Valuation And Growth Compared With Ardee's IPO Opportunity
In the broader lead recycling space, Gravita India is a larger, more diversified player with a longer public track record. While Gravita stock offers a benchmark for scale and international exposure, Ardee's current narrative emphasizes rapid capacity expansion and near-term margin acceleration. Investors should weigh Gravita's higher absolute revenue and profit base against Ardee's younger growth trajectory and a lower starting valuation multiple (15–17x vs. typically higher multiples for established peers). The price discipline, export mix, and debt trajectory will be critical in determining which stock keeps delivering better risk-adjusted returns as the sector consolidates.
Gravita's strengths lie in its established footprint and broader product mix, but Ardee's proximity to battery manufacturers and port access creates a compelling cost advantage if regulatory conditions remain favorable. The comparison underscores an essential point for IPO investors: investing in a fast-growing, asset-light opportunity can offer higher upside, but it often comes with higher execution risk and leverage, especially in a sector shaped by environmental and import controls.
Amara Raja Stock: A Battery Materials Benchmark For Ardee's Prospects
Amara Raja Batteries, a leader in the battery materials ecosystem, serves as a larger, diversified benchmark for investors evaluating Ardee. While Amara Raja's scale and cash flows are far bigger, it demonstrates how an integrated player with a broader product portfolio can balance cyclicality. For Ardee, Amara Raja offers a template on how to manage customer relationships, supply chain resilience, and the importance of regulatory clarity in a capital-intensive industry. The Amara Raja stock price path historically reflects a mature business with a stable earnings profile, which contrasts with Ardee's rapid, near-term growth narrative. Investors should consider how Ardee's margins and export mix will evolve as it scales and whether the company can sustain its post-IPO financial trajectory in a market that rewards diversification and scale.
As Ardee expands its footprint, the potential for collaboration or competition with Amara Raja-like players emerges. The strategic takeaway is that while Ardee could benefit from a strong supplier and distributor network, it must maintain its ESG and regulatory compliance to protect margins and sustain growth within a crowded, capital-intensive sector.
Jain Resource Recycling Stock: Peer Benchmark For Ardee's Sector
Jain Resource Recycling is another peer in the Indian lead recycling space, offering a smaller-scale comparison point for investors who want to gauge the sustainability of Ardee's growth narrative. Jain Resource Recycling stock highlights how lead recycling profits can hinge on raw material costs, export demand, and regulatory clarity. While Jain Resource Recycling may not match Ardee's current scale, the stock provides a reference for how the market values profitability, capacity utilization, and risk management in a sector that relies heavily on environmental approvals and global metal prices. For Ardee, the key lesson is to monitor how expansion, debt management, and customer diversification translate into consistent earnings growth relative to peers.
In all, these peers illustrate the spectrum within the sector: from the lean, high-growth profile of Ardee Industries IPO to the larger, diversified operations of Gravita, Amara Raja, and Jain Resource Recycling. A careful comparison helps retail investors understand the risk-return profile and the potential catalysts that could propel or constrain the stock's trajectory as the circular economy becomes an increasingly central theme in India’s industrial landscape.
Related Reads
Frequently Asked Questions
What is Ardee Industries IPO and what does it seek to raise?
The IPO aims to raise ₹425 crore, of which ₹320 crore is a fresh issue, to fund working capital and debt repayment of around ₹20 crore.
What drives Ardee Industries' revenue growth and margins?
Growth is driven by capacity expansion from 54,750 MTPA to 104,025 MTPA, improved gross margins per tonne (about 30% uplift), and export expansion from 17% to roughly 40% of revenue by FY26.
What are the major risks for investors in Ardee Industries IPO?
Key risks include high debt levels in FY24–FY25, promoter stake dilution post-IPO to around 67%, customer concentration with the top ten customers making up about 90% of revenue, regulatory hurdles around importing lead scrap, and the company’s single-factory footprint.
How does Ardee Industries compare with Gravita Stock or Jain Resource Recycling Stock?
Ardee offers a growth story priced around 15–17x EPS (~₹3), which is lower than larger peers Gravita and Jain Resource Recycling. Scale, export mix, and debt levels drive valuation differences, so investors should compare operating leverage and capital intensity when considering peers.
What should investors do before subscribing to the Ardee Industries IPO?
Assess your risk tolerance against the growth narrative, review the IPO's use of funds, debt levels, and customer concentration, and consider consulting Swastika's Sarthi AI stock assistant for deeper stock research.
Conclusion
Ardee Industries IPO sits at a pivotal intersection of circular economy momentum and a growth-sensitive capital market. The business model–recovering lead from scrap, refining it, and selling tailored products–has a clear, scalable logic, reinforced by a favorable location in Tirupati, strategic proximity to battery manufacturers, and a regulatory environment that is shifting toward formalization of recycling activities. The numbers in the IPO narrative are striking: ₹1,167 crore revenue this year, 59% revenue CAGR, ₹85 crore net profit in FY26 (up from ₹9 crore in FY24), and EBITDA margins near 13%. Capacity expansion to 104,025 MTPA and exports rising to about 40% of revenue illustrate how the growth engine could continue to power earnings, provided the environmental and import hurdles remain manageable.

Nifty Share Price Outlook: Global Cues Support A Positive Open On Dalal Street
Key Takeaways
- Nifty Share Price moved higher with the GIFT Nifty at 24,707, up 128 points or 0.52%.
- Key support sits at 24,400 and 24,200, while resistance remains at 24,800.
- FII activity shows net buying of Rs 2,446 crore, while DIIs are net sellers at Rs 936 crore.
- Global cues point to a positive open, with US futures firm and Asian markets mixed.
As global cues influence domestic markets, the Nifty Share Price remains at a pivotal juncture. The GIFT Nifty on the NSE IX traded higher by 128 points, or 0.52 per cent, at 24,707, signaling that Dalal Street was headed for a positive start on Wednesday. The Nifty Share Price theme today is shaped by a balance between support at key levels and a looming test of resistance. The short-term trend is likely to stay sideways to positive as long as the index holds above 24,400. A decisive break below this level could trigger a deeper correction. On the downside, support is placed at 24,400 and 24,200, while on the upside, the immediate resistance sits at 24,800.
| Indicator | Level / Change |
|---|---|
| GIFT Nifty | 24,707, Up 128 points, +0.52% |
| India VIX | 12.19, +2% |
| S&P 500 Futures | +0.2% |
| Hang Seng Futures | +0.3% |
| Japan Topix | +1.5% |
| Australia ASX 200 | +0.2% |
| Euro Stoxx 50 Futures | +0.4% |
| FII Net | Rs 2,446 crore (Net Buy) |
| DIIs Net | Rs 936 crore (Net Sell) |
| Rupee | 95.28 per USD (Appreciated 9 paise) |
The broader macro backdrop suggests cautious optimism. While the Nifty share price level paints a hopeful opening picture, foreign and domestic flows will continue to play a decisive role. The rupee’s strength alongside net FII inflows could provide a tailwind for the benchmark index, even as global risk appetite remains uneven. For retail investors, the key is to watch the levels closely: 24,400 as a critical guardrail and 24,800 as a near-term upside target while staying mindful of potential volatility in a globally linked atmosphere.
Nifty Share Price Outlook For The Open: 24,707 Levels And 24,400 Support
The overnight closing level of 24,707 for the GIFT Nifty hints at a positive bias at the start of the session. If the Nifty share price can sustain above 24,400, the risk of a deeper correction diminishes and the path toward 24,800 becomes more probable. A break below 24,400 would restore pressure and could pull the index toward the next line of defense around 24,200. Traders should monitor the 24,800 mark as a proximal resistance where profit-taking could intensify if approached without decisive breakout momentum.
India VIX rose 2% to 12.19, signaling a slight uptick in near-term volatility. The options market’s current mood suggests traders are braced for a choppy ride, though the prevailing drift remains constructive as global cues show resilience. In this environment, risk management becomes paramount; consider using stop-loss levels around key pivots and avoid overcrowded bets in the absence of a clear breakout signal.
Nifty Futures Live Signals And Overnight Market Direction
Watching the Nifty futures closely helps translate global sentiment into actionable trades for the domestic market. The concept of Nifty futures and SGX Nifty live signals implies a likely positive open given the overnight momentum. In the broader global context, US indices climbed to record highs on Tuesday as AI-related earnings buoyed sentiment, while commodity prices and Treasury yields eased on the prospect of a deal resolving tensions in West Asia. The latest overseas cues show S&P 500 futures rising around 0.2%, with Hang Seng futures up about 0.3%, and Japan’s Topix rising roughly 1.5%. Australian markets also inched higher, with the ASX 200 up about 0.2%, while Euro Stoxx 50 futures gained 0.4%.
For Indian traders, this means the Nifty Share Price could open with a bullish bias if domestic factors align with the global risk-on tone. But chasing momentum without regard to levels can invite whipsaws; thus, one should anchor positions around the 24,400 support and the 24,800 resistance. The Nifty futures’ narrative suggests maintaining a flexible approach–profitable outcomes often come from nimble risk management rather than large directional bets in a single session.
Palantir Stock Price Trends And Caterpillar Stock Price Signals
The global backdrop includes AI-driven earnings from Caterpillar and Palantir, which helped assuage demand concerns and underpin a more optimistic mood in risk assets. While there is no explicit intraday price move disclosed here for Palantir stock or Caterpillar stock price, their earnings-driven performance is a barometer for the broader AI and industrials cycle. Investors in the Indian market should watch these names for spillover effects–strong AI-adjacent earnings can buoy sentiment and support a constructive global lead into the local session.
In practical terms, stock-specific moves in US-listed equities often influence Indian equities through sentiment channels and correlation with global growth themes. For retail investors, it’s prudent to keep stock selection focused on quality exposure, while not overconcentrating in a single theme. The Palantir stock price and Caterpillar stock price signals in the global arena are a reminder to diversify across sectors and align with your risk tolerance and time horizon.
Market Flows And The Rupee: FII And DII Activity In Focus
Market breadth and flows remain a critical determinant of near-term direction. Foreign institutional investors net bought shares worth Rs 2,446 crore on Tuesday, while domestic institutional investors were net sellers at Rs 936 crore. The rupee appreciated 9 paise to close at 95.28 against the US dollar, aided by easing geopolitical tensions and inflows. These numbers matter for the Nifty Share Price because heftier FIIs inflows generally lend support to large-cap indices during periods of global improvement in risk appetite.
Retail portfolios should weigh the implications of these flows alongside the technical levels. A sustained FII pull could help the index test the 24,800 level, while continued DII selling pressure might cap gains and necessitate tighter risk controls. Investors should calibrate exposure based on risk tolerance, liquidity needs, and the probability of further volatility in the coming sessions.
Practical Steps For Retail Investors In A Moving Market
Given the mixed cues and the critical level framework around 24,400/24,200 (supports) and 24,800 (resistance), retail investors can consider a few disciplined steps: - Build a watchlist around high-quality large caps and sectors that tend to outperform in risk-on environments. - Use tight stop losses to protect against a swift downside break below 24,400. - Consider laddered entries if you expect a sustained breakout above 24,800, but avoid chasing overbought conditions. - Monitor FIIs and DIIs flows as they can tilt the near-term bias; be prepared to flip risk posture if flows reverse meaningfully. - Leverage AI-powered research to refine stock picks. For this, you can access Swastika's Sarthi AI stock assistant by clicking on the link below to get institution-level research on any stock or index: Swastika's Sarthi AI stock assistant.
In addition to these steps, maintain a clear risk management framework and avoid over-leveraging in a market that can swing on global cues. The current setup–GIFT Nifty at 24,707, a pivotal 24,400 support, and a 24,800 resistance–calls for patience and precise execution rather than broad-based bets. As always, align trades with your time horizon and capital allocation plan, and stay updated with the latest market cues as they unfold across global markets.
Related Reads
- Nifty Share Price Outlook: Key Levels, Bearish Signals, And Opportunities Ahead
- Nifty Share Price Outlook After GIFT Nifty Signals Firm Start
- NVIDIA Stock Price Context: Open-Weight AI Push And The Race For AI Openness
Frequently Asked Questions
Are share price and Nifty related?
Yes. Movements in the Nifty share price often reflect a mix of global cues and domestic flow dynamics. In the current setup, global signals like US futures and Asian market directions influence the Nifty share price, while local factors such as FII/DII activity and the rupee level provide additional context.
How do Nifty and Sensex influence share prices?
Nifty and Sensex are major market indicators that summarize the health of large-cap equities. When they move higher, it often lifts sentiment and broad-based participation, while a dip can trigger risk-off moods. In the current scenario, the Nifty share price movement is guided by global cues and key support/resistance around 24,400 and 24,800.
What are the current key support and resistance levels for the Nifty?
Key support levels are at 24,400 and 24,200, while the immediate resistance is at 24,800. A sustained move above 24,800 could open the path to further upside, whereas a break below 24,400 could trigger a deeper correction.
Where can I get AI stock research to enhance my stock picks?
You can access institutional-grade research for any stock or index through Swastika's Sarthi AI stock assistant at Swastika's Sarthi AI stock assistant. It provides actionable insights to help refine your investment decisions.
What is the latest FII and DII action and the rupee level?
Foreign portfolio investors bought shares worth Rs 2,446 crore, while DIIs were net sellers at Rs 936 crore. The rupee closed at 95.28 per U.S. dollar, appreciating 9 paise.
Conclusion
The Nifty share price is navigating a delicate balance: the open remains positive so long as 24,400 holds, with upside potential into the 24,800 zone if momentum sustains. In this environment, retail investors should tether risk to defined supports, diversify across resilient sectors, and stay nimble as global cues evolve. The next step is to translate these insights into a practical plan that matches your risk tolerance and investment horizon, using disciplined entry and exit rules rather than chasing headlines.
Open your trading and demat account here
Reference :
1 : Economictimes

Power Grid Share Price And Q1 Results: Key Takeaways For Retail Investors
Key Takeaways
- Power Grid Share Price moves as Q1 results shape investor expectations.
- Power Grid's revenue is pegged at Rs 12,534 crore and EBITDA at Rs 10,178.4 crore with profit of Rs 3,866.5 crore.
- Margins across peers range from 9.96% to 25.76%, highlighting dispersion in the quarter.
- Retail investors should focus on margin resilience and revenue quality to guide the next move.
What happens when a large, regulated utility reports its quarter and the broader market echoes with the first wave of earnings from diverse sectors? Power Grid Share Price moves could become the first reflex as investors weigh the strength of revenue and EBITDA against margins and regulatory headwinds. In this analysis, we dissect the Q1 results cycle announced today for Power Grid and peers like Cummins India, GE Vernova T&D India, Aurobindo Pharma, PB Fintech, Biocon, and Berger Paints India to translate raw figures into actionable insights for retail investors.
Power Grid Share Price After Q1 Results: What The Numbers Signal For Investors
Power Grid is expected to post revenue Rs 12,534 crore and profit Rs 3,866.5 crore. Ebitda is likely to be at Rs 10,178.4 crore. These core figures form the baseline for how the Power Grid share price may respond–strong cash generation supports dividends, capex funding, and steady earnings, all of which are positive signals for long-term holders and short-term traders alike.
The numbers reflect a solid operating platform in a regulated arena where capex and capital deployment decisions drive cash flow. The market will scrutinize whether the revenue quality remains intact and whether EBITDA efficiency is preserved amid evolving regulatory and market dynamics. For retail investors, this is a critical litmus test for the durability of the earnings model behind the Power Grid share price.
Power Grid Results: Revenue, Profit, And EBITDA Highlights From Q1
Other names on the reporting slate include Cummins India, GE Vernova T&D India, Aurobindo Pharma, PB Fintech, Biocon, and Berger Paints India, among others on the broader list. Here are the key Q1 metrics in concise form: Cummins India revenue Rs 3,217.1 crore; profit Rs 3,011.1 crore; EBITDA Rs 674.2 crore; margin 21.67%. GE Vernova T&D India revenue Rs 1,737.3 crore; profit Rs 337.3 crore; EBITDA Rs 449.2 crore; margin 25.76%. Aurobindo Pharma revenue Rs 9,054.6 crore; profit Rs 1,017.2 crore; EBITDA Rs 1,865.2 crore; margin 20.30%. PB Fintech revenue Rs 1,803.2 crore; profit Rs 148.2 crore; EBITDA Rs 150.9 crore; margin 9.96%. Biocon revenue Rs 4,505.4 crore; profit Rs 181.2 crore; EBITDA Rs 957.3 crore; margin 21.21%. Berger Paints India revenue Rs 3,606.4 crore; profit Rs 390.2 crore; EBITDA Rs 593.9 crore; margin 17.20%.
These figures, announced as part of a broader earnings cycle, illustrate sector-wide dispersion in margins and profitability. While Power Grid continues to show robust EBITDA generation, peers display a range of margin profiles that can influence relative stock performance and sector leadership. The broader list also includes Aster DM Quality Care, Navin Fluorine International, Aegis Vopak Terminals, Inventurus Knowledge Solutions, Neuland Laboratories, Tenneco Clean Air India, Bayer CropScience, eClerx Services, Cohance Lifesciences, Bikaji Foods International, Shilpa Medicare, Godrej Agrovet, Whirlpool of India, and Time Technoplast, indicating the breadth of Q1 coverage retail investors are tracking today.
Biocon Stock Price Today And Biocon Stock Outlook Post Q1
Biocon revenue Rs 4,505.4 crore; profit Rs 181.2 crore; EBITDA Rs 957.3 crore; margin 21.21%. Biocon stock price today will be influenced by these numbers, particularly the solid margin profile and cash flow potential in the quarter. While the headline profit is modest, the margin clarity and earnings quality can support steadier sentiment for Biocon stock moving forward.
Biocon’s Q1 performance, reflected in the margin and EBITDA consistency, provides a basis for evaluating the stock’s near-term trajectory. Investors may weigh this against sector peers to gauge relative strength within the Biocon stock context and its price sensitivity to earnings surprises or regulatory developments in the pharmaceutical space.
Cummins India Stock Price After Q1 Results
Cummins India revenue Rs 3,217.1 crore; profit Rs 3,011.1 crore; EBITDA Rs 674.2 crore; margin 21.67%. The Cummins India stock price could respond to the robust profitability and a high EBITDA margin, signaling efficiency in a machinery and components segment that is sensitive to macro cycles and capex outlook. The solid margin of 21.67% stands out relative to many peers and can support a constructive view on the stock’s near-term risk-reward profile.
As investors compare across the quarter’s results, Cummins India’s numbers highlight how margin discipline translates into price resilience for stockholders, even as input costs and demand patterns vary across heavy equipment and industrials. The performance backdrop sets a benchmark for the sector and provides a reference point for traders watching the Cummins India stock price action after the Q1 release.
Aurobindo Pharma Stock Price: Q1 Revenue And Margin Insights
Aurobindo Pharma revenue Rs 9,054.6 crore; profit Rs 1,017.2 crore; EBITDA Rs 1,865.2 crore; margin 20.30%. The Aurobindo Pharma stock price is likely to be influenced by this revenue strength and healthy margin, particularly as the pharma sector navigates pricing dynamics and regulatory milestones. A strong EBITDA base of Rs 1,865.2 crore provides a cushion for earnings quality and potential value creation for shareholders.
Investors should assess whether Aurobindo Pharma’s growth catalysts–and the margin trajectory–align with the stock’s current price. The Q1 data supports a constructive stance if profitability sustains and growth drivers remain intact, which could help the Aurobindo Pharma stock price outperform in a volatile market environment.
Berger Paints Stock Price And Margin Profile After Q1
Berger Paints India revenue Rs 3,606.4 crore; profit Rs 390.2 crore; EBITDA Rs 593.9 crore; margin 17.20%. Berger Paints’ margin around 17.20% in Q1 signals a steady paint and coatings business with pricing power and volume resilience in a cyclical consumer discretionary space. The Berger Paints stock price could reflect this stability, especially if input costs remain contained and demand for decorative coatings holds up in urban and rural segments.
As with other consumer-oriented names on the list, Berger Paints’ Q1 metrics provide a reference for investors assessing margin sustainability across dispersion-heavy sectors. The stock’s response to these numbers will hinge on both top-line momentum and cost discipline in the coming quarters.
PB Fintech Stock Price Context: Revenue And Margin In Q1
PB Fintech revenue Rs 1,803.2 crore; profit Rs 148.2 crore; EBITDA Rs 150.9 crore; margin 9.96%. The PB Fintech stock price context reflects a lower EBITDA margin relative to several peers, signaling growth investments and operating leverage challenges common to fintech platforms transitioning to scale. The 9.96% margin highlights a different risk-reward dynamic for PB Fintech compared with traditional manufacturing and utilities peers.
Readers should consider how platform businesses manage take-rate, operating expenses, and user growth when evaluating PB Fintech stock price movements in light of Q1 performance. The margin pressure relative to growth potential presents a nuanced picture for investors tracking this fintech stock and its potential for multiple expansion or compression.
For deeper stock-by-stock analysis and scenario planning, you can explore Swastika's Sarthi AI stock assistant: Swastika's Sarthi AI stock assistant.
Related Reads
- Bharti Airtel Share Price Deep Dive: RBI MPC Outlook And Q1 FY27 Earnings Signals
- Sun Pharma Share Price And US Tariff Talks: What Indian Retail Investors Must Watch
- Sun Pharma Share Price And The US Tariff Debate: What Indian Retail Investors Must Know
Frequently Asked Questions
What are Power Grid's Q1 revenue and EBITDA figures?
Power Grid is expected to post revenue Rs 12,534 crore and profit Rs 3,866.5 crore; EBITDA Rs 10,178.4 crore.
What are Cummins India’s Q1 revenue and EBITDA?
Cummins India revenue Rs 3,217.1 crore; profit Rs 3,011.1 crore; EBITDA Rs 674.2 crore; margin 21.67%.
What are Aurobindo Pharma’s Q1 revenue and EBITDA?
Aurobindo Pharma revenue Rs 9,054.6 crore; profit Rs 1,017.2 crore; EBITDA Rs 1,865.2 crore; margin 20.30%.
What is Berger Paints India’s Q1 revenue and margin?
Berger Paints India revenue Rs 3,606.4 crore; profit Rs 390.2 crore; EBITDA Rs 593.9 crore; margin 17.20%.
What is PB Fintech’s Q1 revenue and EBITDA margin?
PB Fintech revenue Rs 1,803.2 crore; profit Rs 148.2 crore; EBITDA Rs 150.9 crore; margin 9.96%.
Conclusion
The Q1 numbers across Power Grid and its peers underline a sector-wide mix of robust absolute revenue and varying margins, with Power Grid’s EBITDA strength standing out in a regulated framework. For the Power Grid share price, the key takeaway is that margin resilience and cash generation are as important as topline growth when pricing in a period of policy-driven capex and sectoral cyclicality. Retail investors should track how these dynamics translate into sustained earnings quality, dividend capacity, and capital deployment decisions.
Open your trading and demat account here
Reference :
1 : Ndtvprofit
Big Budget


Popular Articles





.avif)
.avif)

.avif)



START YOUR INVESTMENT JOURNEY
Get personalized advice from our experts
- Dedicated RM Support
- Smooth and Fast Trading App
