


Hero MotoCorp Share Price Momentum: MOFSL Buy Ideas Across Three Stocks




Key Takeaways
- Motilal Oswal's Chandan Taparia flags Hero MotoCorp, Siemens, and Laurus Labs as top technical buy ideas.
- Hero MotoCorp Share Price sits around ₹5,548 with a target of ₹5,880 and a stop-loss of ₹5,380.
- Siemens Stock Price sits around ₹4,000 with a target of ₹4,240 and a stop-loss of ₹3,880.
- Laurus Labs Stock Price sits around ₹1,850 with a target of ₹1,950 and a stop-loss of ₹1,850.
Today’s opening note from MOFSL's technical desk asks a crisp question: can a chart tell you where the next big move in Indian equities will come from? On Aug 5, 2026, Chandan Taparia identified three stock ideas–Hero MotoCorp, Siemens, and Laurus Labs–as technical buys, arguing bullish chart patterns, breakout confirmations, and persistent sector momentum. The Hero MotoCorp Share Price is trading around ₹5,548 as this note goes live, with a target of ₹5,880 and a protective stop at ₹5,380. The other two picks also carry specific price targets: Siemens Stock at ₹4,000 with a target of ₹4,240 and a stop at ₹3,880; Laurus Labs Stock Price around ₹1,850 with a target of ₹1,950 and a stop at ₹1,850.
Taparia's stance relies on price action and momentum rather than fundamentals alone. He cites bullish chart patterns and breakout formations that line up with a broader rally in their respective sectors. For Hero MotoCorp, the live price hints at a setup that could lift the stock toward its ₹5,880 target if the price sustains above the breakout zone. Siemens and Laurus Labs show similar chart confirmations, aligned with the current risk appetite in Indian equities. This is a technical thesis, not a fundamental call, and it rests on disciplined risk management and observance of price action signals.
To help readers visualize the data, consider the quick snapshot below. The numbers reflect the LTP (last traded price) available at the time of writing, and the targets indicate the price level where Taparia expects upside based on his chart patterns and momentum analysis. Risk management remains essential, as stops are a built-in guardrail to protect capital on adverse moves. The LTPs and targets reflect the morning session on Aug 5, 2026–the article's first published time was 7:37 AM IST, and the last update was at 7:38 AM IST.
| Stock | LTP (₹) | Target (₹) | Stop-Loss (₹) |
|---|---|---|---|
| Hero MotoCorp | ₹5,548 | ₹5,880 | ₹5,380 |
| Siemens | ₹4,000 | ₹4,240 | ₹3,880 |
| Laurus Labs | ₹1,850 | ₹1,950 | ₹1,850 |
Hero MotoCorp Share Price momentum is the centerpiece of Taparia's three-stock note. The Hero MotoCorp chart signals a breakout formation amid rising sectoral momentum and improving liquidity in the auto space. If the stock sustains above the breakout zone and the moving averages align, the ₹5,880 target becomes increasingly plausible. The risk framework remains crisp: a daily close below ₹5,380 would be a caution flag for fresh entries or new longs.
Hero MotoCorp Share Price Momentum: Chart Breakouts And Buy Signals
Hero MotoCorp's LTP stands at ₹5,548, with a target of ₹5,880 and a stop-loss of ₹5,380. Taparia's note emphasizes bullish chart patterns and breakout confirmations that align with the broader auto-ancillary space's momentum. A sustained move above the ₹5,600 mark would increase the probability of testing the ₹5,880 target. Yet, as always, discipline matters; a close below ₹5,380 could invalidate the pattern and signal caution for new entries.
From a risk-management perspective, investors should consider position sizing and trailing stops as price moves in their favor. The overarching message is to blend chart analysis with a clear exit plan, rather than chasing momentum without guardrails. For readers seeking additional checks, Swastika's Sarthi AI stock assistant offers institutional-grade research on any stock or index–you can explore it here: Swastika's Sarthi AI stock assistant.


Siemens Stock Price Chart: Breakout Potential And Momentum
Siemens's current price is ₹4,000, with a target of ₹4,240 and a stop-loss of ₹3,880. The chart setup points to a bullish continuation as the stock participates in the broader momentum in the industrials space. A move above the nearest resistance around ₹4,020 could pave the way toward ₹4,240, while a fall below ₹3,880 would dampen the bullish thesis and call for caution.
Laurus Labs Stock Price Chart: Setup And Breakout Potential
Laurus Labs's price sits at ₹1,850, with a target of ₹1,950 and a stop-loss of ₹1,850. The Laurus Labs chart shows potential for a breakout, supported by a favorable price action and the broader momentum in the pharma and contract research space. A successful move beyond resistance near ₹1,900 could accelerate toward ₹1,950, while a move below ₹1,850 would challenge the bullish view.
For readers with a smaller portfolio, the idea is to integrate these signals as part of a balanced strategy. Consider allocation limits, diversification across sectors, and a clear plan to exit if positions fail to meet their targets. The goal is not to chase every breakout but to identify high-conviction ideas that align with your risk tolerance and investment horizon.
Next Steps For Investors: How To Use MOFSL Signals In A Small Portfolio
These three ideas form a cohesive narrative: price action in Hero MotoCorp, Siemens, and Laurus Labs shows how technicals can help shape risk-managed positions. In a small portfolio, consider deploying 1–2% of capital per name and using trailing stops to protect profits as the shares move. The idea is not to chase every spike; rather, integrate chart-based signals with your own risk tolerance and investment horizon. Remember that the numbers above reflect a snapshot from the morning of Aug 5, 2026; always verify prices before you trade.
Related Reads
- Infosys Stock Price Signals And Market Moves: Nifty Ends Lower As IT Leads
- Infosys Share Price And Market Pulse: A Retail Investor's Guide
- Wipro Share Price And This Week's Corporate Actions: A Retail Investor's Guide
Frequently Asked Questions
Which stocks did MOFSL's Chandan Taparia highlight on Aug 5, 2026?
Hero MotoCorp, Siemens, and Laurus Labs.
What are the target prices for Hero MotoCorp, Siemens, and Laurus Labs in the MOFSL note?
Hero MotoCorp: ₹5,880; Siemens: ₹4,240; Laurus Labs: ₹1,950.
What are the current LTPs for Hero MotoCorp, Siemens, and Laurus Labs as per the MOFSL note?
Hero MotoCorp: ₹5,548; Siemens: ₹4,000; Laurus Labs: ₹1,850.
What are the recommended stop-loss levels for these stocks?
Hero MotoCorp: ₹5,380; Siemens: ₹3,880; Laurus Labs: ₹1,850.
When was the MOFSL note published and updated?
First Published: Aug 05, 2026, 7:37 AM IST; Last Updated: Aug 05, 2026, 7:38 AM IST.
Conclusion
The takeaway for the retail investor is simple: use chart-driven ideas as a way to structure risk and allocate capital more thoughtfully, rather than chasing headlines. The three MOFSL picks–Hero MotoCorp, Siemens, and Laurus Labs–offer a disciplined framework for identifying potential market leaders with clear price targets and defined stops. In the mini-market context of Aug 5, 2026, the Hero MotoCorp Share Price context hints at upside toward ₹5,880 if momentum holds, while Siemens and Laurus Labs provide complementary exposure with controlled risk. Treat these signals as a starting point for your own risk-managed playbook, not a guaranteed outcome.
Open your trading and demat account here
Reference :
Latest Articles
Hero MotoCorp Share Price Momentum: MOFSL Buy Ideas Across Three Stocks


Key Takeaways
- Motilal Oswal's Chandan Taparia flags Hero MotoCorp, Siemens, and Laurus Labs as top technical buy ideas.
- Hero MotoCorp Share Price sits around ₹5,548 with a target of ₹5,880 and a stop-loss of ₹5,380.
- Siemens Stock Price sits around ₹4,000 with a target of ₹4,240 and a stop-loss of ₹3,880.
- Laurus Labs Stock Price sits around ₹1,850 with a target of ₹1,950 and a stop-loss of ₹1,850.
Today’s opening note from MOFSL's technical desk asks a crisp question: can a chart tell you where the next big move in Indian equities will come from? On Aug 5, 2026, Chandan Taparia identified three stock ideas–Hero MotoCorp, Siemens, and Laurus Labs–as technical buys, arguing bullish chart patterns, breakout confirmations, and persistent sector momentum. The Hero MotoCorp Share Price is trading around ₹5,548 as this note goes live, with a target of ₹5,880 and a protective stop at ₹5,380. The other two picks also carry specific price targets: Siemens Stock at ₹4,000 with a target of ₹4,240 and a stop at ₹3,880; Laurus Labs Stock Price around ₹1,850 with a target of ₹1,950 and a stop at ₹1,850.
Taparia's stance relies on price action and momentum rather than fundamentals alone. He cites bullish chart patterns and breakout formations that line up with a broader rally in their respective sectors. For Hero MotoCorp, the live price hints at a setup that could lift the stock toward its ₹5,880 target if the price sustains above the breakout zone. Siemens and Laurus Labs show similar chart confirmations, aligned with the current risk appetite in Indian equities. This is a technical thesis, not a fundamental call, and it rests on disciplined risk management and observance of price action signals.
To help readers visualize the data, consider the quick snapshot below. The numbers reflect the LTP (last traded price) available at the time of writing, and the targets indicate the price level where Taparia expects upside based on his chart patterns and momentum analysis. Risk management remains essential, as stops are a built-in guardrail to protect capital on adverse moves. The LTPs and targets reflect the morning session on Aug 5, 2026–the article's first published time was 7:37 AM IST, and the last update was at 7:38 AM IST.
| Stock | LTP (₹) | Target (₹) | Stop-Loss (₹) |
|---|---|---|---|
| Hero MotoCorp | ₹5,548 | ₹5,880 | ₹5,380 |
| Siemens | ₹4,000 | ₹4,240 | ₹3,880 |
| Laurus Labs | ₹1,850 | ₹1,950 | ₹1,850 |
Hero MotoCorp Share Price momentum is the centerpiece of Taparia's three-stock note. The Hero MotoCorp chart signals a breakout formation amid rising sectoral momentum and improving liquidity in the auto space. If the stock sustains above the breakout zone and the moving averages align, the ₹5,880 target becomes increasingly plausible. The risk framework remains crisp: a daily close below ₹5,380 would be a caution flag for fresh entries or new longs.
Hero MotoCorp Share Price Momentum: Chart Breakouts And Buy Signals
Hero MotoCorp's LTP stands at ₹5,548, with a target of ₹5,880 and a stop-loss of ₹5,380. Taparia's note emphasizes bullish chart patterns and breakout confirmations that align with the broader auto-ancillary space's momentum. A sustained move above the ₹5,600 mark would increase the probability of testing the ₹5,880 target. Yet, as always, discipline matters; a close below ₹5,380 could invalidate the pattern and signal caution for new entries.
From a risk-management perspective, investors should consider position sizing and trailing stops as price moves in their favor. The overarching message is to blend chart analysis with a clear exit plan, rather than chasing momentum without guardrails. For readers seeking additional checks, Swastika's Sarthi AI stock assistant offers institutional-grade research on any stock or index–you can explore it here: Swastika's Sarthi AI stock assistant.
Siemens Stock Price Chart: Breakout Potential And Momentum
Siemens's current price is ₹4,000, with a target of ₹4,240 and a stop-loss of ₹3,880. The chart setup points to a bullish continuation as the stock participates in the broader momentum in the industrials space. A move above the nearest resistance around ₹4,020 could pave the way toward ₹4,240, while a fall below ₹3,880 would dampen the bullish thesis and call for caution.
Laurus Labs Stock Price Chart: Setup And Breakout Potential
Laurus Labs's price sits at ₹1,850, with a target of ₹1,950 and a stop-loss of ₹1,850. The Laurus Labs chart shows potential for a breakout, supported by a favorable price action and the broader momentum in the pharma and contract research space. A successful move beyond resistance near ₹1,900 could accelerate toward ₹1,950, while a move below ₹1,850 would challenge the bullish view.
For readers with a smaller portfolio, the idea is to integrate these signals as part of a balanced strategy. Consider allocation limits, diversification across sectors, and a clear plan to exit if positions fail to meet their targets. The goal is not to chase every breakout but to identify high-conviction ideas that align with your risk tolerance and investment horizon.
Next Steps For Investors: How To Use MOFSL Signals In A Small Portfolio
These three ideas form a cohesive narrative: price action in Hero MotoCorp, Siemens, and Laurus Labs shows how technicals can help shape risk-managed positions. In a small portfolio, consider deploying 1–2% of capital per name and using trailing stops to protect profits as the shares move. The idea is not to chase every spike; rather, integrate chart-based signals with your own risk tolerance and investment horizon. Remember that the numbers above reflect a snapshot from the morning of Aug 5, 2026; always verify prices before you trade.
Related Reads
- Infosys Stock Price Signals And Market Moves: Nifty Ends Lower As IT Leads
- Infosys Share Price And Market Pulse: A Retail Investor's Guide
- Wipro Share Price And This Week's Corporate Actions: A Retail Investor's Guide
Frequently Asked Questions
Which stocks did MOFSL's Chandan Taparia highlight on Aug 5, 2026?
Hero MotoCorp, Siemens, and Laurus Labs.
What are the target prices for Hero MotoCorp, Siemens, and Laurus Labs in the MOFSL note?
Hero MotoCorp: ₹5,880; Siemens: ₹4,240; Laurus Labs: ₹1,950.
What are the current LTPs for Hero MotoCorp, Siemens, and Laurus Labs as per the MOFSL note?
Hero MotoCorp: ₹5,548; Siemens: ₹4,000; Laurus Labs: ₹1,850.
What are the recommended stop-loss levels for these stocks?
Hero MotoCorp: ₹5,380; Siemens: ₹3,880; Laurus Labs: ₹1,850.
When was the MOFSL note published and updated?
First Published: Aug 05, 2026, 7:37 AM IST; Last Updated: Aug 05, 2026, 7:38 AM IST.
Conclusion
The takeaway for the retail investor is simple: use chart-driven ideas as a way to structure risk and allocate capital more thoughtfully, rather than chasing headlines. The three MOFSL picks–Hero MotoCorp, Siemens, and Laurus Labs–offer a disciplined framework for identifying potential market leaders with clear price targets and defined stops. In the mini-market context of Aug 5, 2026, the Hero MotoCorp Share Price context hints at upside toward ₹5,880 if momentum holds, while Siemens and Laurus Labs provide complementary exposure with controlled risk. Treat these signals as a starting point for your own risk-managed playbook, not a guaranteed outcome.
Open your trading and demat account here
Reference :
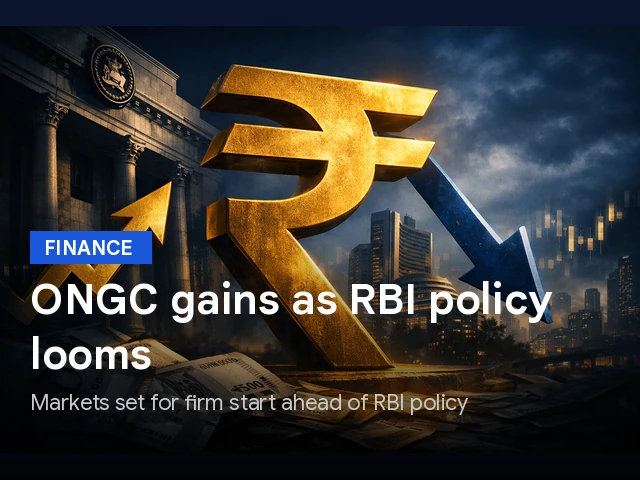
ONGC Share Price Outlook: RBI Policy Signals, Airtel Stock Moves, And Nykaa Stock Price Trends
Key Takeaways
- ONGC Share Price moves in step with RBI policy bets and oil dynamics.
- Airtel Stock and Nykaa Stock Price trends shape sector rotation and investor sentiment.
- LIC OFS oversubscription shows robust retail demand on opening day.
- Key corporate moves and listings add breadth to the market and offer new entry points.
The Indian stock market is poised for a firm start ahead of the Reserve Bank of India's monetary policy outcome, with the ONGC Share Price in focus as energy moves and macro cues drive sentiment. As of 7:37 AM, Gift Nifty futures traded 163.50 points higher at 24,743, a 0.67% gain that signals cautious optimism as investors await the policy decision. Global cues are painting a mixed but constructive picture: Japan's Nikkei 225 surged 3.34%, South Korea's Kospi added 4.2%, and Australia's S&P/ASX 200 rose 0.38%.
ONGC Share Price And RBI Policy Anticipations
As the RBI policy event draws near, market participants weigh how energy majors could react to macro shifts. The ONGC Share Price trajectory will stay tethered to crude oil dynamics and the evolving energy demand outlook. In company-specific terms, Oil and Natural Gas Corporation (ONGC) reported a standalone net profit of ₹17,034 crore for the first quarter of FY27, up 112% year over year. Such a robust earnings backdrop supports a constructive take on the sector, even as investors calibrate the degree of upside embedded in the share price. The Q1 jump highlights the resilience of upstream players in a high crude environment and provides a counterweight to broader cyclical volatility stemming from policy expectations.
On the global front, Brent crude eased 0.4% to around $79 per barrel, with Qatar saying mediators were making progress in efforts to end the US–Iran war. This development can be a moderating factor for oil volatility, which in turn influences ONGC’s valuation and the broader energy complex. The combination of a softer oil tone and solid domestic earnings creates a nuanced backdrop for the ONGC Share Price as traders position ahead of policy cues.
Beyond oil, global markets offered a stronger lead: the S&P 500 index ended 1.79% higher, the Dow Jones gained 1.71%, and the Nasdaq Composite jumped 2.59% on the day. Such breadth suggests that global risk appetite remains supportive, even as domestic policymakers weigh rate paths and liquidity implications. The net effect for the ONGC Share Price is a potential tilt toward consolidation within a defined band, pending clear policy guidance and oil-price direction. As always, investors should watch price action near key support levels and regime shifts that could accompany RBI announcements.
Meanwhile, LIC OFS is opening for retail investors with strong demand, underscoring a broader appetite for large cap exposures that can provide ballast when market breadth is uneven. The retail portion of the LIC OFS was oversubscribed 3.32 times on the opening day, signaling healthy interest from risk aware participants and lending credibility to the ongoing reform era in Indian capital markets. For ONGC shareholders and those tracking the energy angle, this dynamic matters because a wider market bid can lift sentiment across sectors, including energy plays that have historically shown sensitivity to macro shifts and policy cues.
Airtel Stock And Nykaa Stock Price Signals From The Market
In the telecom space, Bharti Airtel reported a consolidated net profit of ₹8,167 crore for Q1 FY27, marking a 37.3% year over year rise. However, the print missed Bloomberg consensus estimates, a reminder that even strong earnings can be interpreted through the lens of expectations and balance sheet discipline. For investors, the Airtel Stock narrative now hinges on the durability of high value customer momentum and the ability to monetize premium ARPU in a competitive environment. The result injects a degree of caution into the stock price trajectory, even as the underlying growth story remains intact in subscriber and service mix gains.
Meanwhile, Nykaa’s parent FSN E Commerce Ventures posted a 3.3 fold jump in net profit to ₹79.76 crore in the first quarter of FY27, up from ₹24.47 crore a year earlier. A strong profit beat or exceedance in consumer platforms often translates into stock price resilience, particularly when the top line is supported by expanding product categories and improving operating leverage. The Nykaa Stock Price trajectory, in this context, will likely hinge on how well the company translates revenue growth into sustainable earnings and how it navigates competitive pressure in beauty, fashion, and lifestyle segments.
MapmyIndia stock, operated by CE Info Systems, also posted a positive signal with Q1 consolidated profit rising to ₹49.7 crore, up 8.6% year over year. In the broader ecosystem, Marico reported a 25% rise in consolidated net profit to ₹630 crore for the June quarter, supported by topline growth and volume gains. HFCL’s board approved a fresh investment of approximately ₹400 crore to expand its optical fibre and optical fibre cable manufacturing capacities, while Zydus Life got USFDA approval for an ANDA allowing Indocyanine Green for Injection, which broadens its injectable and imaging product portfolio. Taken together, these actions feed into a mixed but constructive market tone for equities where earnings quality matters as much as headline numbers.
The week also featured Manipal Health Enterprises’ listing on Dalal Street, with the grey market signaling a flat debut. Such near term listing dynamics can influence market breadth and appetite for new issues, particularly when accompanied by strong institutional demand for other issues like LIC OFS. Investors should watch how new listings and secondary offerings interact with the existing stock mix to shape sector rotations and price discovery in the days ahead.
LIC OFS And Retail Demand Dynamics
The LIC OFS episode provides a real time test of domestic investor appetite for large, diversified blue chips. With the retail portion oversubscribed 3.32x on the opening day, retailers appear willing to participate in distributions that have historically been strong long term anchors. The implications for ONGC Share Price are indirect but meaningful: a robust retail bid can support broader market participation, which in turn can underpin more orderly price discovery across energy and value stocks. For risk management, consider how OFS outcomes interact with sector-specific catalysts–like crude price direction and policy commentary–before sizing exposure to energy names in a single session.
In parallel, Adani Infra (India) Ltd saw promoter group activity in the open market, with 12.48 crore shares sold for ₹2,627 crore at an average price of ₹210.50 apiece. Such large scale trades can inject volatility and shift liquidity profiles in related holdings and peers, underscoring the importance of price discipline and position management for retail investors considering exposure to the broader Adani ecosystem. The afternoon’s price leakage could also influence sentiment in infrastructure and embedded energy plays that closely track macro momentum and credit conditions.
Manipal Health IPO Listing And MapmyIndia Stock Moves
Manipal Health Enterprises is set to list on Dalal Street today, marking another milestone in a year of robust IPO activity. Early market chatter suggested a muted debut in the grey market, signaling a wait and watch stance among certain investors as the broader market digest the RBI policy trajectory. In contrast, MapmyIndia stock continued to attract attention due to CE Infosystems’ improved profitability and the growth trajectory of the geospatial tech sub segment. The combined effect is a more diversified market narrative where healthcare, tech, and consumer platforms contribute to a more resilient, but still selective, investment environment.
Nykaa’s earnings narrative complements the broader consumer and e commerce space, while Marico’s 25% profit growth adds a defensive tilt to the mix. HFCL’s ₹400 crore investment to expand its fibre manufacturing capacity signals continued infrastructure confidence in India’s digital backbone, and Zydus Life’s USFDA green light for Indocyanine Green strengthens its injectable and imaging product portfolio. Taken together, these company moves paint a picture of a market that rewards earnings growth and strategic capacity expansion, even as macro policy risk remains an overlay on daily trading decisions.
Oil Prices And Global Cues: What It Means For ONGC Share Price
The global energy complex remains a critical tempo setter for the ONGC Share Price. Brent crude’s retreat to around $79 per barrel, while modest, aligns with a softer macro impulse and easing risk appetite in some pockets. The ongoing progress toward de escalation in the US Iran context, reinforced by mediation efforts from Qatar, helps anchor oil volatility at lower levels than earlier in the year. For energy equities like ONGC, oil price stability supports steadier cash flows and a more predictable earnings trajectory, which can translate into steadier multiples and a more favorable price discovery environment in the near term.
On the domestic side, global indices provided a solid backdrop: the S&P 500 gained 1.79%, the Dow Jones rose 1.71%, and the Nasdaq Composite jumped 2.59%. Asian peers showed strength as well, with the Nikkei 225 up 3.34% and the Kospi up 4.2%. These cross market gains tend to improve risk appetite and can indirectly lift energy stocks, including ONGC, through positive sentiment spillovers and rotation into value names amid an uncertain policy framework.
Against this backdrop, energy stock selection should balance macro catalysts–policy trajectory, oil fundamentals, and international crude flows–with micro drivers–ONGC’s quarterly profit surge, cost controls, and capital expenditure trajectory. The ONGC Share Price is likely to respond more to policy clarity and oil price stability than to any single earnings beat in isolation, making it essential for investors to monitor both macro signals and the company’s ongoing execution in FY27.
Practical Steps For Retail Investors In The Current Phase
Given the confluence of RBI policy risk, earnings signals from leading banks and consumer names, and the energy price backdrop, here are practical steps retail investors can consider to navigate the current phase:
- Track the ONGC Share Price in relation to crude price and energy demand trends. Use price action near identified support and resistance levels to calibrate exposure and risk controls.
- Keep an eye on LIC OFS developments and retail demand indicators. A strong retail bid on OFS can broaden market breadth and reduce downside risk for large-cap energy stocks if appetite remains robust.
- In the Airtel Stock space, monitor premium customer growth, ARPU monetization, and any deviations from consensus that could affect the stock’s multiple. Nykaa Stock Price watchers should assess how the top line translates into sustainable profits given the margin trajectory in Q1 FY27.
- Watch Manipal Health Enterprises’ listing dynamics and the broader IPO/grey market signals as they can influence investor participation and risk tolerance for new issues.
- Consider diversification across energy, telecom, consumer, and tech exposure to reduce idiosyncratic risk while staying aligned with the macro policy path and earnings visibility.
For deeper, stock specific insights and a data driven research layer, consider Swastika's Sarthi AI stock assistant. Swastika's Sarthi AI stock assistant can help retail investors drill into price drivers, earnings quality, and risk controls for a more informed decision process during RBI policy events.
Related Reads
- ONGC Share Price And Oil Stock Trends: A Retail Investor Guide
- ONGC Share Price Outlook And Market Pulse: Marico Stock, Castrol India Stock In Focus
- Bharti Airtel Share Price Deep Dive: RBI MPC Outlook And Q1 FY27 Earnings Signals
Frequently Asked Questions
What is Gift Nifty futures level ahead of the RBI policy decision?
As of 7:37 AM, Gift Nifty futures traded at 24,743, up 163.50 points or 0.67%.
What was ONGC's standalone net profit in Q1 FY27?
ONGC reported a standalone net profit of ₹17,034 crore, up 112% year-over-year.
How did Airtel's Q1 FY27 results compare to consensus?
Airtel's consolidated net profit rose to ₹8,167 crore, up 37.3% YoY, but it missed Bloomberg consensus estimates.
What was the retail oversubscription rate for LIC OFS on the opening day?
Retail portion oversubscribed 3.32 times on the opening day.
Which Nykaa-related profit figure was reported in Q1 FY27?
FSN E-Commerce Ventures (Nykaa) posted net profit of ₹79.76 crore, up from ₹24.47 crore a year earlier.
What major promoter group sale occurred in Adani Infra (India) Ltd?
A promoter group entity sold 12.48 crore shares for ₹2,627 crore at an average price of ₹210.50 per share.
Conclusion
In the current RBI policy juncture, the ONGC Share Price sits at the nexus of macro cues and energy fundamentals. The strong quarterly earnings of ONGC and the supportive moves in global markets suggest a constructive setup for value oriented energy exposure, but we must respect the policy path and oil volatility as the defining risk. Retail investors should use a disciplined approach–watch key price levels, monitor LIC OFS signals, and balance energy bets with technology and consumer plays–to navigate the next few sessions with a clear risk framework. The next step is to establish a mental model around policy risk and oil price baselines, and to position with flexibility as new data arrives.
Open your trading and demat account here
Reference :

Nykaa Share Price Outlook After Q1 Results: Jefferies Vs Macquarie
Key Takeaways
- Nykaa Q1 results delivered 3.5x profit growth, 29% revenue increase, and EBITDA margin expanded to 8.5%.
- Jefferies lifts target to Rs 400 with Buy rating; Macquarie sets Rs 220 with Underperform as the gap widens.
- Nykaa share price trades around Rs 342.50, reflecting growth momentum and valuation questions.
- Beauty premiumisation, Nike partnership, and 50%+ fashion growth drive margin improvement and strategic momentum.
Investors tracking Nykaa share price have reason to stay engaged after Nykaa quarterly results delivered a mix of margin expansion and robust top-line growth. The EBITDA margin expanded by 200 basis points to 8.5% year-over-year, beating the Bloomberg consensus of 8.3%. Revenue rose 29% as the beauty and fashion segments continued to scale, while profitability improved as premiumisation deepened in beauty. The company posted profits that jumped nearly 3.5x, signaling stronger operating leverage as the business moves along the premiumisation path.
On the valuation side, Jefferies raised its price target to Rs 400 from Rs 350 and reaffirmed a Buy rating, arguing that Nykaa’s Q1 print was exceptionally strong across metrics, driven by higher AOV, steady user growth, and premiumisation in beauty. The fashion segment grew by more than 50% and achieved EBITDA break-even, while the House of Brands portfolio continues to scale, supporting faster delivery and broader reach. Jefferies noted that the valuation appears punchy but maintained that the growth and margin trajectory justify the premium, particularly as NSV (the company’s own beauty brands) gains share in the revenue mix.
Macquarie, however, retained an Underperform rating with a Rs 220 target, well below the current Rs 342.50 Nykaa share price. It acknowledged that Nykaa’s margins in beauty and fashion were in line with expectations, but highlighted the change in disclosure from GMV to NSV, which complicates the interpretation of growth pace. Macquarie did point to Nykaa Beauty’s healthy gross margin expansion, helped by the Nike partnership and a second straight EBITDA breakeven quarter. The caveat remains: Dot & Key brand scale constraints could cap EBITDA upside in consensus estimates.
Beyond the numbers, the quarter underscores strategic dynamics that could influence Nykaa stock NSE and the Nykaa share price in the near term. The Nike partnership adds ballast to the beauty unit’s margin mix and distribution, while premiumisation and channel expansion remain central to the growth narrative. The NSV reporting approach, however, requires investors to adjust their view of overall gross merchandise value to NSV, which complicates year-over-year growth comparisons. In short, the stock price reflects a balance between strong operating momentum and a valuation that remains a point of debate among research houses.
For retail investors seeking deeper, institutional-grade insight, Swastika offers Sarthi – an AI stock assistant that helps test price-target assumptions, run scenario analyses, and compare Nykaa share price against peers. Swastika's Sarthi AI stock assistant can help contextualize this quarter’s results with historical data, peer comparisons, and a framework for price target validation.
Nykaa Share Price Outlook After Q1 Results
The Nykaa share price has moved on a spectrum of optimism and caution. The company's Q1 performance demonstrates its ability to translate topline growth into meaningful margin improvement, reinforcing the argument for a premium multiple in the near term. The EBITDA margin expansion to 8.5% supports a scenario where a higher mix of premium beauty SKUs and the Nike partnership keep margins trending higher, even as cost pressures from delivery expansion remain a variable to track. With the current price near Rs 342.50, investors are weighing the path to sustained profitability against the risk of multiple adjustments as macro conditions evolve.
Nykaa Quarterly Results: What Jumped And What Remains Under Watch
Nykaa quarterly results highlight several key moves: a 29% revenue growth, a jump in profit by nearly 3.5x, and an EBITDA margin expansion of 200 bps to 8.5%. The beauty segment showed margin expansion driven by a better product mix and premiumisation, supported by Nike partnership data and channel expansion. The fashion segment grew more than 50% and reached EBITDA break-even, suggesting a turn in the profitability profile for this segment. At the same time, the reporting change to NSV for Nykaa's own beauty brands adds a new dimension to growth analysis, making it tougher to compare year-over-year GMV-based growth across segments. The 2nd consecutive EBITDA breakeven quarter in fashion underscores a structural improvement in operating leverage that could help Nykaa share price move higher if sustained.
Analyst Calls On Nykaa: Jefferies Vs Macquarie And The Price Targets
After the Q1 print, Jefferies raised its price target to Rs 400 with a Buy rating, citing a strong beat across metrics, premiumisation in beauty, higher AOV, and steady user growth. It highlighted a more than 50% growth in the fashion segment and EBITDA break-even in that segment, along with improvements in reach due to quick delivery. Jefferies warned that the valuation is punchy but argued that margin expansion and top-line momentum support a higher multiple. Macquarie, in contrast, retained an Underperform rating with a price target of Rs 220, well below the current Rs 342.50 Nykaa share price. The broker pointed to NSV reporting as making growth pace harder to track and flagged potential EBITDA headwinds from Dot & Key, even as it acknowledged Nykaa Beauty’s margin expansion and the Nike partnership as positives.
Growth Drivers: Nike Partnership And Brand Portfolio Driving Margin Mix
The Nike partnership has emerged as a meaningful driver of margin improvement in Nykaa’s beauty business, expanding distribution and improving the product mix in premium segments. The NSV approach for Nykaa's own beauty brands aligns with a strategy to increase brand-specific revenue while delivering margins from higher mix SKUs. The fashion segment’s EBITDA break-even and 50%+ growth reflect a broader shift toward profitability across the brand portfolio as quick delivery expands coverage and brand partnerships strengthen. Dot & Key remains a constraint in scale, and while its scale might present EBITDA headwinds in the near term, the overall margin trend remains favorable as Nike-enabled partnerships add scale and quality to the beauty ecosystem.
Nykaa Stock NSE: Trading Context And Valuation Considerations
Nykaa stock NSE listing trades at around Rs 342.50, a level that places it among high-multiple consumer-tech names given the growth trajectory and brand premium. The divergence in analyst price targets – Rs 400 from Jefferies and Rs 220 from Macquarie – underscores the uncertainty around how NSV-based reporting will evolve and how the beauty and fashion segments will deliver continued margin expansion. Investors should monitor the NSV mix, brand partnerships, and delivery scale as indicators of whether this valuation can be sustained. In a market where growth must justify premium valuations, Nykaa’s trajectory appears to hinge on sustained premiumisation, competitive brand positioning, and the ability to translate topline growth into durable free cash flow.
Risks And What It Means For Retail Investors
Retail investors should approach with a disciplined framework. While the Q1 print signals strong momentum, the path to sustained profitability remains conditional on the ability to scale brand partnerships and manage the mix between NSV growth and operating costs. NSV reporting can obscure year-over-year comparisons if GMV-based benchmarks are used by peers, requiring more careful modeling. Dot & Key’s scaling remains a potential constraint on EBITDA, even as Nike collaboration and premium beauty strategies create upside. The wide variance between analyst targets illustrates the risk of anchoring to a single number; scenario planning and risk budgeting are essential before committing capital to Nykaa share price exposure.
Frequently Asked Questions
What did Nykaa Q1 results show in terms of profitability and revenue?
Nykaa reported profit that jumped nearly 3.5x, with revenue rising 29% year over year, and EBITDA margin expanding by 200 basis points to 8.5%.
What are the Nykaa price targets set by Jefferies and Macquarie after Q1 results?
Jefferies raised its target price to Rs 400 with a Buy rating, while Macquarie set a target of Rs 220 with an Underperform rating.
What is the current Nykaa share price and how did it perform after Q1?
The stock traded around Rs 342.50, reflecting a premium valuation amid strong growth in beauty and fashion segments.
What are the key growth drivers highlighted in Nykaa's Q1 results?
Key drivers include premiumisation in beauty, higher average order value, steady user growth, a fashion segment with EBITDA break-even, and the Nike partnership improving margins.
What risks were flagged in Nykaa's Q1 update?
Risks include NSV reporting replacing GMV for Nykaa's beauty brands, possible Dot & Key scale constraints, and a valuation that remains debated among analysts.
Conclusion
Nykaa's Q1 results reveal a compelling growth and margin story anchored by premiumisation, a Nike partnership, and a momentum-driven fashion business. For the retail investor, the message is to balance the upside potential created by brand partnerships and higher AOV with a cautious view on NSV-based disclosure and brand-scale constraints. The next step is to apply a simple decision framework: consider multiple price-target scenarios, track quarterly margin progression, and assess the durability of the Nike-driven-margin uplift as the next couple of quarters unfold.
Open your trading and demat account here
Reference :
1 : Ndtvprofit

Ardee Industries Share Price: IPO Outlook And Lead Recycling Growth
Key Takeaways
- Ardee Industries Share Price momentum stays in focus as the price band sits at Rs 50-53 with 15% GMP.
- Fresh issue of 6.04 crore shares worth Rs 320 crore and OFS of 2 crore shares worth Rs 105.87 crore, totaling Rs 425.87 crore.
- Subscription window runs from August 5 to August 7, 2026, with allotment on August 10 and listing on August 12 on NSE and BSE.
- IPO proceeds earmarked for working capital (Rs 220 crore) and debt repayment (Rs 20 crore), with the balance for general corporate purposes (Rs 240 crore).
Ardee Industries Share Price momentum stands at the center of a debut that blends sustainability with manufacturing discipline. The IPO price band is Rs 50-53 per share, and the grey market premium sits at 15%, suggesting appetite if momentum holds through listing day. Founded in 1993, Ardee Industries Limited operates in the sustainable recovery and recycling of end-of-life energy storage products and non-ferrous scrap, turning waste into high-purity lead and specialized alloys such as lead calcium, lead antimony, lead tin, lead silver, and lead cadmium variants. Its product portfolio serves energy storage, electric mobility, automotive, and chemical sectors. The Tirupati facility spans 7.61 acres in Andhra Pradesh and has an installed production capacity of 104,025 MTPA. It is certified with ISO 9001:2015, ISO 14001:2015, and ISO 45001:2018, underscoring a structured approach to quality, environment, and safety.
The public issue comprises a fresh issue of 6.04 crore shares worth Rs 320 crore and an OFS of 2 crore shares valued at Rs 105.87 crore, taking the total IPO size to Rs 425.87 crore. The price band is Rs 50-53 per share and the IPO is currently trading with a 15% grey market premium over the upper band. The subscription window runs from August 5 to August 7, 2026, with the basis of allotment expected to be finalised on August 10 and listing likely on August 12, 2026 on NSE and BSE.
Ardee Industries Share Price: What The IPO Signals For Retail Investors
From the perspective of investors, the Ardee Industries Share Price path will be influenced by both the structural tailwinds of lead recycling and the near-term listing dynamics. The company aims to strengthen its balance sheet with IPO proceeds, while focusing on expansion in working capital and debt management. The business operates in a critical space–recycling end-of-life energy storage products and non-ferrous scrap, producing high-purity lead and specialized alloys that feed batteries, EVs, automotive, and chemical sectors. The Tirupati plant, located across approximately 7.61 acres, with capacity 104,025 MTPA, is supported by modern recycling infrastructure (rotary furnaces, refining kettles, casting systems) and robust pollution controls. The facility's ISO certifications (9001:2015, 14001:2015, 45001:2018) broadcast a commitment to quality, environment, and safety. The company has served more than 50 customers across domestic and international markets and exported products to seven countries including Singapore, Hong Kong, South Korea, Switzerland, United Arab Emirates, Japan, and the United States.
IPO Details: Fresh Issue, OFS, And Total Size
The public issue comprises a fresh issue of 6.04 crore shares worth Rs 320 crore and an OFS of 2 crore shares valued at Rs 105.87 crore, taking the total IPO size to Rs 425.87 crore. The price band is Rs 50-53 per share, and the grey market premium is 15%. The subscription window runs from August 5 to August 7, 2026, with the basis of allotment expected on August 10 and listing on August 12, 2026.
Use Of Proceeds: How The IPO Proceeds Will Strengthen The Balance Sheet
The proceeds from the Ardee Industries IPO will be directed towards strengthening the company’s balance sheet and supporting its expansion initiatives. Rs 220 crore will be deployed towards working capital requirements and Rs 20 crore towards repayment or pre-payment of select borrowings. The balance amount will be utilised for general corporate purposes, taking the overall utilisation of IPO proceeds to Rs 240 crore.
Company Profile: Growth In Lead Recycling And Capacity
Ardee Industries, founded in 1993, focuses on sustainable recovery and recycling of end-of-life energy storage products and non-ferrous scrap. The company manufactures high-purity lead and specialized lead alloys, including lead calcium, lead antimony, lead tin, lead silver, and lead cadmium variants. The Tirupati facility spans 7.61 acres in Andhra Pradesh and houses the 104,025 MTPA capacity, equipped with rotary furnaces, refining kettles, casting systems, and advanced pollution-control mechanisms. The site carries ISO 9001:2015, ISO 14001:2015, and ISO 45001:2018 certifications and exports to seven countries–Singapore, Hong Kong, South Korea, Switzerland, United Arab Emirates, Japan, and the United States–serving more than 50 domestic and international customers.
Financial Performance: Growth In Revenue And Profit
Robust growth defined FY2025-26: total income rose 57% to Rs 1,168.9 crore from Rs 743.5 crore the previous year, while Profit After Tax surged 155% to Rs 84.7 crore from Rs 33.3 crore in FY 2024-25. These numbers highlight improved scale and profitability as the company expands its recycling and lead-alloy manufacturing footprint.
Listing Outlook: GMP And Timelines And Global Footprint
The current grey market premium stands at 15% over the Rs 53 upper price band, reflecting early demand. The subscription window runs from August 5 to August 7, 2026; basis of allotment is expected on August 10; listing on August 12, 2026 on NSE and BSE. The company exports to seven countries and has over 50 customers, with a global footprint across Singapore, Hong Kong, South Korea, Switzerland, United Arab Emirates, Japan, and the United States.
Frequently Asked Questions
What is the price band for Ardee Industries IPO and when is it expected to list?
The IPO price band is Rs 50-53 per share, with listing expected on August 12, 2026.
What is the composition and total size of the Ardee Industries IPO?
The IPO comprises a fresh issue of 6.04 crore shares worth Rs 320 crore and an OFS of 2 crore shares valued at Rs 105.87 crore, taking total IPO size to Rs 425.87 crore.
What is the current grey market premium for the Ardee Industries IPO?
The IPO is currently commanding a 15% grey market premium (GMP) over its upper price band of Rs 53 per share.
How will the IPO proceeds be used by Ardee Industries?
Rs 220 crore will be used for working capital requirements, Rs 20 crore for repayment or pre-payment of select borrowings, and the balance for general corporate purposes, taking total IPO proceeds to Rs 240 crore.
What is Ardee Industries' business profile and growth story?
Ardee Industries operates in sustainable recovery and recycling of end-of-life energy storage products and non-ferrous scrap, manufacturing high-purity lead and specialized lead alloys for energy storage, EVs, automotive, and chemical sectors. It has a Tirupati facility of 7.61 acres with a capacity of 104,025 MTPA and ISO certifications (9001:2015, 14001:2015, 45001:2018); it exports to seven countries and serves over 50 customers.
What were the key FY2025-26 financial results for Ardee Industries?
FY2025-26 total income rose 57% to Rs 1,168.9 crore, while PAT grew 155% to Rs 84.7 crore from Rs 33.3 crore in the previous year.
Conclusion
From a retail investor standpoint, the Ardee Industries Share Price will be shaped by how demand (as reflected in a 15% GMP) converges with strong fundamentals–such as 57% revenue growth in FY2025-26 and a PAT of Rs 84.7 crore–driven by a modern 7.61-acre Tirupati plant with 104,025 MTPA capacity and a suite of ISO certifications. The Rs 240 crore of IPO proceeds earmarked for working capital and debt repayment, with Rs 220 crore dedicated to working capital, should be weighed against the cyclicality of metal margins and the company’s ability to sustain margin improvements post-listing. Next steps require a disciplined approach to risk and reward, using a clear investment thesis rather than chasing momentum alone.
For deeper, data-driven analysis, consider Swastika's Sarthi AI stock assistant: Swastika's Sarthi AI stock assistant.

Manipal Health Enterprises IPO: A Retail Investor's Guide To Its Debut And Implications
Key Takeaways
- Manipal Health Enterprises IPO features a fresh issue of Rs 8,000 crore and an OFS of Rs 1,275.22 crore, totaling Rs 9,275.22 crore.
- The public issue is priced in a Rs 560–590 per share band, with a subscription mix of 4.92x overall; QIBs at 8.25x, NIIs at 1.02x, and RIIs at 93% of their portion.
- Grey market premium stands at Rs 3, about 1% above the upper price band, implying a near-flat listing around Rs 593 per share though GMP is unofficial.
- Use of proceeds prioritizes debt repayment of Rs 5,378 crore and a minority stake acquisition in Sahyadri Hospitals, with the remainder for general corporate purposes.
Manipal Health Enterprises IPO: Retail Investor Journey From Prospectus To Listing
Manipal Health Enterprises IPO marks a milestone for a leading Indian hospital network seeking capital to strengthen its balance sheet and fund expansion across the country. The public issue comprises a fresh issue of 13.56 crore equity shares worth Rs 8,000 crore and an Offer for Sale (OFS) of 2.16 crore shares valued at Rs 1,275.22 crore, taking the total issue size to Rs 9,275.22 crore. The IPO opened for subscription from July 29 to July 31 and attracted robust demand, with an overall subscription of 4.92 times. QIBs subscribed 8.25 times, NIIs 1.02 times, while RIIs were subscribed at 93% of their allotted portion.
The scale of this listing underscores India’s increasingly robust healthcare infrastructure story, where private hospital chains are expanding to meet rising demand for tertiary and quaternary care. For the retail investor, the prospectus offers a transparent view into how a hospital operator uses capital, how the market values growth in healthcare services, and what milestones must be navigated as the business transitions from a private growth engine to a publicly-traded company. The numbers that frame this IPO–13.56 crore fresh shares and 2.16 crore OFS shares–define the liquidity and the dilution dynamics that investors should weigh before bidding.
Public Issue Structure: Fresh Issue Vs OFS
In total, the public issue comprises a fresh issue and an OFS. The fresh issue is 13.56 crore equity shares, aggregating Rs 8,000 crore in value. The OFS consists of 2.16 crore shares, valued at Rs 1,275.22 crore. Together, they culminate in a total issue size of Rs 9,275.22 crore. The IPO price band is Rs 560 to Rs 590 per share, and the offer is managed by Kotak Mahindra Capital as the book-running lead manager with KFin Technologies as the registrar. The subscription mix also reveals diverse demand: QIBs 8.25x, NIIs 1.02x, and RIIs at 93% of their portion, with an overall subscription of 4.92x.
| Component | Size/Value |
|---|---|
| Fresh Issue | 13.56 crore equity shares worth Rs 8,000 crore |
| Offer For Sale (OFS) | 2.16 crore shares valued at Rs 1,275.22 crore |
| Total Issue Size | Rs 9,275.22 crore |
| Price Band | Rs 560 – Rs 590 per share |
| Open Dates | July 29–31 |
| Lead Manager | Kotak Mahindra Capital |
| Registrar | KFin Technologies |
| Overall Subscriptions | 4.92x |
| QIB Subscriptions | 8.25x |
| NIIs Subscriptions | 1.02x |
| RIIs Subscriptions | 93% of their portion |
Grey Market Premium And Listing Outlook
Ahead of listing, the grey market premium (GMP) for Manipal Health Enterprises IPO is reported at Rs 3, implying a listing around Rs 593 per share, roughly in line with the upper end of the issue price band. While GMPs are widely watched as sentiment indicators, they are unofficial and unregulated, and investors should not rely on GMP alone. A disciplined approach compares the listing with fundamentals such as hospital network scale, cash flow generation, debt levels, and leverage. In this context, a near-flat or modestly positive listing could reflect a market that values steady cash flows from a diversified network of hospitals and clinics rather than speculative run-ups.
Investors should balance GMP signals with the company's long-run growth prospects, including expansion into new geographies, potential scale benefits, and the ability to sustain margins amid capital-intensive hospital operations. The performance of healthcare peers, regulatory developments, and macroeconomic factors–such as healthcare funding trends and insurance penetration–will also color how this IPO ultimately lands in the public markets. For those weighing entry, the Sarthi AI stock assistant can help translate these signals into an investment framework. Swastika's Sarthi AI stock assistant can provide institutional-quality analysis tailored to retail investors.
Company Profile And Operational Scale
Manipal Health Enterprises, founded in 2010, has grown into one of India’s leading healthcare providers with a broad network spanning hospitals, clinics, and diagnostic services. As of March 31, 2026, the company operates 49 hospitals with 13,037 licensed beds and 21 clinics across India. The organization employs more than 24,000 people, including over 11,000 nurses and 6,300 paramedics, reflecting its large-scale operations and the manpower required to deliver tertiary and quaternary care across specialties like oncology, cardiology, neurology, orthopaedics, organ transplantation, and preventive healthcare. The scale is complemented by ongoing investments in medical infrastructure and digital healthcare solutions, underscoring the healthcare sector’s evolving adoption of technology to improve patient outcomes and operational efficiency.
As one of India’s largest hospital operators, Manipal Health Enterprises has pursued growth through acquisitions and investments in medical infrastructure. This strategic direction aligns with a broader trend of consolidation in the private healthcare space, where scale can yield cost efficiencies and bargaining power with suppliers and insurers. The company’s footprint, coupled with its focus on high end specialties, positions it to potentially benefit from rising demand for quality tertiary care as incomes rise and insurance penetration expands across India.
Use Of Proceeds And Strategic Rationale
The IPO proceeds are earmarked primarily for strengthening the balance sheet and funding future growth. Specifically, Rs 5,378 crore is allocated for debt repayment, which could help lower borrowing costs and improve leverage metrics over time. An additional Rs 574 crore is planned to acquire a minority stake in its step-down subsidiary Sahyadri Hospitals, signaling a strategy to consolidate control and unlock value through targeted investments within the group. The remaining funds will be deployed for general corporate purposes and to support continued expansion, including potential new hospital openings, capacity upgrades, and digital service enhancements. This use-of-proceeds strategy reflects a measured approach to deleveraging while maintaining growth momentum in an industry characterized by capital intensity and long asset lifecycles.
Investor Takeaways And Risk Considerations
For retail investors, the Manipal Health Enterprises IPO presents a clear growth story anchored by a strong hospital network and diversified healthcare services. The company’s scale and the coordinated deployment of funds toward debt reduction and strategic acquisitions could translate into improved financial resilience and greater capacity to capitalize on demand for premium healthcare services. However, several risk factors merit attention: execution risk in securing regulatory approvals and completing expansion plans, sensitivity to macroeconomic cycles that affect patient admissions and insurance coverage, and inherent concentration risk given the hospital-centric model. It is essential to evaluate the pricing, the dilution impact from the fresh issue, and the post-listing valuation in the context of peers in the healthcare services space.
Retail investors should consider a disciplined approach to allocation, sizing, and risk management. Using a structured evaluation framework–covering business model, balance sheet strength, cash flow visibility, and governance quality–can help translate the IPO’s long-term potential into a more tangible investment thesis. If you need a guided, institution-level lens on this opportunity, Swastika’s Sarthi AI stock assistant offers tailored insights. Swastika's Sarthi AI stock assistant can help translate complex data into a practical investment plan.
Related Reads
- Manipal Health Enterprises IPO: Week Of The Largest Mainboard Debut And A Busy SME Lineup
- Manipal Health Enterprises IPO: A Retail Investor's Comprehensive Guide To The Rs 9,275 Crore Public Offering
- Manipal Health Enterprises IPO: A Deep Dive Into The Healthcare Giant's Listing Prospects
Frequently Asked Questions
What is the total size of the Manipal Health Enterprises IPO?
The total issue size is Rs 9,275.22 crore, comprising a fresh issue of 13.56 crore equity shares worth Rs 8,000 crore and an OFS of 2.16 crore shares valued at Rs 1,275.22 crore.
What is the split between fresh issue and OFS in Manipal Health Enterprises IPO?
The fresh issue is 13.56 crore equity shares worth Rs 8,000 crore, and the OFS comprises 2.16 crore shares valued at Rs 1,275.22 crore.
What is the current grey market premium for Manipal Health Enterprises IPO and what does it imply for listing?
The grey market premium is Rs 3, implying a listing around Rs 593 per share, though GMP is unofficial and should not be relied upon for investment decisions.
How will the proceeds of Manipal Health Enterprises IPO be used?
Rs 5,378 crore will be used for debt repayment, Rs 574 crore to acquire a minority stake in Sahyadri Hospitals (a step-down subsidiary), with the remaining funds for general corporate purposes and expansion.
What are the key operational metrics of Manipal Health Enterprises as of March 31, 2026?
The company operates 49 hospitals with 13,037 licensed beds and 21 clinics, employing over 24,000 people, including more than 11,000 nurses and 6,300 paramedics.
Who are the lead managers and registrar for the Manipal Health Enterprises IPO?
Kotak Mahindra Capital is the book-running lead manager, and KFin Technologies is the registrar.
Conclusion
The Manipal Health Enterprises IPO sits at the intersection of scale in private healthcare and disciplined capital allocation. For retail investors, the key takeaway is to weigh the growth potential of a leading hospital network against the cost of capital and the dilution inherent in a fresh issue. The use of proceeds–deleveraging with a meaningful debt repayment thrust, plus strategic minority investments–signals a commitment to strengthening balance sheet resilience while maintaining growth velocity. This combination could support a steady long-term earnings trajectory if expansion is executed with cost discipline and operational excellence.
Open your trading and demat account here
Reference :
1 : Economictimes

Affle India Share Price Breakout Ideas From HDFC Securities
Key Takeaways
- Affle India Share Price triggers a breakout with volume-backed momentum.
- Titagarh Stock has breached a downward trend line with bullish momentum.
- Nifty remains in an overall uptrend, with resistance near the 200-day SMA and support near the 200-day EMA.
- Retail investors can enter with defined risk using stop-loss and targets, and explore Swastika's Sarthi AI stock assistant for deeper insights.
Two breakout ideas from HDFC Securities grab the attention of retail investors navigating a market with pockets of volatility. The two names that stand out today are Titagarh Stock and Affle India Stock, both signaling breakout patterns underpinned by price action and rising volumes. The Affle India Share Price sits at ₹1,658, with a Buy call, a target of ₹1,745, and a stop-loss at ₹1,558. Titagarh is trading around ₹849, with a Buy recommendation, a target of ₹902, and a stop-loss of ₹800. On the chart, Affle India Stock has moved above the 200-day moving average with a noticeable jump in volumes, while Titagarh Stock has broken out from a downward-sloping trend line, reinforcing a bullish tilt. The broader market context is important too: the Nifty closed at 24,614, down 159 points, after a four-session winning streak. Despite profit-taking from higher levels, Nifty maintains an overall uptrend, trading above all key moving averages. Immediate resistance sits near 24,770, aligned with the 200-day SMA, while support comes in near 24,375, aligned with the 200-day EMA. Sectorally, Nifty Midcap 100 ended 0.29% lower, while Nifty Smallcap 100 rose 0.23%.
| Metric | Value |
|---|---|
| Nifty Close | 24,614 |
| Change | -159 |
| Resistance | 24,770 (200-day SMA) |
| Support | 24,375 (200-day EMA) |
| Nifty Midcap 100 | -0.29% |
| Nifty Smallcap 100 | +0.23% |
As a retail investor, framing these ideas around the two breakout candidates helps in setting a disciplined, risk-managed approach. The price action on Affle India Stock shows momentum that could carry through the buy zone if volumes sustain; Titagarh Stock, meanwhile, has confirmed a breakout by moving beyond a downward-sloping trend line with volume expansion on hourly charts. These signals come from a research view that the stock’s primary trend remains bullish, given that both names are trading above key moving averages while their volume patterns confirm the breakout moves. For readers of Swastika Investmart, these ideas align with a disciplined framework that combines price action with risk controls.
For deeper, institutional-level insights on any stock or index, consider using Swastika's Sarthi AI stock assistant. It’s designed to help retail investors validate breakout setups with data-driven context and trade ideas.
Affle India Share Price Breakout: The Setup In Focus
Affle India Stock is the breakout candidate that showcases a clear price action story. The stock price has surpassed the 200-day SMA, accompanied by a jump in volumes, signaling renewed bullish interest. The chart pattern features higher tops and higher bottoms on the short-term view, reinforcing the breakout narrative. Current conditions show the Affle India Share Price at ₹1,658 with a Buy recommendation and a target of ₹1,745; a stop-loss is placed at ₹1,558. This setup suggests a momentum-driven move that could extend if volume remains supportive and if the stock maintains price structure above the 200-day benchmark.
Technical texture matters: the breakout is reinforced by a notable volume spike, which helps validate the breakout as more than a mere short-term swing. If you’re a trader, you’d monitor the intraday volume profile and watch for follow-through candles in the next 1–2 sessions. In the broader sector backdrop, such moves often gain resonance when the market environment supports risk-on behavior, but individual stock patterns like Affle India Stock can act independently when the structure remains intact.
| Stock | LTP (₹) | Recommendation | Target (₹) | Stop-loss (₹) | Price Action | Trend | Volume Signal |
|---|---|---|---|---|---|---|---|
| Affle India | 1658 | Buy | 1745 | 1558 | Surpassed 200-day SMA | Higher tops & bottoms | Volume jump |
Affle India Stock price action suggests a momentum-driven breakout, with the 200-day SMA acting as a key hurdle that has now been breached on increased turnover. The combination of higher tops and higher bottoms across the short-term chart infused with volume expansion adds credibility to the breakout thesis. Retail traders might consider waiting for a follow-up close above near-term resistance before adding to exposure, and maintaining a disciplined stop-loss as the setup evolves.
Titagarh Stock Breakout: Chart, Volume And Trend
Titagarh Stock has broken out from a downward-sloping trend line on the daily chart, a classic technical signal that often accompanies a new up-leg. The stock price is at ₹849 with a Buy call, a target of ₹902, and a stop-loss of ₹800. The primary trend remains bullish as the stock has traded above key moving averages, reinforcing the notion that the breakout has underlying bullish support. The breakout move was accompanied by a jump in volumes on hourly charts, a sign that traders participated in the move and that the breakout could have sustained follow-through days ahead.
From a risk-management perspective, Titagarh Stock’s breakout should be watched for follow-through above the immediate resistance around ₹860–₹870. A close above this zone could signal the potential to test the ₹902 target, while a failure to hold the breakout could prompt a quick reevaluation and a tighter stop. As with all breakouts, the quality of the move hinges on volume consistency and the market’s broader context. This is one of the two breakout ideas highlighted by HDFC Securities as part of today’s stock picks for retail investors.
| Stock | LTP (₹) | Recommendation | Target (₹) | Stop-loss (₹) | Price Action | Trend | Volume Signal |
|---|---|---|---|---|---|---|---|
| Titagarh | 849 | Buy | 902 | 800 | Broken out from downward trend line | Bullish | Volume jump on hourly charts |
Notably, Titagarh’s setup benefits from the stock trading above moving averages, which is consistent with a bullish bias. The breakout confirms a bullish tilt and aligns with the stock’s longer-term trend. For investors, this presents a measured risk-reward opportunity, provided the breakout holds and volumes sustain. The price action here complements the Affle India breakout, adding balance to a two-stock idea set that HDFC Securities flagged for today’s session.
HDFC Securities Stock Picks: Titagarh And Affle India In Focus
HDFC Securities’ note highlights two breakout ideas in today’s market context: Titagarh Stock and Affle India Stock. Both names carry Buy recommendations and defined targets: Titagarh Target ₹902 with Stop-loss ₹800, and Affle India Target ₹1,745 with Stop-loss ₹1,558. The underlying rationale across both picks centers on breakout patterns supported by volume, with Affle India Stock breaking above the 200-day SMA and Titagarh Stock breaking out from a downtrend line. These signals are reinforced by the stocks’ ability to maintain bullish momentum and stay above key moving averages, even as the broader Nifty landscape remains nuanced near resistance levels.
Nifty Context And Market Levels On August 5, 2026
The market backdrop on this date shows the Nifty at 24,614, down 159 points from the prior session, under some intraday pressure but maintaining a broader uptrend by staying above major moving averages. Immediate resistance is placed near 24,770, a zone that coincides with the 200-day SMA, while support sits around 24,375, aligned with the 200-day EMA. Sectorally, the Nifty Midcap 100 closed 0.29% lower, while the Nifty Smallcap 100 gained 0.23%. This context matters because breakout ideas tend to perform best when the broader market environment supports risk-taking, particularly when the index trades above critical moving averages yet faces near-term resistance. The two stock picks, Titagarh and Affle India, gain extra resonance in this setting because they show name-specific breakout readiness even while the index wrestles with resistance.
Related Reads
- Nifty Share Price Outlook: Key Levels, Bearish Signals, And Opportunities Ahead
- Affle Share Price Momentum: ESOP Filing Sparks Early Trade For Retail Investors
Frequently Asked Questions
What are the two breakout ideas highlighted by HDFC Securities?
Titagarh Stock and Affle India Stock are the two breakout ideas; each has a Buy recommendation, with targets and stop-loss levels provided.
What are the target prices for Titagarh and Affle India?
Titagarh Target ₹902; Affle India Target ₹1,745.
What are the stop-loss levels for Titagarh and Affle India?
Titagarh Stop-loss ₹800; Affle India Stop-loss ₹1,558.
What is the Nifty status around this update?
Nifty closed at 24,614, down 159 points, with resistance near 24,770 and support near 24,375; the index remains in an overall uptrend.
Where can I get deeper stock research from Swastika?
You can use Swastika's Sarthi AI stock assistant for institutional-level research on any stock or index.
Conclusion
In today’s setup, the two breakout ideas from HDFC Securities–Titagarh Stock and Affle India Stock–offer a structured, risk-aware path for retail investors during a market that remains in an uptrend but faces resistance near key levels. Affle India Share Price has moved above the 200-day SMA with volume support, while Titagarh Stock has broken out of a downtrend line with rising hourly volumes. The Nifty context reinforces the need for disciplined risk management, but the combination of chart patterns, volume spikes, and defined targets creates two actionable opportunities for patient investors. The next step is to translate these ideas into ready-to-execute trades that align with your risk tolerance, with ongoing monitoring of price action and volume as the position develops.
Open your trading and demat account here
Reference :
Big Budget


Popular Articles





.avif)
.avif)

.avif)



START YOUR INVESTMENT JOURNEY
Get personalized advice from our experts
- Dedicated RM Support
- Smooth and Fast Trading App
