


Infosys Share Price: Trends, Dividend Insights, And Strategic Moves For Indian Retail Investors




Key Takeaways
- Infosys Share Price fluctuates with IT demand and quarterly results.
- Infosys Stock NSE data helps compare intraday moves across exchanges and regions.
- Infosys Price Today reflects macro trends and company fundamentals.
- Use Swastika's Sarthi AI stock assistant for deeper, institutional-grade insights.
What if the next move in Infosys Share Price reveals more about the IT industry than any earnings report alone? For retail investors in India, decoding the price action of Infosys stock is a practical way to translate macro signals into a decision to buy, hold, or wait. This isn't just about the number on the screen; it's a lens into the health of one of India's biggest IT service exporters and the global demand that powers it.
What Is Infosys Share Price And What Drives It
Infosys Share Price is the price at which Infosys Ltd. shares trade on Indian stock exchanges, notably the NSE and BSE. It moves in real time as buyers and sellers interact, and it is influenced by a blend of company performance, sector dynamics, currency movements, and broader market sentiment. A single price snapshot can be informative, but the longer-term signal comes from earnings growth, cash generation, and the company’s ability to translate those fundamentals into dividends, buybacks, or strategic investments. The stock’s momentum often follows the narrative around quarterly results and management commentary, but a rapid shift in valuation can occur if market participants re-price growth expectations or if macro conditions change. For retail investors, the key is to track both the price action and the underlying fundamentals–revenue growth, margin discipline, and cash flow quality–that determine sustainable value.
Infosys Stock NSE: How The Indian Exchange Affects Price Data
Infosys Stock NSE is the live feed that reflects all trades on India’s National Stock Exchange. The price you see on NSE is produced by intraday orders, liquidity, and the speed of information flow; prices on other exchanges (like BSE and global feeds) may diverge briefly due to timing, settlement, and liquidity differences. For a retail investor, monitoring the Infosys Stock NSE alongside other feeds can help you understand intraday volatility and liquidity, while also identifying gaps that may present short-term opportunities. The two exchanges together create a robust picture of demand for Infosys shares and can influence the timing of entry or exit decisions.


Infosys Price Today: Reading Real-Time Moves For Retail Investors
Infosys Price Today captures the intraday movement as traders react to news, results, and macro signals. When you look at today’s price, compare it with the previous close, the day’s high and low, and the 52-week range to gauge momentum and potential reversals. Remember that real-time price is just a moment in a broader narrative–longer-term investors should anchor decisions in fundamentals like revenue growth, profit margins, and free cash flow rather than chasing rapid intraday swings. Always cross-check price quotes with official exchange feeds and the company’s investor relations communications for accuracy and context. For investors who rely on technical analysis, price today can be supplemented with simple indicators such as moving averages, momentum oscillators, and volume spikes to spot potential trend changes.
Infosys Dividend: Yield, Stability, And Payout Strategy
Infosys Dividend represents the cash payouts the company makes to shareholders as a return on profits. The payout policy is set by the board and is influenced by cash flow, capital allocation priorities, and the overall financial health of the business. A stable or rising dividend can be a signal of confidence in the company’s ability to generate cash, while dividend cuts or delays may signal a need to preserve capital for growth or debt management. If you’re evaluating Infosys as a dividend investment, consider the consistency of payout history, the dividend yield, ex-dividend dates, and the policy trajectory for future distributions. Always verify the most recent dividend news from the company’s investor relations page. Investors often compare dividend yield against risk, growth opportunities, and the stock’s price to determine the overall total return potential.
Infosys Quarterly Results And Financials: What To Watch
Infosys Quarterly Results are a focal point for investors looking to validate growth expectations. Key metrics to monitor include revenue growth, operating margins, net profit, and cash flow. Management commentary on client wins, vertical mix, and investments in automation and efficiency can influence price behavior even before formal guidance is updated. While the numbers matter, the story of execution–how the company is delivering on its strategy–can be equally important for understanding how the stock might perform in the coming quarters. A disciplined investor will also track free cash flow generation, capital allocation decisions, and any commentary on currency exposures, as these can materially affect profitability in IT services firms like Infosys.
Putting It All Together: When To Buy Or Sell Infosys Stock
Decision making around Infosys stock should align with your investment horizon, risk tolerance, and a disciplined framework. A simple approach is to evaluate price relative to moving averages (for example, the 50-day and 200-day lines), watch for price action around established support and resistance levels, and weigh the impact of quarterly guidance and dividend expectations on valuations. If the stock breaks above a defined resistance with strong volume, some traders view that as a bullish signal; conversely, a break below support with high selling pressure can raise risk of further downside. Scenario thinking helps–what if results beat or miss expectations? What if currency moves shift profitability? Always maintain a clear risk management plan and avoid chasing momentum. To deepen your understanding, consider Swastika's Sarthi AI stock assistant for nuanced, data-driven insights into Infosys and its peers.
Related Reads
- Infosys Share Price Today: A Practical Guide For Retail Investors
- Infosys Share Price And Market Pulse: A Retail Investor's Guide
- Ashiss Kumar Dash To Become Infosys CEO: What It Means For The Infosys Share Price
Frequently Asked Questions
What is Infosys share price today?
Infosys share price today is the current price at which Infosys shares trade on the NSE and BSE. It changes throughout market hours as buyers and sellers transact, and for precise quotes you should check your trading platform or the official exchange feeds.
How did Vishal Sikka's resignation affect Infosys stock price?
Vishal Sikka resigned as Infosys CEO in August 2017. The stock experienced notable volatility around leadership changes and strategic shifts, with price movements reflecting investor reassessment until new leadership stabilized and the company clarified its strategy.
What is Infosys dividend?
Infosys dividend refers to the cash payouts the company makes to shareholders as a return on profits. The amount and timing are decided by the board and depend on cash flow, policy, and overall financial health; consult the latest dividend announcements for exact figures.
What should I watch in Infosys quarterly results?
Look for revenue growth, operating margins, net profit, and cash flow. Guidance for future quarters, client wins, vertical mix shifts, and efficiency initiatives also influence the stock's trajectory.
Where can I check Infosys stock price on NSE?
Infosys stock price on NSE is published on the National Stock Exchange's official feeds and your broker's trading platform. Prices may vary slightly across exchanges due to timing and liquidity.
Conclusion
For retail investors today, Infosys Share Price is not just a number–it is a signal about the pace of digital transformation, the health of the software services ecosystem, and the company’s ability to convert growth into cash returns for shareholders.
The practical takeaway is to pair price signals with fundamentals and to use a structured framework for entry, risk, and exit. By combining disciplined price analysis with dividend and quarterly results awareness, you can make more informed decisions about Infosys stock in an Indian market that rewards both patience and prudence.
Latest Articles
Infosys Share Price: Trends, Dividend Insights, And Strategic Moves For Indian Retail Investors


Key Takeaways
- Infosys Share Price fluctuates with IT demand and quarterly results.
- Infosys Stock NSE data helps compare intraday moves across exchanges and regions.
- Infosys Price Today reflects macro trends and company fundamentals.
- Use Swastika's Sarthi AI stock assistant for deeper, institutional-grade insights.
What if the next move in Infosys Share Price reveals more about the IT industry than any earnings report alone? For retail investors in India, decoding the price action of Infosys stock is a practical way to translate macro signals into a decision to buy, hold, or wait. This isn't just about the number on the screen; it's a lens into the health of one of India's biggest IT service exporters and the global demand that powers it.
What Is Infosys Share Price And What Drives It
Infosys Share Price is the price at which Infosys Ltd. shares trade on Indian stock exchanges, notably the NSE and BSE. It moves in real time as buyers and sellers interact, and it is influenced by a blend of company performance, sector dynamics, currency movements, and broader market sentiment. A single price snapshot can be informative, but the longer-term signal comes from earnings growth, cash generation, and the company’s ability to translate those fundamentals into dividends, buybacks, or strategic investments. The stock’s momentum often follows the narrative around quarterly results and management commentary, but a rapid shift in valuation can occur if market participants re-price growth expectations or if macro conditions change. For retail investors, the key is to track both the price action and the underlying fundamentals–revenue growth, margin discipline, and cash flow quality–that determine sustainable value.
Infosys Stock NSE: How The Indian Exchange Affects Price Data
Infosys Stock NSE is the live feed that reflects all trades on India’s National Stock Exchange. The price you see on NSE is produced by intraday orders, liquidity, and the speed of information flow; prices on other exchanges (like BSE and global feeds) may diverge briefly due to timing, settlement, and liquidity differences. For a retail investor, monitoring the Infosys Stock NSE alongside other feeds can help you understand intraday volatility and liquidity, while also identifying gaps that may present short-term opportunities. The two exchanges together create a robust picture of demand for Infosys shares and can influence the timing of entry or exit decisions.
Infosys Price Today: Reading Real-Time Moves For Retail Investors
Infosys Price Today captures the intraday movement as traders react to news, results, and macro signals. When you look at today’s price, compare it with the previous close, the day’s high and low, and the 52-week range to gauge momentum and potential reversals. Remember that real-time price is just a moment in a broader narrative–longer-term investors should anchor decisions in fundamentals like revenue growth, profit margins, and free cash flow rather than chasing rapid intraday swings. Always cross-check price quotes with official exchange feeds and the company’s investor relations communications for accuracy and context. For investors who rely on technical analysis, price today can be supplemented with simple indicators such as moving averages, momentum oscillators, and volume spikes to spot potential trend changes.
Infosys Dividend: Yield, Stability, And Payout Strategy
Infosys Dividend represents the cash payouts the company makes to shareholders as a return on profits. The payout policy is set by the board and is influenced by cash flow, capital allocation priorities, and the overall financial health of the business. A stable or rising dividend can be a signal of confidence in the company’s ability to generate cash, while dividend cuts or delays may signal a need to preserve capital for growth or debt management. If you’re evaluating Infosys as a dividend investment, consider the consistency of payout history, the dividend yield, ex-dividend dates, and the policy trajectory for future distributions. Always verify the most recent dividend news from the company’s investor relations page. Investors often compare dividend yield against risk, growth opportunities, and the stock’s price to determine the overall total return potential.
Infosys Quarterly Results And Financials: What To Watch
Infosys Quarterly Results are a focal point for investors looking to validate growth expectations. Key metrics to monitor include revenue growth, operating margins, net profit, and cash flow. Management commentary on client wins, vertical mix, and investments in automation and efficiency can influence price behavior even before formal guidance is updated. While the numbers matter, the story of execution–how the company is delivering on its strategy–can be equally important for understanding how the stock might perform in the coming quarters. A disciplined investor will also track free cash flow generation, capital allocation decisions, and any commentary on currency exposures, as these can materially affect profitability in IT services firms like Infosys.
Putting It All Together: When To Buy Or Sell Infosys Stock
Decision making around Infosys stock should align with your investment horizon, risk tolerance, and a disciplined framework. A simple approach is to evaluate price relative to moving averages (for example, the 50-day and 200-day lines), watch for price action around established support and resistance levels, and weigh the impact of quarterly guidance and dividend expectations on valuations. If the stock breaks above a defined resistance with strong volume, some traders view that as a bullish signal; conversely, a break below support with high selling pressure can raise risk of further downside. Scenario thinking helps–what if results beat or miss expectations? What if currency moves shift profitability? Always maintain a clear risk management plan and avoid chasing momentum. To deepen your understanding, consider Swastika's Sarthi AI stock assistant for nuanced, data-driven insights into Infosys and its peers.
Related Reads
- Infosys Share Price Today: A Practical Guide For Retail Investors
- Infosys Share Price And Market Pulse: A Retail Investor's Guide
- Ashiss Kumar Dash To Become Infosys CEO: What It Means For The Infosys Share Price
Frequently Asked Questions
What is Infosys share price today?
Infosys share price today is the current price at which Infosys shares trade on the NSE and BSE. It changes throughout market hours as buyers and sellers transact, and for precise quotes you should check your trading platform or the official exchange feeds.
How did Vishal Sikka's resignation affect Infosys stock price?
Vishal Sikka resigned as Infosys CEO in August 2017. The stock experienced notable volatility around leadership changes and strategic shifts, with price movements reflecting investor reassessment until new leadership stabilized and the company clarified its strategy.
What is Infosys dividend?
Infosys dividend refers to the cash payouts the company makes to shareholders as a return on profits. The amount and timing are decided by the board and depend on cash flow, policy, and overall financial health; consult the latest dividend announcements for exact figures.
What should I watch in Infosys quarterly results?
Look for revenue growth, operating margins, net profit, and cash flow. Guidance for future quarters, client wins, vertical mix shifts, and efficiency initiatives also influence the stock's trajectory.
Where can I check Infosys stock price on NSE?
Infosys stock price on NSE is published on the National Stock Exchange's official feeds and your broker's trading platform. Prices may vary slightly across exchanges due to timing and liquidity.
Conclusion
For retail investors today, Infosys Share Price is not just a number–it is a signal about the pace of digital transformation, the health of the software services ecosystem, and the company’s ability to convert growth into cash returns for shareholders.
The practical takeaway is to pair price signals with fundamentals and to use a structured framework for entry, risk, and exit. By combining disciplined price analysis with dividend and quarterly results awareness, you can make more informed decisions about Infosys stock in an Indian market that rewards both patience and prudence.
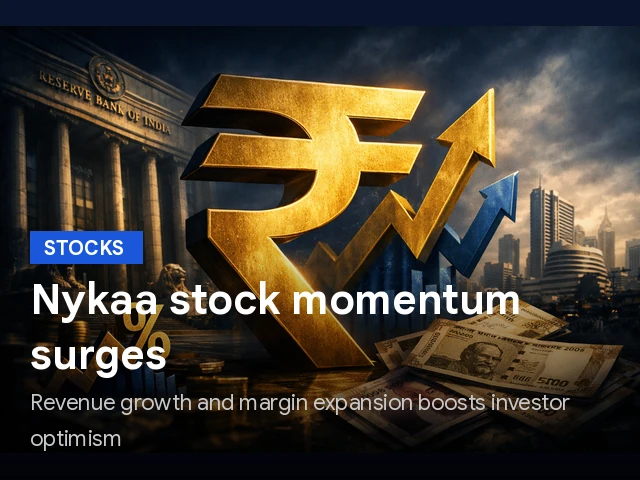
Nykaa Share Price Momentum After Q1 FY28: Growth, Margin Expansion, And Price Targets
Key Takeaways
- Nykaa’s Q1 FY28 revenue rose 29% YoY to Rs 2,782 crore and EBITDA climbed 68% to Rs 236 crore.
- EBITDA margin improved to 8.5% in Q1 FY28, the highest in the last 12 quarters.
- Analysts raised price targets, with Nomura at Rs 411 and Nuvama at Rs 414.
- Nykaa stock traded around Rs 342.50 on NSE, with 2026 gains and a market cap above Rs 98,088 crore.
Nykaa share price has become a focal point for retail investors after Nykaa reported a robust Q1 FY28. Revenue from operations rose over 29% YoY to Rs 2,782 crore, while EBITDA surged 68% YoY to Rs 236 crore during the quarter under review. Its EBITDA margin improved to 8.5% in the first quarter of the ongoing financial year, up from 6.5% reported in the corresponding period of FY26.
According to Falguni Nayar of Nykaa, "Q1 marked continued acceleration in the company’s growth momentum and EBITDA margins, both reaching their highest levels in the last 12 quarters. Our AI-led initiatives are beginning to create meaningful consumer experiences, with Virtual Closet already driving 2x higher conversion and AskNykaa, our conversational search engine, emerging as a trusted beauty advisor on the platform. We remain focused on building with discipline, innovation, and long-term value creation," she added.
Reference :
1 : Economictimes
The quarter’s results reinforce Nykaa’s multi-brand strategy, where premiumization, strong brand partnerships, and the expansion of own brands are beginning to translate into profitability. The management commentary underscores how AI-led features are shifting consumer experiences–from discovery to decision–helping convert higher-value orders and deepen engagement across beauty and personal care (BPC) and fashion segments.
Nykaa Share Price Momentum After A Strong Q1 FY28 Performance
The Q1 FY28 results signal a durable growth trajectory for Nykaa, as revenue growth and margin expansion combine with operating leverage. The company’s performance highlights the power of its Beauty and Personal Care moat–supported by 10,000+ brands, 324 stores across 105 cities, and a growing set of owned brands and partnerships. This momentum aligns with the expectation that premiumization and scale in the fashion and BPC categories will sustain profitability into FY28 and beyond.
Investors are tracking the stock's reaction in the context of a broader momentum play driven by premium offerings and omnichannel expansion. Nykaa’s post-market results release was followed by a near-term stock price movement; the stock closed nearly 1% lower at Rs 342.50 on NSE on the day of the report. The market has rewarded the growth narrative with a mix of near-term consolidation and longer-term upside potential, as reflected in multiple broker targets discussed below. In the meantime, Nykaa’s ongoing expansion plans–especially in tier 2 and tier 3 cities–remain central to its growth thesis and stock-price trajectory.
Nykaa Share Price Target: Analysts See Upside After Margin Expansion
Analysts are revisiting Nykaa’s valuation and the upside potential as margin levers gain traction. Nomura raised its Nykaa share price target to Rs 411 from Rs 343, signaling nearly 20% upside potential. The brokerage expects Nykaa to sustain its strong growth momentum with margin expansion driven by premiumization, increasing brand partnerships, scale-up of own brands, and an intensified physical expansion in tier 2 and 3 cities. Notably, Nomura also lifted its FY28 revenue estimates for Nykaa, with EBITDA margin guidance largely unchanged.
Nuvama Institutional Equities echoed the positive tone, lifting Nykaa’s target price to Rs 414 from Rs 351, about a 21% upside. The firm noted the BPC business remained steady while the Fashion segment delivered a standout quarter, with profitability improving in BPC and the Fashion segment approaching breakeven. These dynamics reinforce the case for a continued earnings-margin upgrade behind Nykaa’s evolving mix.
Motilal Oswal Financial Services joined the chorus by raising its target price to Rs 370 while maintaining a Neutral rating. The broker stressed that premiumization in beauty is playing out more intensely, and it projects Nykaa to reach around 5x consolidated EBITDA by FY30. This view is anchored by improving EBITDA margins in Fashion–expected to rise to about 10.1% from near zero today–and an improving BPC margin, supported by stronger ROCE and disciplined working capital management.
Beyond price targets, the brokerages highlighted Nykaa’s moat in Beauty and Personal Care–underpinned by 10,000+ brands, 324 stores across 105 cities, and a portfolio of strong owned brands and brand partnerships. They also pointed to Nykaa’s expanding Fashion vertical, with marquee collaborations such as Nike, H&M Move, and Birkenstock strengthening its long-term positioning.
As the market digests these upgrades, investors should watch how the AI-driven consumer experiences translate into real-world conversion gains and basket sizes. The company’s emphasis on premiumization, brand partnerships, and owned-brand development could become the primary engines for sustained EBITDA expansion, particularly if tier-2/3 expansion accelerates and the fashion segment achieves higher-margin growth.
Nykaa Market Cap: Valuation Snapshot After The Quarter
Nykaa’s market capitalization stands at more than Rs 98,088 crore, reflecting the market’s view of its growth potential and the earnings leverage from its expanding product mix. The size of Nykaa’s market cap, together with the improving margin profile, supports a narrative of earnings resilience even as the company continues to invest in brand-building and store growth. As the company broadens its footprint across India’s tier-2 and tier-3 cities, the long-term value proposition hinges on sustainable cash generation and the monetization of its digital and offline assets.
Nykaa Stock NSE: Trading Pattern And Liquidity Outlook
Nykaa stock is actively traded on the NSE, with price movements reflecting both quarterly results and evolving analyst sentiment. The stock’s performance in 2026 has been strong, with a 29% gain to date, following a 5% gain in a week and a 10% gain in a month. The current price context sits around Rs 342–343 per share, framing a valuation that is buoyed by Nykaa’s diversified business mix and the potential upside from margin improvements and brand partnerships. Investors should consider the stock’s liquidity as well as macroeconomic conditions affecting consumer discretionary names when evaluating entry or exit points.
Nykaa Growth Drivers: AI, Premiumization, And Tier-2/3 Expansion
The growth trajectory for Nykaa is anchored in its ability to convert premium consumer demand into sustainable profitability. AI-led features such as Virtual Closet and AskNykaa are designed to enhance discovery-to-purchase experiences, which could translate into higher average order values (AOVs) and higher conversion rates. The company’s focus on premiumization–bolstering high-margin Beauty offerings and strengthening brand partnerships–should support margin expansion as consumer wallets tilt toward premium products. In addition, a robust Tier-2/3 city expansion and the continued scaling of own brands could provide the operating leverage needed to propel EBITDA growth higher over the next few fiscal years.
Analysts have also highlighted the potential for Nykaa to deliver on a 5x consolidated EBITDA target by FY30, a central pillar of Motilal Oswal’s view. Such a milestone would imply meaningful margin progression across the Fashion and BPC segments, with a concurrent improvement in ROCE and working-capital efficiency. The combination of a broad brand ecosystem, deep assortment intelligence in Fashion, and a growing offline footprint positions Nykaa to sustain a multi-year growth narrative that supports the Nykaa share price over time.
Nykaa Q1 FY28 Revenue Growth And Margin Expansion: A Deep Dive
Nykaa’s Q1 FY28 results underscore a disciplined execution in a competitive consumer landscape. Revenue from operations rose 29% year-on-year to Rs 2,782 crore, while EBITDA jumped 68% YoY to Rs 236 crore. The EBITDA margin rose to 8.5% in Q1 FY28, up from 6.5% in the corresponding period of FY26, signaling meaningful margin expansion behind improved mix and operating leverage. Nykaa’s leadership attributes this improvement, in part, to AI-driven consumer experiences that are driving higher conversions and stronger engagement in both BPC and Fashion categories.
The quarterly performance aligns with the company’s strategic focus on premiumization and brand partnerships. The management commentary emphasizes long-term value creation and disciplined, innovative growth. The strategic emphasis on physical expansion in tier-2 and tier-3 cities, along with a strong portfolio of owned brands, is expected to support continued top-line growth and incremental margins as scale increases.
Related Reads
Frequently Asked Questions
What drove Nykaa's Q1 FY28 growth?
Nykaa's Q1 FY28 revenue rose 29% YoY to Rs 2,782 crore and EBITDA rose 68% YoY to Rs 236 crore, with EBITDA margins improving to 8.5% from 6.5% in the prior year period.
What is Nykaa's current market cap after the quarter?
Nykaa's market capitalization is more than Rs 98,088 crore.
Which analysts raised Nykaa share price targets and what are the levels?
Nomura raised its target to Rs 411, Nuvama raised to Rs 414, and Motilal Oswal raised to Rs 370; all indicating upside potential.
Where is Nykaa stock traded and what is its recent NSE price?
Nykaa shares closed around Rs 342.50 on NSE; the stock has shown notable movement with 5% weekly gains, 10% monthly gains, and 29% gains in 2026 so far.
What growth drivers are expected to support Nykaa's future profits?
Growth drivers include AI-led consumer experiences (e.g., Virtual Closet, AskNykaa), premiumization in Beauty, strong brand partnerships, expansion of own brands, and tier-2/3 city penetration alongside a growing Fashion vertical with marquee partnerships.
Conclusion
Nykaa’s Q1 FY28 performance signals a renewed growth trajectory underpinned by margin expansion and multi-brand expansion. For retail investors, the combination of revenue growth, margin resilience, and upgraded price targets from multiple global and domestic brokers points to a promising risk-reward dynamic for Nykaa share price in the near to medium term. As the company leverages AI-enabled consumer experiences and tier-2/3 expansion to drive both top-line growth and profitability, investors may consider a measured approach that weighs the upside potential against macro headwinds in consumer discretionary spaces.
For deeper stock research and a data-driven view, consider engaging Swastika's Sarthi AI stock assistant: Swastika's Sarthi AI stock assistant.

HDFC Bank Share Price Outlook As Bank Nifty Futures Rise Ahead Of RBI MPC
Key Takeaways
- Bank Nifty August futures rose 0.64% to 58,083.80, with open interest down 987 contracts to 70,610.
- HDFC Bank August futures fell 0.11% to Rs 742.85, with open interest up by 3,746 contracts to 465,508.
- Axis Bank August futures gained 0.74% to Rs 1,261.30; open interest slipped by 31 contracts to 128,822.
- 58,000 strike options dominate the setup, with calls concentrated at 58,000 and puts nearby ahead of the RBI decision.
In the run-up to the RBI's policy decision, retail traders are watching the Bank Nifty futures with heightened interest. The Bank Nifty's August futures rose 0.64% to 58,083.80, while open interest slipped by 987 contracts to 70,610, signaling short covering in the banking complex as participants position ahead of the policy outcome. The RBI is widely anticipated to keep the repo rate unchanged at 5.25%, with inflation still within the central bank's tolerance band of 2% to 6%. However, policymakers will closely assess whether elevated fuel costs could seep into broader prices, given energy markets remain under pressure from the Middle East conflict. For retail investors, a quick takeaway from today's session is how the HDFC Bank Share Price may respond to this macro environment, alongside price action in other large lenders.
Bank Nifty Futures Rise Ahead Of RBI MPC: Short Covering Signals In The Banking Pack
The session showed a broad-based move higher in Bank Nifty futures, with short covering observed across several banking heavies. Axis Bank's August futures rose 0.74% to Rs 1,261.30, while open interest slipped by 31 contracts to 128,822. Bank of Baroda also advanced, with August futures up 1.45% at Rs 250.21 and open interest down by eight contracts to 44,571. Bank of India joined the up-move, up 1.68% to Rs 142.60, with open interest falling by 115 contracts. Bandhan Bank followed suit, up 1.08% to Rs 175.12, as OI declined by 95 contracts. These moves point to a nuanced mix of fresh long positions and profit-taking in a sector navigating policy ambiguity.
HDFC Bank Share Price Context: What The Bank Nifty Move Signals For Retail Investors
HDFC Bank August futures dipped 0.11% to Rs 742.85, even as open interest expanded by 3,746 contracts to 465,508. This price-OI divergence suggests fresh long accumulation in HDFC Bank futures, potentially reflecting upbeat sentiment on near-term performance or policy-driven re-rating. While the article focuses on futures data, it’s common for retail investors to monitor the HDFC Bank Share Price movement as a sentiment gauge for the underlying stock, especially when macro catalysts loom. If you are weighing this for a trading idea, consider how the futures curve for HDFC Bank aligns with broader Bank Nifty dynamics and the RBI policy trajectory.
ICICI Bank Stock And The Bank Index: How The Sector Fares In This Setup
ICICI Bank's August futures rose 0.45% to Rs 1,452, with open interest at 148,542 contracts. This data point signals sustained interest in one of India’s largest private lenders, potentially drawing flow into the ICICI Bank Stock alongside Bank Nifty movements. In a macro backdrop where energy costs and inflation remain focal, ICICI Bank Stock performance may serve as a barometer for private-sector lenders’ resilience as traders position for RBI clarity. Retail investors should watch whether ICICI Bank stock strengthens in tandem with the index or diverges due to idiosyncratic news or earnings signals.
Bank Of Baroda Stock And Bandhan Bank Stock: Other Movers In The RBI MPC Window
Bank of Baroda’s August futures climbed 1.45% to Rs 250.21, with open interest down by eight contracts to 44,571. Bandhan Bank’s August contract rose 1.08% to Rs 175.12, while open interest declined by 95 contracts. These movements illustrate how different banks contribute to the overall sector narrative even as OI signals whether new positions are being established or existing bets unwound. For a retail trader, this is a reminder that strength in one lender does not automatically translate into broad-based gains across the entire HDFC Bank share price or ICICI Bank Stock, as sector leadership can rotate under policy uncertainty.
Kotak Mahindra Bank Stock And AU Small Finance Bank Stock: Sector Leaders In Focus
Kotak Mahindra Bank futures rose about 0.8% in the session, though the article does not publish the exact price, and AU Small Finance Bank stock moved higher with similar micro-movements noted in the broader market. The juxtaposition of these two names underscores the heterogeneity within the banking universe: Kotak Mahindra Bank Stock often tracks the premium banks’ risk-on moves, while AU Small Finance Bank stock can react differently to emerging market cues and liquidity conditions. Retail investors should keep an eye on price action and open interest for these names to gauge leadership shifts within the sector and potential implications for the HDFC Bank Share Price.
Axis Bank Futures Trends And The Broader Banking Sector: A Close Look
Axis Bank futures’ rise to Rs 1,261.30 (+0.74%) was accompanied by a fall in open interest by 31 contracts to 128,822, a tell that short-covering was taking place rather than a broad new long build across the sector. Bank of Baroda’s movement and Bank of India’s ascent (both in August futures) reinforce that the sector is oscillating between risk-on mood and cautious hedging ahead of policy signals. The resilience of the Bank Nifty amid inflation considerations and energy-cost risk suggests that the sector could remain range-bound until the RBI communicates its stance more clearly. For a retail investor, this means watching the relative strength of major banks and the direction of the HDFC Bank Share Price alongside the rest of the financials universe.
Options Positioning Around 58,000: What It Signals For Bank Nifty And The RBI Decision
Option positioning around the 58,000 strike is notable: the largest call open interest sits at 58,000, while put open interest is concentrated near the same strike. This setup designates 58,000 as a key zone ahead of the RBI decision, implying that traders expect limit upside near that level and are protecting against downside around this anchor. In addition, September contracts show higher open interest alongside a lower futures price, and October contracts record a 12.76% rise in open interest as futures declined, signaling evolving expectations across maturities. For investors, this framework means risk management around the 58,000 zone is prudent, and the Sarthi AI stock assistant can help translate such option signals into actionable ideas
For deeper stock-level insights and a strategic lens on your next move, explore Swastika's Sarthi AI stock assistant: Swastika's Sarthi AI stock assistant.
Related Reads
- HDFC Bank Share Price And The Market Valuation Erosion Of India's Top Firms: A Bear Week Deep Dive
- HDFC Bank Share Price And Banking Sector Signals For Retail Investors
- Sensex Share Price Momentum: July 28–30, 2026 Market Pulse And Stock Watch
Frequently Asked Questions
What is the latest Bank Nifty August futures price and open interest?
Bank Nifty August futures were at 58,083.80, up 0.64%, with open interest at 70,610 contracts (down 987).
What is the current HDFC Bank Share Price according to the article?
The article reports HDFC Bank August futures at Rs 742.85 with open interest at 465,508; it does not provide the spot HDFC Bank share price.
Which banks showed rising August futures and how did their open interest change?
Axis Bank rose 0.74% to Rs 1,261.30 with OI down 31 contracts to 128,822; Bank of Baroda rose 1.45% to Rs 250.21 with OI down 8 to 44,571; Bank of India rose 1.68% to Rs 142.60 with OI down 115; Bandhan Bank rose 1.08% to Rs 175.12 with OI down 95; ICICI Bank rose 0.45% to Rs 1,452 with OI at 148,542; HDFC Bank fell 0.11% with OI up by 3,746.
What does the 58,000 options zone indicate ahead of the RBI decision?
The largest call open interest sits at 58,000 and puts are concentrated near the same strike, marking 58,000 as a key zone ahead of the RBI decision.
What is the practical takeaway for retail investors from this data?
The data suggests short-covering in Bank Nifty and mixed bank-futures moves ahead of policy; inflation and energy-cost risk remain the main drivers, so hedging and monitoring 58,000 zone plus stock-specific signals (via tools like Swastika's Sarthi AI stock assistant) can aid decision-making.
Conclusion
In this RBI MPC window, retail investors should watch how the Bank Nifty and key lenders react to the evolving inflation picture and energy-cost risks. The 58,000 zone is a critical battleground for options positioning, with calls concentrated at the strike and puts nearby, signaling a cautious but not bearish stance on the sector. For HDFC Bank Share Price and other bank stocks, the near-term direction may hinge on policy signals and the market's read of inflation persistence, rather than any single data point.
Open your trading and demat account here
Reference :
1 : Ndtvprofit

Bharti Airtel Share Price And Earnings Pulse: Market Movers Across Q1 Results
Key Takeaways
- Bharti Airtel Share Price climbs as Q1 earnings rise 37.3% YoY and revenue grows 18.4%.
- ONGC's standalone profit jumps 112.3% with revenue up 45.2%, supported by higher crude realisations.
- Nykaa's consolidated profit hits ₹79.8 crore, up more than three times from a year earlier, with revenue up 29.1%.
- MCX, Marico, Deepak Nitrite and Kalyan Jewellers post double-digit growth while United Breweries sees profit decline.
Bharti Airtel Share Price moved in step with a torrent of quarterly numbers as the earnings season unfolds. Bharti Airtel reported a 37.3% YoY rise in consolidated net profit to ₹8,167.4 crore, from ₹5,947.9 crore a year earlier, while revenue rose 18.4% to ₹58,539.1 crore. EBITDA increased 19.3% to ₹33,599 crore, and EBITDA margin improved to 57.4% from 56.9%, with ARPU climbing to ₹264 from ₹250. These metrics set a constructive tone for the broader earnings-led rally across telecom, energy and consumer names.
Bharti Airtel Share Price In Focus As Q1 Earnings Roll In
Investors are laser-focused on the Bharti Airtel Share Price as the quarter’s numbers land. The reported 37.3% YoY profit growth and 18.4% revenue growth reinforce a positive trajectory, while margins remain robust at an EBITDA margin of 57.4%. The market is watching how this translates to free cash flow and the company’s ability to sustain subscriber economics, which in turn can influence near-term valuations and fund flow into telecom peers.
Beyond Bharti Airtel itself, the earnings batch includes several sector peers that help frame sector-wide momentum. ONGC, Nykaa, and others reported strong performances, offering a broader narrative about how commodity prices, consumer demand, and financial discipline are shaping equity risk premia in India.
| Company | Consolidated Profit YoY | Revenue YoY |
|---|---|---|
| Bharti Airtel | 37.3% | 18.4% |
| ONGC | 112.3% | 45.2% |
| Nykaa | More than 3x (to ₹79.8 crore) | 29.1% |
| Marico | 27.1% | 22.9% |
| Kalyan Jewellers | 32% | 45.7% |
| United Breweries | 9.6% | 7.1% |
| MCX | 103.5% | 88.1% |
| Sheela Foam | To be announced | ₹1,031.9 crore |
| Metropolis Healthcare | 25.7% | 16.6% |
| Deepak Nitrite | More than 3x (to ₹345 crore) | 36.4% |
| Deepak Nitrite | To be announced | ₹2,577.6 crore |
The breadth of strength across these results is evident from the backdrop of higher crude realisations, evolving consumer demand patterns, and disciplined cost management. The table above captures the momentum across profit and revenue lines, with some names delivering double-digit growth and others signaling margin resilience even as certain pockets show volatility.
ONGC Share Price Drivers: Crude Realisations And Profit Jump
The ONGC share price narrative in this earnings cycle is buoyed by a dramatic swing in profitability. The company posted a standalone profit rise of 112.3% to ₹17,034 crore, while revenue climbed 45.2% to ₹46,460 crore. A key driver was the crude oil realisation, which rose to ₹99.45 per barrel from ₹66.13 per barrel. This shift underscores how commodity pricing and product realisations feed directly into energy majors’ top lines and bottom-line expansion, translating into firmer cash generation and potentially balanced capex trajectories for the year ahead.
From an investor vantage point, the ONGC share price trajectory will likely respond to the sustainability of these realisations and the company’s ability tomanage costs in refining and marketing segments. The alignment between commodity prices, export demand, and domestic energy demand will continue to shape how domestic energy names behave through the next earnings cycle.
Nykaa Share Price Momentum As Consolidated Profit Surges
Nykaa, the FSN E-Commerce Ventures ticker, drew attention as its consolidated profit surged to ₹79.8 crore–more than three times the ₹24.5 crore logged a year earlier. Revenue climbed 29.1% to ₹2,782 crore, underscoring healthy top-line expansion as consumer spend regained momentum in beauty, fashion and lifestyle categories. The company also announced the acquisition of a 51% stake in Aminu Wellness for ₹32 crore, signaling an aggressive expansion strategy that could influence Nykaa share price dynamics in the near term.
Marico Share Price Outlook After Revenue Growth
Marico’s earnings narrative showed a robust blend of profit and revenue growth. Consolidated profit rose 27.1% to ₹652 crore, while revenue increased 22.9% to ₹3,957 crore. This combination supports a positive view on the Marico share price as the company continues to leverage its portfolio strength across staples and value-added products. The consumer pack growth narratives, aided by pricing discipline and cost controls, help maintain a steady earnings trajectory into the next quarter.
Kalyan Jewellers Share Price Growth With Profit And Revenue Gains
Kalyan Jewellers posted a consolidated profit growth of 32% to ₹348.7 crore, while revenue climbed 45.7% year-on-year to ₹10,588.9 crore. The strong earnings cadence aligns with a buoyant demand backdrop in key jewelry categories as festive demand and new store openings bolster the revenue base. Investors watching the Kalyan Jewellers share price will weigh these results against the competitive landscape and seasonality effects in the upcoming quarters.
MCX Share Price And Profit Growth
Multi Commodity Exchange of India (MCX) demonstrated standout bottom-line momentum, with consolidated profit rising 103.5% to ₹413.4 crore and revenue increasing 88.1% to ₹702 crore. This performance highlights the resilience of the exchange ecosystem amid shifting commodity cycles and volatility in derivative volumes. The MCX share price could respond to sustained growth in volumes and improved operating leverage as risk management activity remains a core driver of futures and options markets in India.
Deepak Nitrite Share Price Surge On Profit Rise
Deepak Nitrite reported a more-than-three-fold rise in consolidated profit to ₹345 crore, with revenue up 36.4% to ₹2,577.6 crore. The strong earnings momentum reflects continued demand for chemical intermediates and an expanding product portfolio as the firm capitalizes on specialty chemical demand across industries. The Deepak Nitrite share price could receive a boost if this growth translates into healthy cash generation and margin expansion through the year.
Metropolis Healthcare Share Price Climbs On Profit And Revenue
Metropolis Healthcare delivered a solid quarter, with consolidated profit up 25.7% to ₹56.9 crore and revenue up 16.6% to ₹450.2 crore. The diagnostic and pathology services segment continues to scale, driven by rising test volumes and the offsetting effect of prudent cost management. Investors looking at the Metropolis Healthcare share price will assess how sustainable the growth tempo remains as payer mix and utilization patterns evolve in the next six months.
Sheela Foam Share Price Jump As Profit Growth Mirrors Revenue Expansion
Sheela Foam reported a strong uplift in profitability, posting consolidated profit of ₹61.4 crore versus ₹6.5 crore in the year-ago period, while revenue rose to ₹1,031.9 crore. The dramatic leap in profits signals improving operating leverage and potential pricing or mix shifts in the foam and insulation segments. The Sheela Foam share price may reflect this earnings momentum as investors compare margins against raw-material and energy cost trends.
United Breweries Share Price Movement Amid Profit Decline
United Breweries saw a 9.6% decline in consolidated profit to ₹166.3 crore, even as revenue rose 7.1% to ₹3,067 crore. This juxtaposition highlights margin pressures or one-off costs that investors will scrutinize. The United Breweries share price, in this context, will likely hinge on how the company manages input costs and macroeconomic headwinds in the coming quarters.
BSE Share Price And Strategic Stake Move
BSE reported a 62% increase in consolidated profit to ₹874 crore and announced plans to raise its stake in India International Bullion Holding IFSC from 3.33% to 20%. The earnings strength and strategic stake move may provide additional liquidity and visibility for the exchange operator, potentially influencing the BSE share price as market participants reassess growth and monetization opportunities in listed derivatives and bullion markets.
NHPC, Bharti Hexacom, PNB Housing Finance And Sanofi India: A Growth Round
Several other listed names–NHPC, Bharti Hexacom, PNB Housing Finance and Sanofi India–also reported year-on-year growth in profit and revenue, signaling broad earnings resilience across sectors. The breadth of positive results adds to the narrative that earnings-led trading could stay constructive across diversified indices and thematic baskets.
For investors seeking deeper, AI-powered stock analysis, Swastika offers a range of tools to help you model scenarios and build robust watchlists. Explore Swastika’s Swastika's Sarthi AI stock assistant for institutional-level insights tailored to retail investors.
Related Reads
- Bharti Airtel Share Price And Free OTT Platforms In India: A Retail Investor's Guide
- Bharti Airtel Share Price Today: Q1FY27 Results, Revenue Growth, And Near-Term Outlook
- Bharti Airtel Share Price Deep Dive: RBI MPC Outlook And Q1 FY27 Earnings Signals
Frequently Asked Questions
What drove Bharti Airtel Share Price higher after Q1 earnings?
Bharti Airtel posted a 37.3% YoY rise in consolidated profit to ₹8,167.4 crore and a revenue rise of 18.4% to ₹58,539.1 crore, with EBITDA up 19.3% to ₹33,599 crore and an EBITDA margin of 57.4%, supporting a firmer Bharti Airtel Share Price.
Which company posted the highest YoY profit growth in the batch?
ONGC reported the largest YoY jump, with standalone profit rising 112.3% to ₹17,034 crore and revenue up 45.2% to ₹46,460 crore, aided by crude price realisations.
What were Nykaa's latest earnings signals?
Nykaa reported consolidated profit of ₹79.8 crore, more than three times the ₹24.5 crore in the year-ago quarter, with revenue up 29.1% to ₹2,782 crore and a ₹32 crore stake acquisition in Aminu Wellness.
Which other stocks posted strong profit growth alongside Bharti Airtel?
MCX posted a 103.5% rise in consolidated profit to ₹413.4 crore with revenue up 88.1% to ₹702 crore, while Marico grew profit by 27.1% to ₹652 crore and revenue by 22.9% to ₹3,957 crore. Deepak Nitrite delivered profit growth of more than three-fold to ₹345 crore with revenue up 36.4% to ₹2,577.6 crore, and Kalyan Jewellers saw a 32% rise in profit to ₹348.7 crore with revenue up 45.7% to ₹10,588.9 crore.
Which company showed a profit decline despite revenue growth?
United Breweries posted a 9.6% decline in profit to ₹166.3 crore even as revenue rose 7.1% to ₹3,067 crore.
Where can I access Swastika's AI stock analysis tool mentioned in the article?
You can access Swastika's Sarthi AI stock assistant via the link provided in the article: Swastika's Sarthi AI stock assistant.
Conclusion
The earnings wave reinforces a market where profit growth and margin resilience are reconfirming the framework for equity valuations across telecom, energy, consumer and industrials. The Bharti Airtel Share Price, in particular, stands as a barometer of how well an operating business translates earnings into cash flow and sustainable returns for shareholders. As a retail investor, you should look for consistent free cash flow generation, margin stability and disciplined capital allocation when evaluating this cohort of names.

Bharti Airtel Share Price Insights: Q1 Earnings, ARPU Growth, And Quarterly Results
Key Takeaways
- Bharti Airtel Share Price momentum strengthened after a robust Q1 earnings print.
- Q1 earnings rose 37.3% to Rs 8,167.4 crore, and revenue rose 18.4% to Rs 58,539 crore.
- ARPU grew to Rs 264 from Rs 250 year over year, signaling stronger monetization.
- The stock closed 0.3% higher at Rs 1,956.5 on the BSE; watch tariff strategy and Africa growth.
In this quarter's scoreboard, Bharti Airtel Share Price becomes a barometer for India's telecom rebound. The latest Q1 earnings release shows profits rising 37.3% to Rs 8,167.4 crore, up from Rs 5,947.4 crore in the year-ago period, supported by tariff-led monetization, stronger subscriber additions, and robust growth across its India and Africa businesses. Revenue rose 18.4% to Rs 58,539 crore from Rs 49,462.6 crore in the same period last year. The ARPU increased to Rs 264 from Rs 250 a year ago, signaling healthier monetization per user.
For retail investors, these numbers translate into a more resilient earnings trajectory and a stock price that reflects improving fundamentals. The quarter reinforces Bharti Airtel's position as a growth engine among Indian telecoms, powered by tariff-driven ARPU expansion and a broadening revenue base. In addition to higher tariffs, the mix shift toward higher-quality data offerings and subscriber additions boosted both top-line and profitability.
Bharti Airtel's earnings release attributes the beat to higher mobile tariffs, robust subscriber additions, and strong growth across its India and Africa businesses. The ARPU uplift reflects how price/mix changes are translating into better per-user revenue, a key driver of sustained profitability as the company scales its data offerings and 4G/5G services across major markets.
For deeper, institutional-level stock research, explore Swastika's Sarthi AI stock assistant.
Bharti Airtel Share Price Momentum After Q1 Earnings Beat
The Q1 earnings print positions Bharti Airtel for a continued price momentum, with profits up 37.3% to Rs 8,167.4 crore and revenue up 18.4% to Rs 58,539 crore. The ARPU lift to Rs 264 from Rs 250 a year ago demonstrates improved monetization across its mobile user base, aided by tariff hikes and higher-quality data offerings. The equity market rewarded the news with Bharti Airtel share price closing 0.3% higher at Rs 1,956.5 on the BSE in the session.
Investors should watch how tariff policy and the pace of subscriber additions translate into sustained earnings growth, especially as Bharti Airtel continues to expand 4G/5G coverage and deepen its footprint in Africa. The improvement in ARPU provides a crucial cushion against cost pressures and acts as a lever for future margins.
Bharti Airtel Stock Price Trends: How Q1 Earnings Shape Valuation
The Bharti Airtel stock price dynamic tends to reflect the company’s core profitability and monetization trends. With Q1 earnings growth underpinning the revenue expansion, the stock’s valuation read-through will depend on how investors price tariff sustainability, data monetization, and regional growth. The 37.3% uplift in quarterly profit and 18.4% revenue growth are the types of numbers that can support multiple expansion if the company maintains market-share gains and stabilizes ARPU growth.
In assessing risk, investors should consider regulatory changes, competitive intensity, and currency dynamics in Africa. Yet the reported ARPU growth signals a resilient monetization model that can help the stock price sustain its momentum even in volatile markets.
Bharti Airtel Earnings: What The Q1 Beat Means For Growth
The earnings beat underscores Bharti Airtel’s ability to convert price increases into real profit growth. A 37.3% rise in quarterly profit to Rs 8,167.4 crore, paired with an 18.4% jump in revenue to Rs 58,539 crore, points to a healthy growth engine. ARPU’s ascent to Rs 264 from Rs 250 highlights ongoing monetization improvement that supports margin expansion as the company continues to scale data services and 4G/5G deployment across key markets.
The quarterly results also reflect the strength of Bharti Airtel's diversified portfolio, with growth across both its India and Africa footprints contributing to the top-line and bottom-line performance.
Bharti Airtel Quarterly Results: Revenue, ARPU, And Subscriber Growth
From a numbers perspective, the quarter delivered a robust revenue trajectory and a clear ARPU uplift. Revenue rose 18.4% to Rs 58,539 crore, while the profit jump of 37.3% to Rs 8,167.4 crore was driven by the same drivers–tariff hikes and growing subscriber additions. ARPU reached Rs 264, marking an important improvement in monetization per user and supporting a more favorable margin profile as data usage expands and digital services scale.
These quarterly results reinforce Bharti Airtel’s position as a telecommunications growth leader in India and an expanding presence in Africa. The combination of price discipline, service quality improvements, and geographic diversification is central to sustaining earnings momentum into the next quarters.
Bharti Airtel ARPU Growth: What It Means For Investors
ARPU growth is a crucial indicator of how effectively Bharti Airtel is monetizing its expanding user base. The rise to Rs 264 from Rs 250 year over year suggests that tariff increases and product mix improvements are translating into higher per-user revenue. For investors, this means stronger potential for cash flows and the ability to reinvest in network expansion and digital services, which can support further earnings expansion in the coming quarters.
As ARPU growth sustains, the company can maintain healthy margins even as it navigates competition and regulatory dynamics. This is a key variable for the Bharti Airtel stock price trajectory and its ability to deliver shareholder value over time.
What Retail Investors Should Watch Next
Looking ahead, retail investors should monitor tariff strategies and the pace of 4G/5G rollout, particularly in markets where Airtel has a meaningful footprint. Africa’s growth trajectory will also matter, given its contribution to revenue and earnings–any shifts could alter the earnings trajectory and, by extension, the Bharti Airtel share price dynamics. Regulatory developments that impact ARPU and subscriber growth are another risk factor to monitor.
In practice, investors can use a scenario-based approach: base-case assumes tariff-driven ARPU growth persists while subscriber additions decelerate modestly; bull-case assumes stronger data monetization and faster 4G/5G expansion; bear-case considers regulatory headwinds or increased competition. Tools like Swastika's Sarthi AI stock assistant can help you model and compare scenarios based on live data and your risk tolerance.
Related Reads
- Bharti Airtel Share Price Today: Q1FY27 Results, Revenue Growth, And Near-Term Outlook
- Bharti Airtel Share Price And Free OTT Platforms In India: A Retail Investor's Guide
- Bharti Airtel Share Price Deep Dive: RBI MPC Outlook And Q1 FY27 Earnings Signals
Frequently Asked Questions
What were Bharti Airtel's Q1 earnings and revenue?
Q1 earnings rose to Rs 8,167.4 crore, up 37.3% year over year, with revenue of Rs 58,539 crore, up 18.4%.
How did Bharti Airtel's ARPU perform in Q1?
ARPU rose to Rs 264 from Rs 250 a year ago.
What was Bharti Airtel's share price movement after the Q1 results?
Bharti Airtel share price closed 0.3% higher at Rs 1,956.5 on the BSE.
What factors drove Bharti Airtel's Q1 earnings growth?
Higher mobile tariffs, strong subscriber additions, and growth across India and Africa supported earnings.
What should retail investors watch next for Bharti Airtel?
Tariff strategies, pace of 4G/5G rollout, and growth in Africa, as well as any regulatory developments that could impact ARPU and subscriber trends.
Conclusion
The quarter’s earnings strength–driven by tariff-led ARPU growth and subscriber expansion across India and Africa–signals a reinforced growth narrative for Bharti Airtel. For retail investors, the Bharti Airtel share price is tethered to a monetization cycle that has started to demonstrate durability, even as the market remains attentive to tariff trajectories and regional expansion. The next steps are to watch ARPU sustainability, the pace of 4G/5G deployment, and Africa’s trajectory, while considering the potential for multiple expansion if the growth path remains intact.
Open your trading and demat account here
Reference :
1 : Reuters

M&M Share Price And 2026 Long-Term Stocks: Five Picks With 10-20% Upside
Key Takeaways
- Five stocks including M&M, Exide, UPL, Persistent Systems and Glenmark offer 10-20% upside in 2026.
- M&M share price is around Rs 3385 with a target of Rs 4370 (up to 29% upside).
- Exide Industries stock price is around Rs 444; Target Rs 510; Upside 14%.
- UPL stock price is around Rs 625; Target Rs 710; Upside 13%.
Investors chasing the M&M share price around Rs 3385 might wonder if a broad, long-term move is in play. The answer lies in a set of five stocks that top brokerages flag as potential 10-20% upside in 2026. Across autos, pharmaceuticals, IT, chemicals and batteries, these picks create a diversified basket for retail investors aiming for compound growth with measured risk.
M&AmpM Share Price Momentum And 2026 Upside
The M&M stock has attracted attention from top brokerages, reflecting a balance between cyclicality and defensiveness. Morgan Stanley on M&M has an Overweight stance with a target of Rs 4370 and a current price (LTP) of around Rs 3385, implying a potential upside of roughly 29%. While price action can be choppy in the near term, the broker highlights a multiyear earnings trajectory and improving margins as key drivers for a re-rating over the coming years.
For the retail investor, the essence is to focus on the long horizon rather than daily ticks. The M&M share price today sits near a level that could serve as an anchor for a diversified portfolio, particularly when paired with other names in the list that offer similar upside potential. The takeaway is to calibrate your exposure based on risk appetite and the time you can devote to monitoring earnings momentum and macro cycles.
| Stock | LTP (Rs) | Target (Rs) | Upside |
|---|---|---|---|
| M&M | 3385 | 4370 | 29% |
| Exide Industries | 444 | 510 | 14% |
| UPL | 625 | 710 | 13% |
| Persistent Systems | 5575 | 6400 | 15% |
| Glenmark Pharma | 2230 | 2570 | 15% |
From a practical investment angle, the data above juxtaposes where the stocks are trading today (LTP) with where brokerages expect them to be (Targets). The M&M share price movement is part of a broader narrative: earnings growth, product mix optimization, and capital allocation efficiency can unlock the upside indicated by these targets. The table above also reframes the same thesis for Exide Industries stock, UPL stock price, and the other two names in a cohesive manner. For a retail investor, this strengthens the case for a measured, rules-based approach to building a six- to twelve-month position in each name.
Exide Industries Stock Price Trends And Brokerage Targets
Exide Industries stock price around Rs 444 sits at a pivotal level where a shift in energy storage demand could propel the stock higher. Citi has assigned a Buy rating to Exide Industries stock with a target price of Rs 510, implying a potential upside of about 14%. The Exide Industries share price movements are influenced by battery demand, cyclicality in auto components, and raw material costs, which add a layer of complexity for investors to model into the upside scenario.
Retail investors should view Exide not only as a battery producer but as a play on the energy storage ecosystem in India–encompassing e-mobility, grid storage, and consumer electronics where demand is generically resilient. If the Exide stock price edge moves toward its Rs 510 target, a re-rating could occur as margins stabilize and the company executes its expansion plan. The key is maintaining awareness of policy shifts and supply dynamics that shape the pace of growth in this sector.
UPL Stock Price Outlook And Target Analysis For 2026
UPL stock price hovers around Rs 625 and is paired with a target of Rs 710 from Equirus Securities Ltd, which assigns a Long rating and a 13% upside. The UPL stock price trajectory is anchored by a diversified crop protection portfolio, strong global presence, and a steady stream of earnings growth. The 710 target envisions continued margin improvement and a favorable product mix that supports higher profitability over the medium term.
Investors should monitor macro agri-cycle indicators, currency movements, and raw material costs, all of which can influence UPL’s earnings trajectory. A long-term investor might view UPL as a core holding within a sector-focused sleeve, given its exposure to a fundamental industry with secular demand growth. The upside embedded in the target highlights how a stable earnings platform can translate into a higher valuation multiple over time.
Persistent Systems Stock Price And Analyst Targets
Persistent Systems stock price near Rs 5575 with a target of Rs 6400 from Motilal Oswal, which rates it as Buy and cites a 15% upside. This IT services name sits at a juncture where demand for digital transformation solutions remains robust, even as the broader sector negotiates near-term headwinds. The Persistent Systems stock price action reflects a combination of margin discipline and a pipeline of growth projects that can drive earnings visibility over the next several quarters.
From an investment standpoint, Persistent Systems offers a way to diversify within the IT exposure, balancing large-cap peers with a mid-cap growth trajectory. When evaluating Persistent Systems stock, consider client diversification, product mix, and the potential for margin expansion through efficiency improvements and scale. The price target around Rs 6400 signals the market’s expectation of continued earnings growth and multiple expansion as the company executes its strategic roadmap.
Glenmark Pharma Stock Price Outlook And Brokerages' Recommendations
Glenmark Pharma stock price around Rs 2230 is paired with a Buy rating from Motilal Oswal and a target of Rs 2570, suggesting a 15% upside. This pharmaceutical stock has faced volatility driven by regulatory dynamics and pipeline development, yet the upside case centers on a stronger product portfolio and selective geographic expansion. Glenmark’s stock price movement will likely hinge on new approvals, launches, and market share gains in key regions as it fortifies its product pipeline.
In constructing a broader portfolio, Glenmark Pharma stock can serve as a higher-beta pharma exposure within a balanced mix that includes M&M stock, Exide, UPL, and Persistent Systems. The combination of defensive traits from one segment and growth catalysts from others can help an investor manage risk while pursuing upside across market cycles. Investors should remain mindful of regulatory and competitive risks, while using horizon-aligned allocations to stay disciplined amid volatility.
For deeper, data-driven stock evaluation and AI-powered insights, you can explore Swastika's Sarthi AI stock assistant.
Related Reads
- Infosys Share Price And IT Sector Pulse: AI Bets, FPI Flows, And A Possible Rebound
- Infosys Share Price In Focus Amid IT Slump And RBI Watch
- Sun Pharma Share Price And US Tariff Talks: What Indian Retail Investors Must Watch
Frequently Asked Questions
What are the latest brokerages targets for M&M stock?
Morgan Stanley on M&M: Overweight | Target Rs 4370 | LTP Rs 3385 | Potential Upside 29%.
How does Exide Industries stock price compare to broker targets?
Exide Industries stock price around Rs 444 with a target of Rs 510 from Citi, implying a potential upside of 14%.
What is the UPL stock price and its upside potential according to brokerages?
UPL stock price around Rs 625; Target Rs 710; Upside 13% according to Equirus Securities Ltd.
Which stocks among the list have 10-20% upside in 2026?
M&M, Exide Industries, UPL, Persistent Systems, and Glenmark Pharma have 10-20% upside potential according to 2026 brokerages.
Who are the brokerages behind these recommendations?
Morgan Stanley covers M&M Citi covers Exide Industries; Equirus Securities Ltd covers UPL; Motilal Oswal covers Persistent Systems and Glenmark Pharma.
Conclusion
The five names highlighted here offer a pragmatic, diversified path to 10-20% upside in 2026 for a retail investor who is comfortable with a moderate risk profile and a multi-year horizon. The core takeaway is not a guaranteed return but a structured framework: blend price context (LTP) with credible price targets and a disciplined allocation across autos, batteries, pharma, and IT. Use these price levels and targets to set risk budgets and re-balance as earnings momentum and macro dynamics evolve.
As you move from analysis to action, consider leveraging Swastika's Sarthi AI stock assistant to scan additional data points, compare valuations, and tailor stock selection to your risk tolerance and time horizon. Swastika's Sarthi AI stock assistant can help you refine your approach and uncover deeper insights across these five ideas and beyond.
Big Budget


Popular Articles





.avif)
.avif)

.avif)



START YOUR INVESTMENT JOURNEY
Get personalized advice from our experts
- Dedicated RM Support
- Smooth and Fast Trading App
