


IOCL Share Price And Crude Oil Trends: What Retail Investors Should Know




Key Takeaways
- Petrol And Diesel Prices Remained Unchanged Across Major Indian Cities On August 6.
- Brent Crude Traded Near 79 USD Per Barrel While WTI Fell Under 75 USD As Strait Of Hormuz Talks Moved Markets.
- SIAM Withdrawn Its E20 Fuel Quality Communication Pending Data Verification.
- IOCL Share Price And Other Oil Stock Watchers Should Monitor Crude Movements And Policy Signals.
On August 6, retail petrol and diesel prices across India's major cities remained unchanged, keeping in place the rates that have existed since May 25. The global crude price softened in Asian trading as talks about restoring Strait of Hormuz shipping progressed. For investors watching the downstream sector, IOCL Share Price and BPCL Stock Price, along with HPCL Stock Price, could respond to evolving crude price dynamics while domestic pricing remains steady. Brent crude traded near $79 per barrel, and West Texas Intermediate slipped below $75 as markets weighed the potential Iran-Oman deal. Looking ahead, IOCL Share Price could react to smoother shipping flows and domestic regulation.
Why Petrol And Diesel Prices Stayed Flat Across Major Indian Cities On August 6
That day, retail petrol and diesel prices across India stayed flat, keeping the same retail rates since the last revision on May 25. This stability reflects the domestic pricing framework used by oil marketing companies, which often respond to changes in crude prices with a lag and other policy considerations. Retailers kept the price lines unchanged even as global crude prices fluctuated, underscoring the importance of the domestic pricing mechanism in maintaining price stability at the pump. For investors, this dynamic can influence consumer demand expectations, which in turn affects the operating environment for downstream majors such as IOCL, BPCL, and HPCL. IOCL Stock Price movements can reflect these consumer demand signals as well as margins.
Brent And WTI Crude Price Action: What It Means For IOCL Share Price And Other Oil Stocks
Brent traded near $79 per barrel, and WTI dipped below $75, after falling about 11% in the first three trading sessions of the week. This softening in crude prices comes as markets weigh the possibility of restoring shipping through the Strait of Hormuz. If an actual agreement moves forward, prices could come closer to $70 per barrel.
For IOCL Share Price watchers, a softer crude backdrop could influence downstream margins and sentiment, potentially impacting IOCL Stock Price and IOCL stock trends in the near term. Investors should monitor not only the crude signals but also domestic policy cues that shape price realization for oil marketing companies.According To Rob Thummel Of Tortoise Capital, oil prices have already moved below $80 per barrel as markets assess the possibility of an agreement with Iran. He added that prices could move closer to $70 per barrel if a deal is reached.


Iran-Oman Strait Of Hormuz Talks: How An Agreement Could Move Oil Prices Toward $70
The Strait of Hormuz remains one of the world’s most important energy shipping routes, and the current discussions with Iran and Oman have kept markets focused on any potential easing of supply constraints. The market reaction to any real progress could lift or depress downstream stock prices depending on how costs and margins are affected by the evolving price landscape. The price path for Brent and WTI will influence IOCL Stock Price, BPCL Stock Price, and HPCL Stock Price in the weeks ahead.
BPCL Stock Price Outlook In A Soft Crude Market
In a softer crude environment, downstream players like BPCL Stock Price may experience mixed signals: lower input costs could support margins, while demand and regulatory signals drive actual earnings. The price data indicates a global trend toward softer crude levels, which could be a tailwind for some oil marketing companies and a challenge for others depending on refining capacity utilization and marketing margins. The BPCL stock price will likely respond to shifts in crude price and domestic policy, so keeping an eye on IOCL, HPCL, and BPCL movements could help gauge sector health.
HPCL Stock Price Outlook In A Soft Crude Market
Like its peers, HPCL Stock Price could react to the evolving crude price environment. A softer crude backdrop can help refining margins, but the net effect on stock performance depends on company-specific factors like utilization rates, product mix, and cost efficiency. The current macro backdrop – with crude under pressure and domestic fuel prices steady – suggests a cautious but opportunistic stance for HPCL's share price trajectory. Investors should note how changes in global price signals translate into domestic pricing, margins, and earnings potential for HPCL.
SIAM E20 Fuel Quality Update And Its Implications For Indian Oil Stocks
The Society Of Indian Automobile Manufacturers (SIAM) has withdrawn its earlier communication to the Ministry of Petroleum and Natural Gas regarding E20 fuel quality. The figures cited in media reports require further authentication and data collection before any conclusions can be drawn. This update, while not directly altering current price movements, could influence consumer choices and policy considerations that condition the performance of Indian oil companies over time.
Related Reads
- Share Price IOCL And City Fuel Data: Petrol, Diesel, And CNG Trends For Retail Investors
- IOCL Share Price And LPG Market Update August 2026
- IOCL Petrol Price Across Indian Cities On July 27, 2026: A Citywise Snapshot For Retail Investors
Frequently Asked Questions
Why did petrol and diesel prices stay unchanged across major Indian cities on August 6?
Retail petrol and diesel prices across India remained unchanged on August 6, with the last revision on May 25.
What is causing crude prices to soften and how could this affect IOCL stock price?
Global crude price softened amid talks about restoring Strait of Hormuz shipping. Brent near $79 and WTI below $75, with a drop of about 11% in the first three trading sessions. If an Iran-Oman agreement progresses, prices could move toward $70 per barrel, potentially influencing IOCL stock price via crude-price-driven margins and sentiment.
What happened with SIAM and E20 fuel quality communications?
SIAM withdrew its earlier communication to the Ministry regarding E20 fuel quality; the figures cited require further authentication and data collection before conclusions are drawn.
How might crude price dynamics influence IOCL stock price and other oil majors?
Crude price movements influence downstream stocks. A softer crude backdrop could affect IOCL Stock Price and IOCL stock trends in the near term, depending on margins, demand, and regulatory signals that shape price realization for oil marketing companies.
What crude price levels are cited in the article for context?
Brent crude traded near $79 per barrel, while WTI traded below $75 per barrel.
Conclusion
For the retail investor today, the takeaway is to treat crude price signals, domestic pricing stability, and policy updates as a single mosaic that can move IOCL Share Price and other oil majors in the weeks ahead. The smart approach is to combine macro cues with stock-level research, maintain situational awareness, and define a risk-aware plan for exposure to IOCL Stock Price, BPCL Stock Price, and HPCL Stock Price.
Latest Articles
IOCL Share Price And Crude Oil Trends: What Retail Investors Should Know


Key Takeaways
- Petrol And Diesel Prices Remained Unchanged Across Major Indian Cities On August 6.
- Brent Crude Traded Near 79 USD Per Barrel While WTI Fell Under 75 USD As Strait Of Hormuz Talks Moved Markets.
- SIAM Withdrawn Its E20 Fuel Quality Communication Pending Data Verification.
- IOCL Share Price And Other Oil Stock Watchers Should Monitor Crude Movements And Policy Signals.
On August 6, retail petrol and diesel prices across India's major cities remained unchanged, keeping in place the rates that have existed since May 25. The global crude price softened in Asian trading as talks about restoring Strait of Hormuz shipping progressed. For investors watching the downstream sector, IOCL Share Price and BPCL Stock Price, along with HPCL Stock Price, could respond to evolving crude price dynamics while domestic pricing remains steady. Brent crude traded near $79 per barrel, and West Texas Intermediate slipped below $75 as markets weighed the potential Iran-Oman deal. Looking ahead, IOCL Share Price could react to smoother shipping flows and domestic regulation.
Why Petrol And Diesel Prices Stayed Flat Across Major Indian Cities On August 6
That day, retail petrol and diesel prices across India stayed flat, keeping the same retail rates since the last revision on May 25. This stability reflects the domestic pricing framework used by oil marketing companies, which often respond to changes in crude prices with a lag and other policy considerations. Retailers kept the price lines unchanged even as global crude prices fluctuated, underscoring the importance of the domestic pricing mechanism in maintaining price stability at the pump. For investors, this dynamic can influence consumer demand expectations, which in turn affects the operating environment for downstream majors such as IOCL, BPCL, and HPCL. IOCL Stock Price movements can reflect these consumer demand signals as well as margins.
Brent And WTI Crude Price Action: What It Means For IOCL Share Price And Other Oil Stocks
Brent traded near $79 per barrel, and WTI dipped below $75, after falling about 11% in the first three trading sessions of the week. This softening in crude prices comes as markets weigh the possibility of restoring shipping through the Strait of Hormuz. If an actual agreement moves forward, prices could come closer to $70 per barrel.
For IOCL Share Price watchers, a softer crude backdrop could influence downstream margins and sentiment, potentially impacting IOCL Stock Price and IOCL stock trends in the near term. Investors should monitor not only the crude signals but also domestic policy cues that shape price realization for oil marketing companies.According To Rob Thummel Of Tortoise Capital, oil prices have already moved below $80 per barrel as markets assess the possibility of an agreement with Iran. He added that prices could move closer to $70 per barrel if a deal is reached.
Iran-Oman Strait Of Hormuz Talks: How An Agreement Could Move Oil Prices Toward $70
The Strait of Hormuz remains one of the world’s most important energy shipping routes, and the current discussions with Iran and Oman have kept markets focused on any potential easing of supply constraints. The market reaction to any real progress could lift or depress downstream stock prices depending on how costs and margins are affected by the evolving price landscape. The price path for Brent and WTI will influence IOCL Stock Price, BPCL Stock Price, and HPCL Stock Price in the weeks ahead.
BPCL Stock Price Outlook In A Soft Crude Market
In a softer crude environment, downstream players like BPCL Stock Price may experience mixed signals: lower input costs could support margins, while demand and regulatory signals drive actual earnings. The price data indicates a global trend toward softer crude levels, which could be a tailwind for some oil marketing companies and a challenge for others depending on refining capacity utilization and marketing margins. The BPCL stock price will likely respond to shifts in crude price and domestic policy, so keeping an eye on IOCL, HPCL, and BPCL movements could help gauge sector health.
HPCL Stock Price Outlook In A Soft Crude Market
Like its peers, HPCL Stock Price could react to the evolving crude price environment. A softer crude backdrop can help refining margins, but the net effect on stock performance depends on company-specific factors like utilization rates, product mix, and cost efficiency. The current macro backdrop – with crude under pressure and domestic fuel prices steady – suggests a cautious but opportunistic stance for HPCL's share price trajectory. Investors should note how changes in global price signals translate into domestic pricing, margins, and earnings potential for HPCL.
SIAM E20 Fuel Quality Update And Its Implications For Indian Oil Stocks
The Society Of Indian Automobile Manufacturers (SIAM) has withdrawn its earlier communication to the Ministry of Petroleum and Natural Gas regarding E20 fuel quality. The figures cited in media reports require further authentication and data collection before any conclusions can be drawn. This update, while not directly altering current price movements, could influence consumer choices and policy considerations that condition the performance of Indian oil companies over time.
Related Reads
- Share Price IOCL And City Fuel Data: Petrol, Diesel, And CNG Trends For Retail Investors
- IOCL Share Price And LPG Market Update August 2026
- IOCL Petrol Price Across Indian Cities On July 27, 2026: A Citywise Snapshot For Retail Investors
Frequently Asked Questions
Why did petrol and diesel prices stay unchanged across major Indian cities on August 6?
Retail petrol and diesel prices across India remained unchanged on August 6, with the last revision on May 25.
What is causing crude prices to soften and how could this affect IOCL stock price?
Global crude price softened amid talks about restoring Strait of Hormuz shipping. Brent near $79 and WTI below $75, with a drop of about 11% in the first three trading sessions. If an Iran-Oman agreement progresses, prices could move toward $70 per barrel, potentially influencing IOCL stock price via crude-price-driven margins and sentiment.
What happened with SIAM and E20 fuel quality communications?
SIAM withdrew its earlier communication to the Ministry regarding E20 fuel quality; the figures cited require further authentication and data collection before conclusions are drawn.
How might crude price dynamics influence IOCL stock price and other oil majors?
Crude price movements influence downstream stocks. A softer crude backdrop could affect IOCL Stock Price and IOCL stock trends in the near term, depending on margins, demand, and regulatory signals that shape price realization for oil marketing companies.
What crude price levels are cited in the article for context?
Brent crude traded near $79 per barrel, while WTI traded below $75 per barrel.
Conclusion
For the retail investor today, the takeaway is to treat crude price signals, domestic pricing stability, and policy updates as a single mosaic that can move IOCL Share Price and other oil majors in the weeks ahead. The smart approach is to combine macro cues with stock-level research, maintain situational awareness, and define a risk-aware plan for exposure to IOCL Stock Price, BPCL Stock Price, and HPCL Stock Price.

Tips Music Share Price: Open Market Buyback And Retail Investor Guide
Key Takeaways
- The board approved an open-market buyback of up to 5.9 lakh fully paid-up equity shares at Rs 750 per share, signaling capital-return intentions and potential upside for Tips Music Share Price.
- Promoters are excluded from the buyback, with a minimum utilization of 75% of Rs 33.38 crore, tying the plan to FY26 profit distribution.
- Q1 FY27 revenue rose 21% YoY while EBIT margin declined to 49% due to higher content investments.
- Analysts see upside with a target price of Rs 810, while the stock trades around Rs 651, indicating potential returns.
Tips Music Share Price jumped into focus after the board approved an open-market buyback of up to 5.9 lakh fully paid-up equity shares at Rs 750 per share, implying a premium of nearly 12% to the stock’s last close. This move is among the first uses of SEBI’s open-market buyback framework since its reintroduction on August 1, and it signals a renewed commitment by Tips Music to shareholder returns. For retail investors, the open-market route means the company will repurchase shares through stock exchanges rather than inviting shareholders to tender at a fixed price. There is no record date or shareholder reservation, and participation is open to all shareholders selling through the market during the buyback period.
SEBI’s revised framework, effective August 1, reinforces the open-market approach as a flexible mechanism for capital returns. Unlike tender offers, the open-market route does not rely on a fixed price or a record date; instead, the company buys shares on the market during the buyback window, and investors can participate if they are willing to sell. The framework aims to align management’s capital-allocation strategy with market dynamics, allowing stock-purchase activity to adapt to price movements while signaling confidence in the company’s growth trajectory.
Management’s commentary underscores a broader narrative: Tips Music aims to distribute profits through a combination of dividends and buybacks, a strategy reiterated during the FY26 year-end plans. The distribution plan is anchored to FY26 profit (Rs 216.7 crore) and reflects a broader industry trend toward shareholder returns as revenue scales. In this context, the buyback is not just a price-support move; it is a signal about the company’s confidence in its cash flow generation and long-term growth velocity.
What The Open Market Buyback Means For Tips Music Share Price
For an investor tracking Tips Music Share Price, the open-market buyback introduces a new supply-demand dynamic. By purchasing shares on the exchange, the company reduces the number of shares outstanding, potentially supporting earnings per share (EPS) and signaling confidence in the near-term business trajectory. Because the buyback is executed in the market rather than through a tender offer, participation is more fluid, and the price impact can be asymmetric–depending on how the buyback window coincides with market sentiment and trading liquidity.
From a market psychology perspective, a buyback with a premium (nearly 12% to the previous close) sends a bullish cue. The premium acts as a price carrot, potentially attracting short-term trading interest while investors weigh the longer-term fundamentals that JM Financial highlighted in its note. The absence of promoter participation can also recalibrate perceptions of ownership concentration and the distribution of equity among public shareholders. In practice, this can translate into a more fluid supply-demand balance during the buyback window, with incremental demand from the buyback pressuring the stock price higher, at least in the near term.
Key Buyback Details: 5.9 Lakh Shares At Rs 750
The buyback plan covers up to 5.9 lakh fully paid-up equity shares at a price of Rs 750 per share. The aggregate outlay for this program would be approximately Rs 44.25 crore. The announcement notes a premium of about 12% versus the stock’s last close, which has implications for immediate price behavior and the perceived value of the buyback by market participants. Importantly, promoters and the promoter group are not participating in this buyback, aligning with standard corporate governance norms for retail investor confidence and ensuring equitable treatment of non-promoter holders.
As per JM Financial’s perspective, the buyback is designed to be part of a broader framework that distributes FY26 profit through dividends and buybacks. The plan requires a minimum utilization of 75% of the approved amount, which equates to Rs 33.38 crore, ensuring a significant proportion of the allotted capital is deployed into buyback activity. This minimum utilization threshold helps prevent over-commitment without execution, lending a degree of protection to minority shareholders that management will actually deploy a sizable portion of the authorized capital.
Promoter Exclusion, Utilization Threshold And FY26 Profit Distribution
Promoter exclusion is a common feature intended to reassure public shareholders that control blocks are not pulling profits away from the broader base. In this case, the buyback excludes promoters and promoter group participation, reinforcing the open-market field for retail investors. The 75% utilization requirement–Rs 33.38 crore of the approx. Rs 44.25 crore total outlay–anchors the buyback to a clear capital-allocation discipline, ensuring a meaningful portion of the plan translates into real buyback execution rather than an issuance of promises that may not materialize.
Additionally, the buyback aligns with management’s long-term plan to distribute FY26 profits of Rs 216.7 crore through dividends and buybacks. The blend of dividends and buybacks is a dual-path approach to shareholder value, allowing investors to realize cash flows (dividends) while also benefiting from a potential stock-price re-rating as buybacks reduce share count and support EPS growth. Such strategies have historically improved investor sentiment when executed with clarity on price, timing, and capital allocation priorities.
For investors watching the momentum around Tips Music stock price, the buyback’s entry point and the premium add a near-term upside catalyst. However, it’s essential to weigh this against the company’s Q1 FY27 fundamentals and the guidance outlook, which we unpack in the next section. The buyback’s practical impact will unfold as trading liquidity evolves during the buyback window and as the market digests the company’s ongoing content strategy and revenue trajectory.
Q1 FY27 Performance: Revenue Growth, Costs, And Outlook
JM Financial highlighted a healthy Q1 FY27 performance with revenue up 21% year-over-year, supported by growth across both digital and non-digital businesses. Yet profitability was tempered by elevated content investments, with EBIT margin slipping to 49% as content costs nearly doubled year-over-year after the release of 73 songs (55 film and 18 non-film). This mix of growth drivers and cost pressures paints a nuanced picture: topline expansion remains a clear positive signal, but the company must navigate margin headwinds tied to content investments as it scales and expands its catalog.
The management reaffirmed FY27 guidance: 20% growth in revenue and 20% growth in PAT (Profit After Tax), alongside an EBITDA margin target in the 65–70% band. Content acquisition guidance is pegged at Rs 90–100 crore, with expectations that the full revenue benefit from key releases launched in mid-May and June 2026 will materialize from Q2 FY27 onward. These details imply a multi-year growth trajectory where the company leverages content assets to sustain revenue growth while managing profitability through scale and efficiency improvements.
The stock’s current momentum reflects this complex equation. Tips Music share price has experienced volatility along the way, echoing the market’s tug between growth optimism and near-term margin pressures. While the 21% YoY revenue growth is encouraging, investors will want to see continued progression toward the mid-to-high teens growth rate and sustained margin expansion as new releases and catalog investments mature. In this framework, the buyback can be viewed as a signal of management’s confidence in cash generation and the ability to return capital even as it executes on a capacity-expansion strategy.
Valuation Outlook: Analysts See Upside With Rs 810 Target And The Current Price Level
JM Financial’s note assigns a target price of Rs 810 per share, implying more than 20% upside from the stock’s previous closing price. With the current price fluctuating around Rs 651, the implied upside from the analyst’s target reflects optimism about the stock’s ability to translate revenue growth and successful releases into sustained profitability and a higher multiple. The buyback premium and the open-market routing reinforce the sense that the company is actively managing its capital structure to support shareholder value while continuing to invest in content and distribution channels. If the execution aligns with guidance, the company could see improved investor sentiment and potentially multiple re-rating over time.
From a broader market perspective, the stock’s price trajectory has shown a mixed profile: it fell over 3% to Rs 651 on a given Thursday, with a 2% decline over the past week and more than 5% over the past month. Yet the year-to-date performance stands at a robust +20% in 2026, with longer-term gains of +10% in a year and +118% in three years, countered by a -44% drop over the last five years. The company’s market capitalization sits above Rs 8,332 crore, suggesting a meaningful scale and liquidity to support the buyback dynamics as well as ongoing equity and expansion plans. For investors, this context matters when weighing the potential upside from the buyback against the risk profile implied by a volatile price history and the evolving content-driven growth narrative.
Tips Music Dividend: The Dual Path To Shareholder Returns
Beyond the buyback, the company’s stated plan to distribute profits through dividends signals a two-pronged approach to shareholder value. The management’s alignment with FY26 profit distribution (Rs 216.7 crore) via both dividends and buybacks creates an instrumented framework for returns across different market conditions. Investors seeking regular income from the stock may weigh the dividend component alongside buyback-driven EPS growth and potential re-rating.
Additionally, the open-market buyback framework offers a disciplined way to deploy capital with a focus on value creation. In the context of the company’s broader growth agenda–its Q1 FY27 performance, 73-song catalog development, and the guidance for FY27–the dividend-backup strategy could serve as a stabilizing force in the stock’s valuation, especially during periods of market volatility. For readers tracking the Tips Music Dividend potential, the interplay between buybacks and dividends is a crucial factor in assessing the overall yield and price appreciation potential.
As investors look for actionable insights, consider leveraging Swastika’s AI-driven stock research to further dissect the implications of the buyback and the company’s growth trajectory. Swastika's Sarthi AI stock assistant can help you tailor stock-level analysis to your risk tolerance and time horizon.
Tips Music Share Price NSE: Market Sentiment And The Road Ahead
The discussion around Tips Music Share Price NSE reflects a confluence of catalysts: the open-market buyback, the premium to the last close, the lack of promoter participation, and the mid-to-long-term growth narrative anchored in content strategy and monetization. The stock’s price action – Rs 651 in the latest trading session, with a history of fluctuating performance – suggests that traders are pricing in both the buyback premium and the growth potential from new releases. From a long-term perspective, the 20% rise in 2026 and the 118% rise across three years show a trajectory that’s capable of delivering outsized gains if the company continues to execute on its content strategy and expands its profitable segments.
For investors looking to gauge the next steps, the key questions revolve around: Will the 75% utilization requirement prove binding on execution, or will the buyback accelerate given strong cash flow? How will the content pipeline (Rs 90–100 crore planned acquisitions) translate into revenue and margin improvements beyond Q2 FY27? And what does the market’s current sentiment imply for entry points around the Rs 650–700 range? While the buyback offers a near-term upside catalyst, sustained gains will require continued execution on FY27 guidance and the durability of the revenue mix across digital and non-digital streams.
Frequently Asked Questions
What is the size and price of the Tips Music open-market buyback?
The board approved a buyback of up to 5.9 lakh fully paid-up equity shares at Rs 750 per share, for a total outlay of about Rs 44.25 crore.
Are promoters participating in the buyback?
Promoters and promoter group participation are excluded from the buyback.
What is the minimum utilization required for the buyback?
A minimum utilization of 75% of the approved amount, i.e., Rs 33.38 crore, is required.
What did Q1 FY27 results show for Tips Music?
Q1 FY27 revenue rose 21% year-over-year, with EBIT margin at 49% as content costs nearly doubled; 73 songs were released (55 film and 18 non-film).
What is the FY27 guidance and key content plans?
Management guides 20% growth in revenue and PAT, with EBITDA margin guidance of 65–70% and content acquisition guidance of Rs 90–100 crore; full revenue benefit from new releases is expected from Q2 FY27 onward.
What price target and upside do analysts see for Tips Music?
Analysts, including JM Financial, have a target price of Rs 810 per share, implying more than 20% upside from the current level around Rs 651.
Conclusion
Take a moment to map your decision against a simple mental model: treat the buyback as a signal of cash-return discipline and use the growth trajectory as a factor for evaluating a long-term holding or strategic small-cap exposure. With the stock price hovering around Rs 651 and a target price around Rs 810 from prominent analysts, there is a defined upside if the narrative plays out as expected, but risk remains in the cost of content investments and the timing of release cycles. Arm yourself with data, assess your risk tolerance, and keep an eye on the ongoing progress of the FY27 plan as the company moves through the year.
Open your trading and demat account here
Reference :
1 : Economictimes

RBI Interest Rates Rationalisation: What It Means For You
Key Takeaways
- RBI Interest Rates rationalisation aims to harmonise guidelines across Regulated Entities with proportionality.
- It addresses operational aspects of MCLR and EBLR, and standardises day count conventions and benchmark reset dates.
- For investors, pricing could become more uniform and transparent, with stronger monetary transmission.
- Stay informed via RBI policy updates and rate changes, and explore insights with Swastika's Sarthi AI stock assistant.
First Published: Aug 06 2026 | 1:31 PM IST. Last Updated: Aug 06 2026 | 1:31 PM IST.
RBI Interest Rates are undergoing a major rethink. The Reserve Bank of India has proposed a principle-based rationalisation of the regulatory framework on interest rates for all Regulated Entities, aimed at bringing uniformity and strengthening monetary transmission for both borrowers and investors.
The proposed rationalisation seeks to accomplish three core goals: first, harmonising guidelines across Regulated Entities while maintaining proportionality; second, addressing operational aspects of the current MCLR and EBLR framework; and third, standardising divergent market practices related to interest charging, including day count convention and benchmark reset dates.
For retail borrowers and other market participants, these changes are intended to promote uniformity, transparency in loan pricing, and stronger consumer protection. In practice, this could reduce the cost disparities across lenders and improve the transmission of monetary policy into actual loan pricing.
RBI Interest Rates Rationalisation: What It Means For You
The principal idea behind the rationalisation is to create a single, principle-based framework that REs can apply, rather than a patchwork of different rules. By standardising the MCLR/EBLR mechanics and the way interest is charged, lenders will have a consistent baseline on which to price loans. This matters because the cost of funds and the way a bank passes through policy changes to borrowers determine your EMI and total interest outgo. The net effect could be a flatter pricing curve across lenders for similar loan products, making comparisons easier for you.
Importantly, the move places emphasis on transparency. When lenders use uniform day-count conventions and standard benchmark reset dates, it becomes easier for you to compare offers, calculate true costs, and negotiate more effectively. The enhanced transparency also supports consumer protection by reducing opportunistic pricing variations that arise from opaque practices.
Harmonising Guidelines Across Regulated Entities: Why Proportionality Matters
Regulated Entities include banks, NBFCs, and housing finance companies. The rationalisation aims to harmonise guidelines while preserving proportionality–meaning that the intensity of the rules scales with the size and risk profile of the entity. For smaller lenders or non-bank peers, the framework should not become a hindrance but instead provide a clear, predictable pricing baseline. For retail investors, that predictability translates into more reliable budgeting for loans and credit facilities.
As a retail investor, you want to know that a loan's price reflects a fair pass-through of policy signals rather than a labyrinth of divergent pricing practices. This is where the RBI Monetary Policy and ensuing RBI Policy Update come into play. The aim is to strengthen monetary transmission–how rate decisions by the central bank translate into borrowing costs across the economy.
Operational Changes To MCLR And EBLR Under The New Framework
Currently, many REs use Marginal Cost of Funds Based Lending Rate (MCLR) or External Benchmark based Lending Rate (EBLR). The rationalisation is designed to streamline these mechanisms to reduce arbitrage between banks and non-banks. In practical terms, you could see faster and more uniform adjustments to lending rates as policy changes pass through more quickly across lenders. The emphasis is on standardisation rather than a patchwork of lender-specific rules, so the overall market pricing should become more coherent over time.
For you, this means better predictability of how an RBI policy action translates into your loan cost. If the policy stance shifts, a standardised pass-through will help you estimate EMI changes more reliably. The transparency uplift reduces the risk of surprise spikes in rates and makes it easier to compare loan offers on an apples-to-apples basis.
Standardising Day Count Conventions And Benchmark Reset Dates: Why It Matters
Day-count convention determines how interest accrues on a loan across a year, and benchmark reset dates define when a loan's reference rate is updated. By standardising these elements, the RBI intends to close gaps in the market and bring uniformity to pricing across all REs. A common framework means that a similar loan product should behave similarly across lenders, simplifying comparison for investors who are evaluating loan products, personal loans, or mortgage options.
From a monetary policy transmission standpoint, standardised conventions help ensure that rate changes are passed through consistently. You will benefit if you routinely compare offers or track how a policy change affects your cost of borrowing. The goal is not just transparency but also a practical reduction in timing mismatches that distort pricing signals in real time.
RBI Monetary Policy, RBI Lending Rate, And The Transmission To Your Wallet
The proposed rationalisation sits within the broader context of RBI monetary policy. As policy rates adjust, the RBI lending rate and the pass-through to retail borrowers becomes more predictable when a standardised framework is in place. The change could help you understand the direction of rate changes and anticipate how the next RBI policy update may influence loan pricing across lenders. In short, the central bank’s policy stance should translate more consistently into the actual cost of credit for your loans.
Investors should watch how the market prices risk in response to policy signals. A transparent, uniform framework reduces surprises on both the upside and the downside, aiding better financial planning. If you want deeper stock-level research or scenario analysis on how these changes could affect equities or fixed-income products, Swastika’s Sarthi AI stock assistant can help you compare how different lenders price similar products across the spectrum. Swastika's Sarthi AI stock assistant.
What Retail Investors Should Do Now: A Practical Playbook
As these reforms roll out, here are practical steps you can take to manage risk and position your portfolio for a period of transition. First, monitor RBI policy updates and RBI rate changes; the rationalisation aims to create more uniform pricing, but the exact timetable and final rules will matter for your planning. Second, compare loan offers on an apples-to-apples basis by focusing on a standard day-count convention and a fixed vs floating benchmark approach rather than relying solely on headline rates. Third, use scenario analysis to understand how a small shift in the policy stance could affect a loan’s total cost over its tenure.
Related Reads
- RBI Policy Update: How The RBI Monetary Policy Shapes Indian Markets
- RBI Monetary Policy Repo Rate: Inflation Eases
- RBI Policy Decision: Navigating The Rupee And Indian Markets
Frequently Asked Questions
What is RBI Interest Rates rationalisation?
The RBI has proposed a principle-based rationalisation of the regulatory framework on interest rates for all Regulated Entities. Its core aims are to harmonise guidelines across REs while maintaining proportionality, address operational aspects of the current MCLR and EBLR frameworks, and standardise divergent market practices on day count conventions and benchmark reset dates. The objective is to ensure uniformity, enhance transparency in loan pricing, strengthen monetary transmission, and bolster consumer protection.
What are the aims of RBI Interest Rates rationalisation?
The rationalisation has three pillars: (1) harmonise guidelines across Regulated Entities while preserving proportionality; (2) address operational aspects of MCLR and EBLR; (3) standardise market practices related to interest charging, including day count conventions and benchmark reset dates. Together, these measures seek to improve uniformity, transparency, monetary transmission, and consumer protection.
How will MCLR and EBLR be affected by the new framework?
The framework targets the operational aspects of MCLR (Marginal Cost of Funds Based Lending Rate) and EBLR (External Benchmark Lending Rate) to reduce arbitrage and create a common baseline for pricing. This could lead to faster and more consistent rate adjustments across Regulated Entities in response to RBI policy, improving predictability for borrowers and investors.
Why is standardising day count conventions and benchmark reset dates important?
Standardising day count conventions and benchmark reset dates reduces pricing ambiguity across lenders, enables apples-to-apples comparisons, and helps ensure rate changes pass through more transparently. This supports smarter decision-making for borrowers and investors and strengthens policy transmission into actual loan costs.
What should investors watch in RBI policy updates and rate changes?
Investors should monitor RBI policy updates and rate changes to gauge how credit prices may move across lenders. Look for adoption of uniform pricing mechanics and any changes to day-count conventions or reset calendars, as these will directly affect loan costs and the valuations of related debt instruments.
Conclusion
The RBI's move toward interest rate rationalisation could bring much-needed clarity to loan pricing, making it easier for you to compare offers and assess true costs. For retail investors, the main takeaway is that standardisation and greater transparency support smarter decisions and better monetary transmission. The next step is to stay attuned to RBI policy updates and rate changes, and to use a robust research tool to model how these shifts will affect your credit costs and investment outcomes.
Open your trading and demat account here
Reference :
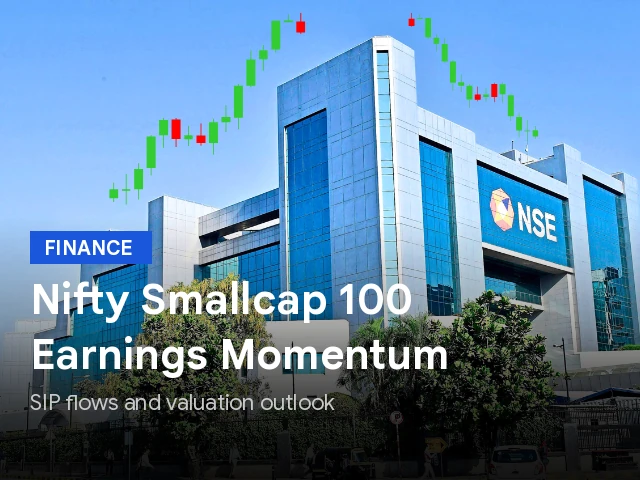
Nifty Smallcap 100 Share Price: Earnings Momentum, SIP Flows, And Valuation Outlook
Key Takeaways
- Nifty Smallcap 100 Share Price Hits Fresh High On Earnings And SIP Inflows.
- Valuations Remain Above Long-Term Norms, Making Earnings Growth The Key To Upside.
- Motilal Oswal Small-Cap Earnings Data Show 32% YoY Growth Across 90 Stocks.
- SIP Inflows Into Small-Cap Funds Provide Liquidity While Valuations Stay Rich.
New highs for the Nifty Smallcap 100 Share Price are setting the pace for India's retail investors, but the real question is whether earnings can justify the premium as valuations stretch beyond long-term norms.
In this phase of the rally, the market breadth has become unusually broad; the small-cap segment has outperformed the Nifty 50 and mid-caps over the last six months, buoyed by strong June-quarter earnings and consistent SIP inflows into small-cap mutual funds. Earnings growth in the June quarter has been around 20% year-on-year, while Motilal Oswal's coverage shows 90 small-cap companies delivering 32% YoY growth, ahead of its 26% estimate. Even after excluding financials, earnings growth stood at 12% YoY, broadly in line with expectations. This combination of profits and liquidity is the backbone of the current rally–and valuation multiples now carry greater weight than earlier in the move.
Nifty Smallcap 100 Share Price: June Quarter Earnings Momentum And What It Means For Retail Investors
The June quarter underscored the earnings momentum that has supported the rally in the small-cap space. Earnings growth around 20% YoY has been the main driver, reinforcing the idea that investors are seeking companies that can justify premium valuations with tangible profit growth. Motilal Oswal's data adds color here: 90 small-cap companies under its watch delivered earnings growth of 32% YoY in the June quarter, ahead of its own 26% estimate. Excluding financials, the growth remains meaningful at 12% YoY, lining up with expectations for the broader sector.
Domestically, the flow of money continues to back the space. AMFI data show small-cap mutual funds attracted ₹5,602 crore in June, up 13.3% from ₹4,946 crore in May. Small-cap funds accounted for about 19% of total equity mutual fund inflows of ₹28,973 crore during the month. This robust liquidity helps sustain demand even as valuations move above long-term averages.
Table: Key Market Metrics Snapshot
| Metric | Value |
|---|---|
| Six-Month Performance | 16% |
| June SIP Inflows (₹ crore) | 5,602 |
| May SIP Inflows (₹ crore) | 4,946 |
| Small-Cap Funds Share Of Equity Inflows | About 19% |
| Total Equity Inflows (₹ crore) In June | 28,973 |
| Nifty Smallcap 100 Price-Earnings Multiple | 31.8x - 32.4x |
| Five-Year Median P/E (Smallcap 100) | 29x |
| Nifty Smallcap 250 P/E Multiple | 34.6x |
| Three-Year Median (Smallcap 250) | ~30x |
| Motilal Oswal Small-Cap Earnings Growth (YoY) | 32% |
| Excluding Financials YoY Earnings Growth | 12% |
Valuation Snapshot: Are We At The Top Of The Rally?
Valuations reflect the nerves of a market that has stretched beyond traditional norms. The Nifty Smallcap 100 price is trading around 31.8x-32.4x earnings, above a five-year median of roughly 29x. The corresponding number for the Nifty Smallcap 250 sits around 34.6x, versus a three-year median near 30x. While this does not automatically rule out further upside, it does suggest the room for multiple expansion is more limited than it was at earlier stages of the rally. In practical terms, investors are now looking for sustained earnings delivery to justify premium valuations.
Market commentary suggests that the premium can stay embedded if earnings growth persists at a healthy pace. But the watchword from analysts is clear: the next phase of gains is likely to hinge more on real profit expansion than on valuation multiples expanding. For retail investors, this means the risk-reward balance shifts toward stock selection quality and earnings visibility rather than broad-based momentum alone.
SIP Inflows And The Liquidity Backbone For Small-Cap Rally
Domestic money continues to chase small-cap opportunities, with mutual fund inflows into the segment remaining sturdy. In June, small-cap mutual funds attracted ₹5,602 crore, up 13.3% from May's ₹4,946 crore. These inflows accounted for about 19% of total equity mutual fund inflows of ₹28,973 crore for the month. The persistence of SIP-driven liquidity helps sustain demand, enabling premium valuations to be supported by actual money coming in from retail investors rather than mere speculative frenzy.
From a practical standpoint, this liquidity cushion matters because it helps the market absorb near-term volatility and provides a longer runway for earnings to catch up with prices. Yet the same data also imply that if earnings growth slows, the valuations could face greater downside pressure, given the high base.
Motilal Oswal Stock Insights: Earnings Growth For Small-Cap Stocks
Motilal Oswal's small-cap stock coverage highlights robust earnings growth. The June quarter saw 90 small-cap companies post a 32% year-on-year earnings increase, ahead of the firm's own 26% estimate. Even when financials are stripped out, the growth remains a healthy 12% YoY, lining up with expectations for the sector. These figures lend credibility to the current premium on small caps, but investors must remain selective and focused on quality metrics rather than chasing broad-based momentum.
As a practical guide, retailers should focus on companies with consistent earnings growth, manageable leverage, and strong cash flow generation. The combination of high-quality earnings and ample liquidity can justify premium pricing, but this condition is not guaranteed to persist. For those seeking deeper analysis, Swastika offers advanced research and a practical tool to help parse opportunities. Swastika's Sarthi AI stock assistant can help screen stocks and assess risk-adjusted return potential in real time.
Takeaways For Retail Investors: How To Gauge The Next Phase Of The Small-Cap Rally
Retail investors should keep a focus on sustainability rather than momentum. As valuations sit above long-term norms, the priority should shift toward identifying earnings durability, cash flow strength, and disciplined risk controls. Invest in a diversified mix of small-cap names that show robust delivery across multiple quarters, with attention to profit margins and balance-sheet quality. Use SIPs to build a core exposure gradually, rather than chasing sudden bursts of performance in a single quarter.
Related Reads
Frequently Asked Questions
What drove the Nifty Smallcap 100 Share Price to a fresh high?
Strong June-quarter earnings growth and persistent SIP inflows into small-cap mutual funds supported the rally.
How are valuations for the Nifty Smallcap 100 and Nifty Smallcap 250 across long-term norms?
Nifty Smallcap 100 price-earnings multiples are around 31.8x-32.4x, vs a five-year median of 29x; Nifty Smallcap 250 trades around 34.6x, vs ~30x median.
What does Motilal Oswal data say about small-cap earnings growth?
Motilal Oswal's data shows 32% YoY earnings growth across 90 small-cap companies in the June quarter; excluding financials, growth is 12% YoY.
What role do SIP inflows play in sustaining the small-cap rally?
AMFI data shows ₹5,602 crore inflows into small-cap funds in June, about 19% of total equity inflows of ₹28,973 crore, providing steady liquidity.
What should retail investors watch next in the small-cap rally?
Investors should focus on earnings delivery and risk controls, because valuations are stretched and further gains depend on actual profit growth.
Conclusion
The current phase of the small-cap rally is anchored by earnings growth and steady domestic liquidity, which gives retail investors a meaningful tailwind. However, valuations are elevated, and the next leg of gains will depend more on actual profit delivery than multiple expansion. The prudent approach today is to focus on durable earnings, maintain diversification, and use a disciplined investment plan–such as systematic SIPs–to participate in the upside while managing risk. This is the moment to apply a 'quality first, price second' mental model and to keep a reserve for volatility.
Firstsource Solutions Share Price: A Deep Dive Into Q1FY27 Results And Outlook
Key Takeaways
- Firstsource Solutions Share Price swung from Rs 337 to Rs 290.20 intraday after Q1FY27 results.
- Q1FY27 net profit declined 19% YoY to Rs 166 crore, while revenue rose 5.5% QoQ to Rs 2,725 crore.
- Analysts stay positive with 14 buys and 1 sell, and a 12-month target of Rs 291.71, implying a small downside.
- RSI at 72.72 and volume at 3.84x 30-day average signal momentum shifts investors should watch ahead of the next earnings cycle.
Firstsource Solutions Share Price swung from Rs 337 to Rs 290.20 intraday after Q1FY27 results, signaling a tension for investors between revenue momentum and profit pressures that will likely shape the stock's near-term moves. This price action sets the stage for a nuanced read of the quarter and what it means for retail investors across India who rely on high-quality research and clear numbers to guide entry and exit decisions.
Firstsource Solutions Share Price And Q1FY27 Results: The Immediate Market Reaction
The June quarter delivered a mixed bag for Firstsource Solutions. Revenue from operations rose 5.5% sequentially to Rs 2,725 crore, underscoring ongoing demand for its outsourced services. On the profitability side, net profit slipped 19% year-on-year to Rs 166 crore, suggesting that the margin recovery story is yet to fully offset higher costs or a shift in the business mix. On the operating front, earnings before interest and tax (EBIT) rose 7.1% QoQ to Rs 337 crore, and EBIT margin expanded by 20 basis points to 12.4% in Q1FY27 from 12.2% in Q4FY26. These metrics show a constructive margin trajectory even as bottom-line profits faced pressure, a classic case of top-line resilience meeting cost and mix challenges.
For investors, the intraday narrative was dramatic. The stock traded around Rs 298.30 after the results were announced, then surged to a high near Rs 337 around 12:47 PM before retreating sharply. By 1:37 PM, the price had slipped to Rs 290.20, representing a drop of as much as 14.51% from the intraday peak. Such moves are not unusual on earnings days when analysts and traders weigh the sustainability of growth against earnings quality. The market activity was notable, with total traded volume running 3.84 times above the 30-day average, signaling robust participation as investors reassessed the quarter’s implications.
The index backdrop also mattered. The NSE Nifty 50 gained 0.10%, indicating a selective stock-specific reaction rather than a broad-market surge. The relative strength index (RSI) of 72.72 placed the stock in an overbought territory, hinting at a risk of a pullback if momentum falters. With 15 analysts tracking the stock, 14 issued a Buy rating while 1 remained a Sell, a consensus that leans toward upside but with caution on near-term volatility. The average 12-month target of Rs 291.71 suggests a potential modest downside from the higher intraday levels, offering a nuanced risk-reward picture for traders and long-term investors alike.
To help readers visualize the intraday dynamics, here is a quick snapshot of the price levels contemporaneous with the headlines:
| Time (IST) | Price (Rs) | Context |
|---|---|---|
| 12:47 PM | 337.00 | Intra-day high before pullback |
| Post-Announcement | 298.30 | Trading level after results |
| 01:37 PM | 290.20 | Decline of up to 14.51% |
Firstsource Solutions Quarterly Results: Revenue Growth And Profit Dip Explained
Looking under the hood, the June quarter’s revenue performance was solid, with Rs 2,725 crore in topline representing a 5.5% sequential rise. This indicates demand stability for its outsourcing services and a continued ability to monetize client engagements. However, the bottom line tells a different story. Net profit declined 19% YoY to Rs 166 crore, underscoring earnings pressure despite top-line gains. This juxtaposition points to a more complex cost structure or a shift in margins that requires closer scrutiny by investors.
On the margins front, EBIT came in at Rs 337 crore, up 7.1% QoQ, while EBIT margin expanded by 20 basis points to 12.4% in Q1FY27 from 12.2% in Q4FY26. The margin expansion is a positive signal, suggesting that the company is managing costs effectively even as revenue grows. For retail investors, the combination of growth in topline and a modest margin improvement can be a prelude to further profitability if operating leverage continues to materialize and costs stabilize. Still, the net profit weakness calls for attention to non-operating items and potential one-offs that could be impacting the bottom line beyond the core operations.
Analysts’ consensus on the stock remains cautiously constructive. With 14 Buy ratings and 1 Sell out of 15 trackers, the street broadly backs the growth story, even as it awaits stronger profit delivery. The 12-month price target sits at Rs 291.71, implying a small downside of about 0.7% from the current price, which reflects a balanced risk-reward setup. In practice, this means investors should weigh the potential for further upside driven by margin expansion and stable cash flows against the near-term earnings volatility that the Q1FY27 results reveal.
Firstsource Solutions Stock Price Momentum: Intraday Levels, RSI, And Volume
Momentum is a critical lens through which investors evaluate price action around earnings. The Firstsource Solutions Stock Price activity on the day in question indicates a high-volatility session with a clear intraday range and substantial trading interest. The RSI reading of 72.72 signals strong near-term momentum, though it also flags the possibility of a pullback if the price remains in that elevated zone. The intraday volume surge–3.84 times the 30-day average–confirms that traders actively participated in parsing the earnings narrative, which can translate into sharper moves in the seconds and hours after the next update.
Comparatively, the stock’s price action against the broad market backdrop shows selective strength. A modest rise in the Nifty 50 on the day indicates that the volatility was stock-specific rather than a broad-market surge. For risk-aware investors, this context matters: outsized moves in select names can create both opportunities and traps, especially when a quarter shows a mix of topline growth and bottom-line pressure.
Firstsource Solutions Price Target And Analyst View
Analyst sentiment around Firstsource Solutions remains broadly constructive. The majority view across trackers supports a favorable long-term trajectory, with a 12-month price target pegged at Rs 291.71. This target implies a subtle downside from the current levels, underscoring a market pricing scenario where upside is contingent on continued margin stabilization and sustained revenue growth. The split among analysts–14 Buy and 1 Sell–adds to the narrative that investors who adopt a longer horizon may find the risk-reward favorable, provided the company can translate topline momentum into stronger earnings in subsequent quarters.
From a strategy standpoint, this dynamic suggests a cautious stance: consider deploying a plan that allows participation in any upside while protecting against a near-term pullback should momentum ease. Given the high RSI and the intraday volatility, patience and a defined target-price framework could help retail investors avoid premature moves while remaining aligned with the company’s longer-term profit trajectory. For those seeking granular, stock-level analysis, Swastika’s Sarthi AI stock assistant can offer institutional-level research insights on Firstsource Solutions and other indices to complement your own due diligence.
Investors who want continuous, data-driven insights can consult Swastika's Sarthi AI stock assistant, a resource designed to translate complex market data into actionable ideas for retail portfolios and trading strategies.
Investing Takeaways For Indian Retail Investors: Practical Steps With Firstsource Solutions
Firstsource Solutions presents a classic case study in the tension between top-line growth and bottom-line profitability. The Q1FY27 results highlight a revenue-positive story but a profit-delivery challenge, a combination that often leads to short-term volatility in the share price. For Indian retail investors, the key is to interpret these results through the lens of sustained earnings quality rather than a single-quarter swing. Margin resilience, cost control, and client mix management will be the critical levers to watch in the next few quarters. The 12-month target of Rs 291.71 suggests that the market is pricing modest downside at current levels, but the stock could re-rate higher if margins continue to expand and if the company demonstrates consistent top-line growth.
Frequently Asked Questions
What triggered the intraday volatility in Firstsource Solutions Share Price after Q1FY27 results?
The results showed a YoY profit decline even as revenue rose; The stock rose to around Rs 337 at midday and later fell to Rs 290.20 as traders priced in mixed signals.
What were the Q1FY27 revenue and net profit numbers for Firstsource Solutions?
Revenue from operations rose 5.5% QoQ to Rs 2,725 crore, while net profit declined 19% YoY to Rs 166 crore.
What is the 12-month price target for Firstsource Solutions according to broker consensus?
The average 12-month price target is Rs 291.71, implying a marginal downside of about 0.7% from the current levels.
How do analysts view Firstsource Solutions stock price movements?
Analysts show a largely bullish stance, with 14 buys and 1 sell out of 15 trackers.
Where can investors get deeper stock analysis from Swastika?
Investors can use Swastika's Sarthi AI stock assistant for institutional-level research on any stock or index.
Conclusion
The story around Firstsource Solutions Share Price after Q1FY27 is a reminder that markets reward revenue momentum but penalize profit volatility. The company posted robust topline growth in a quarter where net profit declined YoY, yet EBIT margin expanded and the overall margin trajectory remains encouraging. For the Indian retail investor, the near-term path may involve continued volatility, but the longer-term setup hinges on sustained margin improvement and consistent earnings power. The prudent approach is to balance the upside potential suggested by a broad analyst Buy rating with a disciplined risk framework that respects intraday volatility and the upcoming earnings cycle.
Open your trading and demat account here
Reference :
1 : Ndtvprofit

Infosys Stock Price Insights For Indian Retail Investors
Key Takeaways
- Infosys Stock Price movements shape both short-term trading and long-term planning.
- Infosys NSE Stock trends reflect market sentiment and quarterly results.
- Infosys Dividend updates influence risk-reward and yields for shareholders.
- Swastika's Sarthi AI stock assistant helps synthesize data and watchlists.
Infosys Stock Price movements shape how Indian retail investors build and rebalance technology exposure. In a market where macro data, currency shifts, and corporate updates collide, the Infosys Stock Price on the NSE and other exchanges serves as a real-time barometer of sentiment and earnings expectations. This Swastika Investmart guide explains how to read the latest price action, what to watch in quarterly results, and how Infosys dividend announcements influence the risk-reward profile for portfolios across the country.
Across this guide, you will see how to interpret Infosys Stock Price movements in tandem with the Infosys NSE Stock dialogue, what the quarterly results imply for future profitability, and how Infosys dividend announcements can shift your payoff profile. The goal is not to chase every spike but to build a disciplined framework that connects price with fundamentals. By aligning your approach with long horizons, you can better weather volatility and participate in IT sector upside.
Infosys Stock Price Trends In 2026: What Retail Investors Need To Know
Infosys Stock Price Trends In 2026 are shaped by a mix of durable earnings power and cyclicality in IT services demand. The company continues to win large digital transformation deals, which supports earnings visibility and cash generation. For a retail investor, price momentum in 2026 will likely respond to how well Infosys translates orders into revenue growth and how margins hold up amid price competition and currency volatility. A disciplined observer will look for sustained revenue growth, improved operating leverage, and steady cash generation as catalysts for a gradual re-rating of the stock.
The practical approach is to combine trend-following with fundamentals. If you see price action confirming a multi-quarter uptrend alongside improving operating metrics, that strengthens the case for incremental allocations. If, however, commentary from management points to margin pressure or slower client wins in a particular quarter, expect price volatility to continue until earnings visibility solidifies. This is where long-term investors can separate noise from signal by focusing on free cash flow, capital allocation, and the company’s ability to reinvest for higher returns over time.
- Long-term driver: Digital services demand and cloud-based transformations continue to support revenue growth and cash flow stability.
- Valuation context: Compare price action with historical multiples and the trajectory of earnings growth.
- Risk: Global growth deceleration, currency headwinds, and competitive pressure can create near-term volatility.
Infosys NSE Stock Performance: How Local Listings Drive Global Sentiment
In India, the Infosys NSE Stock is a primary channel for domestic investors. Price moves on the NSE often reflect local liquidity, policy signals, and earnings cycles, and these moves can influence how global investors view Indian IT stocks. A rising Infosys NSE Stock price can lift tech indices and attract more foreign participation, while negative headlines or macro concerns can trigger swift reversals. For the retail investor, watching the NSE price alongside global peers can provide important context for valuation and risk appetite.
Market participants should also monitor how the stock interacts with broader indices such as the Nifty IT and the sector’s momentum. When the IT sector demonstrates resilience, the price action of Infosys stock often benefits from a favorable risk-on tone. Conversely, during periods of risk-off, even strong earnings narratives may struggle to lift the stock without supportive macro developments. The key takeaway is to use price action as part of a balanced framework rather than as a standalone signal.
- Liquidity and flows: Domestic trading volumes can drive intraday volatility, influencing short-term moves.
- Index correlation: Movements in IT indices can amplify price action and create clearer entry/exit signals.
- Near-term catalysts: Quarterly results and dividend announcements often set the tone for the next few weeks of trading.
Infosys Dividend Outlook: Cash Returns And Impact On The Stock Price
The Infosys Dividend outlook is an important component of total return for shareholders. The company typically balances cash dividends with buybacks to return capital, and policy clarity can help stabilize investor expectations even amid price noise. For a retail investor, dividend announcements provide a tangible cash component that can cushion downside in volatile periods and contribute to a more predictable total return profile over time. Tracking payout ratios and dividend yield trends can offer additional context when evaluating fair value versus growth expectations.
Dividend signals do not operate in isolation. They intertwine with revenue growth, cash flow generation, and capital allocation strategy. In periods of strong earnings visibility, a stable or gradually rising dividend can support multiple compression and price resilience in the stock. Conversely, any cut or significant policy change could temporarily weigh on sentiment, even if long-term fundamentals remain intact. The prudent investor will reconcile dividend expectations with growth potential and capital needs for the business.
- Dividend yield stability: A steady or gradually rising yield can provide a floor for investors during uncertain markets.
- Payout policy: Consistency in payout ratios signals financial discipline and confidence in future cash generation.
- Capital allocation: Buybacks and debt management influence equity value and margin of safety for investors.
Infosys Quarterly Results Analysis: Reading The Numbers For Stock Movement
Infosys Quarterly Results are among the most immediate drivers of near-term price action. Investors should focus on revenue growth, operating margins, and free cash flow, as these indicators shed light on the company’s ability to fund dividends, buybacks, and strategic investments. Commentary around client wins, vertical strength (for instance, digital services, cloud, and automation), and geographic mix provides color on the sustainability of earnings momentum. A quarterly miss can trigger a price downgrade, while a beat with strong guidance often fuels a rally and the potential re-rating of the stock.
To translate quarterly results into actionable decisions, track year-over-year growth and sequential trends, not just one-off beats. Compare performance across regions and service lines to identify where the driver of growth is strongest. In an environment where multiple IT peers are competing for large deals, Infosys stock price can hinge on management’s ability to communicate a clear, executable plan for sustaining profitability, accelerating digital adoption, and managing costs effectively. The result for the patient investor is clarity on whether the stock deserves a premium for growth or whether the current price already reflects the advanced stage of execution.
- Top-line and margin trajectory: Look for sustainable expansion rather than a single-quarter spike.
- Operational efficiency: Free cash flow generation supports dividends and capital returns.
- Guidance and outlook: Management commentary on client activity, horizontal growth, and vertical momentum is critical.
Infosys Annual Report Insights: Strategy, Growth, And Long-Term Valuation
The Infosys Annual Report offers a comprehensive view of strategic priorities, risk factors, and capital allocation that shape multi-year returns. Investors should study growth programs in digital services, AI-enabled offerings, cloud infrastructure, and automation, as these are tied to long-term revenue resilience. The annual report also outlines risk exposures–competitive dynamics, regulatory changes, currency movements, and execution risk–helping investors calibrate the probability of downside surprises. By connecting near-term earnings performance with long-term strategic positioning, retail investors can form a balanced view of fair value and growth potential over multiple years.
Beyond numbers, the annual report communicates governance standards, board oversight, and strategic priorities that influence capital deployment and risk management. Keeping an eye on management commentary regarding price realization, client diversification, and innovation investments can provide early signals about the durability of Infosys’ growth story. When combined with dividend signals and quarterly performance, the annual report becomes a powerful tool for assessing long-run value creation in India's technology sector.
For deeper research on your own terms, try Swastika's Sarthi AI stock assistant to tailor insights on Infosys stock price movements, dividend events, and quarterly results that align with your portfolio strategy.
Related Reads
- Infosys Stock Price Signals And Market Moves: Nifty Ends Lower As IT Leads
- Infosys Stock Price And Q1 FY27 Earnings: A Sector-Wide Roundup For Retail Investors
- Infosys Share Price Today: A Practical Guide For Retail Investors
Frequently Asked Questions
What is the current Infosys stock price?
Infosys stock price changes in real time during market hours. Check your trading platform or a live quote feed for the latest price.
How did Vishal Sikka's resignation affect Infosys stock price?
Leadership changes can impact sentiment temporarily. The stock's reaction around leadership announcements varies by context and market conditions.
What is the difference between Infosys stock price and Infosys NSE stock?
Infosys stock price refers to the company's price on any exchange, while Infosys NSE Stock specifically refers to the price on the National Stock Exchange of India.
When does Infosys pay dividends and where can I find Infosys dividend data?
Infosys pays quarterly dividends; exact dates and amounts are announced on Infosys' investor relations page and stock exchange filings.
Where can I read Infosys annual report for detailed financial data?
Infosys' annual report is available on the Infosys investor relations portal and the stock exchange filings database.
Conclusion
Retail investors should view Infosys stock price as the intersection of fundamentals and market mood. By focusing on long-term growth drivers, dividend potential, and a disciplined approach to price action, you can build a resilient allocation in Indian IT exposure even as near-term moves remain choppy. The price tells a story, but the story is best understood when you anchor decisions in earnings growth, cash generation, and strategic execution over time.
Open your trading and demat account here
Reference :
1 : Google
Big Budget


Popular Articles





.avif)
.avif)

.avif)



START YOUR INVESTMENT JOURNEY
Get personalized advice from our experts
- Dedicated RM Support
- Smooth and Fast Trading App
