


MedPlus Health Share Price Momentum After Q1FY27: Growth, Margin Pressures, And Store Expansion



Key Takeaways
- Q1FY27 revenue rose to ₹1,880 crore with consolidated net profit of ₹33 crore, down 21.7% YoY from ₹42 crore.
- The quarter added 146 stores to reach 5,476 outlets; franchise stores nearly 12% of the network.
- Nomura maintains Buy with a Rs 1,190 target; valuation around 24x FY27 EV/EBITDA, with implied 30x FY27 and 22x FY28 EV/EBITDA.
- MedPlus Health share price fell 15.83% to ₹667.95 after the results, reflecting cost and margin pressures.
If you're tracking medplus health share price, Q1FY27 results reveal a mixed bag of revenue growth and margin headwinds as MedPlus Health Services presses ahead with rapid store expansion. Revenue rose to ₹1,880 crore, up 21.9% YoY, while consolidated net profit came in at ₹33 crore, down 21.7% from ₹42 crore in the year-ago quarter. These figures set the stage for assessing whether the expansion-led model can translate into sustainable earnings, especially as costs rise in non-pharmacy overhead and salaries.
The quarter also showed a robust topline performance across segments: gross profit rose 14% YoY, while gross margin declined by 163 basis points. Operating EBITDA declined 11% YoY, and was about 29% below Nomura's estimates. The company expanded its store network by adding 146 stores in the quarter, taking the total to 5,476 outlets, with franchise stores accounting for nearly 12% of the network. Franchise revenue contribution rose to 5.4% of pharmacy revenue in Q1FY27 from 2.5% a year ago, underscoring a gradual shift toward a mixed model with more franchised avenues.
MedPlus Health Share Price Momentum After Q1FY27 Results
Revenue growth remained healthy at 22% YoY, with branded pharma leading growth at 20%, branded non-pharma at 17%, and private label pharma at 30%. Mature pharmacy network grew 12% YoY, while private label growth was 2% YoY. Private label contribution to own-store revenue stood at 11.5% in Q1FY27, down from 13.4% in Q1FY26, contributing to a gross margin decline attributed to lower private label contribution and a higher share of franchise sales, which weighed on margins by roughly 120 basis points and around 50 basis points, respectively.
MedPlus Health Share Price Valuation And Nomura Target Price Insights
Valuation context places MedPlus at around 24x FY27 estimated EV/operating EBITDA. Nomura's implied multiples are 30x FY27 EV/operating EBITDA and 22x FY28 EV/operating EBITDA. The broker's Buy rating comes with a target price of Rs 1,190, reflecting the long‑term growth potential from its expanding store network and stable supply of branded products.
MedPlus Health Share Price Growth Drivers Across Segments And Store Model
Segment growth data show branded pharma up 20%, branded non-pharma up 17%, and private label pharma up 30%. Franchise revenue contribution, though still modest, has risen to 5.4% of pharmacy revenue in Q1FY27 from 2.5% a year ago. The mature network's 12% YoY growth indicates resilience even as new store openings drive near-term top-line momentum. Private label growth of 2% suggests some rebalancing in product mix, while private label contribution to own-store revenue stands at 11.5% in Q1FY27 versus 13.4% in Q1FY26.
MedPlus Health Share Price Margin Pressures And Cost Structure
Pharmacy salary expenses rose 30% YoY, with per-store salary increases of 14% on a per-store basis. Non-pharmacy overhead climbed 34% YoY, while store expansion added 146 stores in the quarter. The combination of higher payroll and overhead has contributed to margin headwinds, with gross margin down 163 basis points and operating EBITDA down 11% YoY–about 29% below Nomura's estimates.
Management and investors will watch whether rapid store expansion can translate into sustainable earnings growth. Capex plans include two Hyderabad projects. One is a food park with about ₹40 crore of capex, and the other is a concierge health and wellness facility with about ₹115 crore, including around ₹90 crore in capex. These investments signal growth acceleration but require subsequent improvement in profitability to sustain earnings power.
MedPlus Health Share Price Capex Plan And Growth Path For Retail Investors
The focus remains on translating store expansion into earnings leverage over time. The company added 146 stores in the quarter, increasing the total store network to 5,476 outlets. The franchise share, at nearly 12% of the network, and the franchise revenue contribution of 5.4% of pharmacy revenue, highlight a diversified growth engine beyond traditional company-operated stores. The longer-term growth potential stems from a balanced mix of branded and private-label products, supported by capex in Hyderabad projects and wellness facility expansions.
For deeper stock-level insights, consult Swastika's Sarthi AI stock assistant.
Frequently Asked Questions
What were MedPlus Health's Q1FY27 revenue and net profit?
Revenue was ₹1,880 crore and consolidated net profit was ₹33 crore for Q1FY27.Net profit declined 21.7% YoY from ₹42 crore in Q1FY26.
How did MedPlus Health's Q1FY27 revenue grow YoY?
Revenue grew 21.9% YoY to ₹1,880 crore, up from ₹1,543 crore in Q1FY26.
How many stores were added in Q1FY27 and what is the total store network?
146 stores were added in the quarter, taking the total store network to 5,476 outlets. Franchise stores accounted for nearly 12% of the network.
What is Nomura's view on MedPlus Health and its target price?
Nomura maintained Buy rating with a target price of Rs 1,190. Valuation context shows around 24x FY27 estimated EV/EBITDA; Nomura's implied multiples are 30x FY27 EV/EBITDA and 22x FY28 EV/EBITDA.
What capex plans has MedPlus announced?
MedPlus announced capex for two Hyderabad projects. Food Park capex around ₹40 crore and Concierge health and wellness facility capex around ₹115 crore, including about ₹90 crore in capex.
What were the segment growth figures for MedPlus Health in Q1FY27?
Segment growth: branded pharma 20%, branded non-pharma 17%, private label pharma 30%. Mature pharmacy network growth was 12% YoY; private label growth was 2% YoY. Private label contribution to own-store revenue stood at 11.5% in Q1FY27 vs 13.4% in Q1FY26.
Conclusion
In the near term, MedPlus Health's expansion-led growth faces margin pressure from higher salaries and overhead, even as topline growth remains robust. For retail investors, the key question is whether the higher store count and a diversified revenue mix can translate into sustainable earnings growth at current valuations, which sit around 24x FY27 EV/EBITDA based on Nomura's framework. A disciplined approach to entry–focused on margin improvement and cash flow generation–may help investors capitalize on the long-run potential of a 5,476-store network with a growing private-label share.
Next steps for investors: monitor margin recovery, store-level profitability, and capex efficiency while using tools like Swastika's Sarthi AI stock assistant for ongoing analysis; with the right discipline, the long-term growth story could unlock substantial upside as the network scales.
Open your trading and demat account here
Reference :
1 : Economictimes
Latest Articles
MedPlus Health Share Price Momentum After Q1FY27: Growth, Margin Pressures, And Store Expansion


Key Takeaways
- Q1FY27 revenue rose to ₹1,880 crore with consolidated net profit of ₹33 crore, down 21.7% YoY from ₹42 crore.
- The quarter added 146 stores to reach 5,476 outlets; franchise stores nearly 12% of the network.
- Nomura maintains Buy with a Rs 1,190 target; valuation around 24x FY27 EV/EBITDA, with implied 30x FY27 and 22x FY28 EV/EBITDA.
- MedPlus Health share price fell 15.83% to ₹667.95 after the results, reflecting cost and margin pressures.
If you're tracking medplus health share price, Q1FY27 results reveal a mixed bag of revenue growth and margin headwinds as MedPlus Health Services presses ahead with rapid store expansion. Revenue rose to ₹1,880 crore, up 21.9% YoY, while consolidated net profit came in at ₹33 crore, down 21.7% from ₹42 crore in the year-ago quarter. These figures set the stage for assessing whether the expansion-led model can translate into sustainable earnings, especially as costs rise in non-pharmacy overhead and salaries.
The quarter also showed a robust topline performance across segments: gross profit rose 14% YoY, while gross margin declined by 163 basis points. Operating EBITDA declined 11% YoY, and was about 29% below Nomura's estimates. The company expanded its store network by adding 146 stores in the quarter, taking the total to 5,476 outlets, with franchise stores accounting for nearly 12% of the network. Franchise revenue contribution rose to 5.4% of pharmacy revenue in Q1FY27 from 2.5% a year ago, underscoring a gradual shift toward a mixed model with more franchised avenues.
MedPlus Health Share Price Momentum After Q1FY27 Results
Revenue growth remained healthy at 22% YoY, with branded pharma leading growth at 20%, branded non-pharma at 17%, and private label pharma at 30%. Mature pharmacy network grew 12% YoY, while private label growth was 2% YoY. Private label contribution to own-store revenue stood at 11.5% in Q1FY27, down from 13.4% in Q1FY26, contributing to a gross margin decline attributed to lower private label contribution and a higher share of franchise sales, which weighed on margins by roughly 120 basis points and around 50 basis points, respectively.
MedPlus Health Share Price Valuation And Nomura Target Price Insights
Valuation context places MedPlus at around 24x FY27 estimated EV/operating EBITDA. Nomura's implied multiples are 30x FY27 EV/operating EBITDA and 22x FY28 EV/operating EBITDA. The broker's Buy rating comes with a target price of Rs 1,190, reflecting the long‑term growth potential from its expanding store network and stable supply of branded products.
MedPlus Health Share Price Growth Drivers Across Segments And Store Model
Segment growth data show branded pharma up 20%, branded non-pharma up 17%, and private label pharma up 30%. Franchise revenue contribution, though still modest, has risen to 5.4% of pharmacy revenue in Q1FY27 from 2.5% a year ago. The mature network's 12% YoY growth indicates resilience even as new store openings drive near-term top-line momentum. Private label growth of 2% suggests some rebalancing in product mix, while private label contribution to own-store revenue stands at 11.5% in Q1FY27 versus 13.4% in Q1FY26.
MedPlus Health Share Price Margin Pressures And Cost Structure
Pharmacy salary expenses rose 30% YoY, with per-store salary increases of 14% on a per-store basis. Non-pharmacy overhead climbed 34% YoY, while store expansion added 146 stores in the quarter. The combination of higher payroll and overhead has contributed to margin headwinds, with gross margin down 163 basis points and operating EBITDA down 11% YoY–about 29% below Nomura's estimates.
Management and investors will watch whether rapid store expansion can translate into sustainable earnings growth. Capex plans include two Hyderabad projects. One is a food park with about ₹40 crore of capex, and the other is a concierge health and wellness facility with about ₹115 crore, including around ₹90 crore in capex. These investments signal growth acceleration but require subsequent improvement in profitability to sustain earnings power.
MedPlus Health Share Price Capex Plan And Growth Path For Retail Investors
The focus remains on translating store expansion into earnings leverage over time. The company added 146 stores in the quarter, increasing the total store network to 5,476 outlets. The franchise share, at nearly 12% of the network, and the franchise revenue contribution of 5.4% of pharmacy revenue, highlight a diversified growth engine beyond traditional company-operated stores. The longer-term growth potential stems from a balanced mix of branded and private-label products, supported by capex in Hyderabad projects and wellness facility expansions.
For deeper stock-level insights, consult Swastika's Sarthi AI stock assistant.
Frequently Asked Questions
What were MedPlus Health's Q1FY27 revenue and net profit?
Revenue was ₹1,880 crore and consolidated net profit was ₹33 crore for Q1FY27.Net profit declined 21.7% YoY from ₹42 crore in Q1FY26.
How did MedPlus Health's Q1FY27 revenue grow YoY?
Revenue grew 21.9% YoY to ₹1,880 crore, up from ₹1,543 crore in Q1FY26.
How many stores were added in Q1FY27 and what is the total store network?
146 stores were added in the quarter, taking the total store network to 5,476 outlets. Franchise stores accounted for nearly 12% of the network.
What is Nomura's view on MedPlus Health and its target price?
Nomura maintained Buy rating with a target price of Rs 1,190. Valuation context shows around 24x FY27 estimated EV/EBITDA; Nomura's implied multiples are 30x FY27 EV/EBITDA and 22x FY28 EV/EBITDA.
What capex plans has MedPlus announced?
MedPlus announced capex for two Hyderabad projects. Food Park capex around ₹40 crore and Concierge health and wellness facility capex around ₹115 crore, including about ₹90 crore in capex.
What were the segment growth figures for MedPlus Health in Q1FY27?
Segment growth: branded pharma 20%, branded non-pharma 17%, private label pharma 30%. Mature pharmacy network growth was 12% YoY; private label growth was 2% YoY. Private label contribution to own-store revenue stood at 11.5% in Q1FY27 vs 13.4% in Q1FY26.
Conclusion
In the near term, MedPlus Health's expansion-led growth faces margin pressure from higher salaries and overhead, even as topline growth remains robust. For retail investors, the key question is whether the higher store count and a diversified revenue mix can translate into sustainable earnings growth at current valuations, which sit around 24x FY27 EV/EBITDA based on Nomura's framework. A disciplined approach to entry–focused on margin improvement and cash flow generation–may help investors capitalize on the long-run potential of a 5,476-store network with a growing private-label share.
Next steps for investors: monitor margin recovery, store-level profitability, and capex efficiency while using tools like Swastika's Sarthi AI stock assistant for ongoing analysis; with the right discipline, the long-term growth story could unlock substantial upside as the network scales.
Open your trading and demat account here
Reference :
1 : Economictimes

Nifty Pharma Stock List: Market Triggers For Investors
Key Takeaways
- On July 22, 2026, Nifty and Sensex slipped about half a percent as three catalysts converged, impacting the nifty pharma stock list.
- Nifty 50 closed at 24,048 and Sensex at 76,988, with intraday lows of 24,008.20 and 76,851 respectively.
- Nifty Pharma index declined 1.32% in early trade at 25,747.60, with all 19 pharma stocks trading lower.
- Brent crude rose to $91.51 and WTI to $84.64 as tariff talk and geopolitical tensions weighed on sentiment.
Three catalysts collided on July 22, 2026, pushing Indian equities lower as the nifty pharma stock list wobbled under tariff talk and global tensions. The day unfolded with a sequence of events that tested risk appetite and exposed sector-specific vulnerabilities. For retail investors, understanding these drivers helps calibrate exposure to the nifty pharma stock list and other risk assets.
Key Market Snapshot For July 22, 2026
| Metric | Value |
|---|---|
| Nifty 50 Close (July 22) | 24,048 |
| Sensex Close (July 22) | 76,988 |
| Nifty Smallcap 250 Movement | Down About 1% |
| Nifty Midcap 150 Movement | Down About 0.68% |
| Nifty Pharma Index (Early Trade) | Down 1.32% at 25,747.60 |
| Pharma Constituents | All 19 trading lower |
| Nifty 50 Intraday Low | 24,008.20 (as of 10:10 am) |
| Sensex Intraday Low | 76,851 (as of 10:10 am) |
| Brent Crude | US$91.51 per barrel |
| WTI Crude | US$84.64 per barrel |
| US Generics Tariffs | Zero tariffs for two years; 100% in year three; 200% thereafter |
Geopolitical context added to price action: US CENTCOM completed the 11th night of strikes on Iran, targeting military operations centres, maritime capabilities, aircraft hangars, drone storage facilities and logistics infrastructure. The broader war effort against Tehran is shown as costing US$37.5 billion so far.
Within the market, the direction was also shaped by sector breadth: the Nifty Smallcap 250 moved lower by about 1%, while the Nifty Midcap 150 slipped roughly 0.68%. The Nifty Pharma index itself faced pressure, with all 19 constituents trading in the red.
Under the proposed US framework for generics, imported drugs will continue to attract zero tariffs for the next two years. However, tariffs could rise to 100% in the third year and 200% thereafter, to incentivise US-based production facilities. This policy backdrop adds to the risk premium in the pharma space and helps explain the broad-based weakness in the nifty pharma stock list.
To illustrate the context of the day, consider the currency/commodity backdrop: Brent at $91.51 and WTI at $84.64 per barrel. The intraday market narrative also included tension related to Iran's strikes against US facilities in Bahrain, Kuwait and Jordan – a reminder that geopolitics remain a potent driver of risk-taking, even in a diversified domestic equity complex.
Fresh Strikes From US And How They Affected Indian Markets
The three reasons highlighted for the market fall are anchored in the same three forces: Fresh Strikes from US, Crude Rises Again, and Pharma's Tariff Threat. The immediate market reaction was risk-off across equities, with cyclical and defensives alike feeling the pull. The intraday movement showed the Nifty 50 dropping to as low as 24,008.20, and the Sensex slipping to 76,851 at around 10:10 am, underscoring how quickly sentiment shifted when geopolitics intersects energy prices and policy signals.
In the pharmaceutical space, the pressure was sharper: the nifty pharma stock list faced a crosshair of tariff uncertainty and global pricing dynamics. The Nifty Pharma index fell 1.32% in early trade, with all 19 constituents trading in the red, even as several large blue-chips in the sector kept headlines active for longer-term investors. The day’s data make clear that pharma risk is not isolated to one stock; it is a sector-wide reflection of policy risk and global price movements.
Oil Prices Rise Again: What It Means For Indian Markets
Oil remains a key variable for Indian macro and corporate earnings. On July 22, Brent crude traded at $91.51 per barrel, up 0.55%, while US WTI crude rose 0.36% to $84.64 per barrel. A higher oil regime tends to flow through to energy costs, inflation expectations and debt-servicing costs, which can compress equity valuations, especially in growth-sensitive sectors such as technology and consumer discretionary. For the pharma space, higher energy costs indirectly influence manufacturing and supply chain economics, while for the overall market, crude's rise can widen risk-off bets when geopolitics loom large.
The fresh strikes from US actions in the Middle East, combined with the persistent energy complex, contribute to a volatile backdrop for the nifty pharma stock list. The day’s intraday dynamics illustrate how quickly sector leadership can shift from one area to another as macro variables interact with policy signals. Investors should watch how energy prices feed into global inflation expectations and domestic earnings for pharma companies and suppliers along the value chain.
Pharma's Tariff Threat And Its Implications For The Nifty Pharma Stock List
The tariffs on imported generic medicines embody a policy risk that could reprice the pharma sector. The proposed framework allows zero tariffs on generics for the next two years, but tariffs could rise to 100% in year three and eventually 200% thereafter. The policy aims to incentivise pharmaceutical manufacturers to establish production facilities in the US, a move that could alter global supply chains and pricing dynamics. For the nifty pharma stock list, this could either pad margins for some players that are well positioned to localize production or squeeze margins for those relying on import- or export-led models. Investors should consider how each company’s supply chain and hedging strategies are positioned to respond to tariff risk and the direction of US policy on generics.
As a backdrop, the day’s price action in early trade – with the nifty pharma index down 1.32% at 25,747.60 and all 19 constituents in the red – underscores the sensitivity of Indian pharma players to global policy signals. The sensitive nature of policy risk means investors should prepare for the possibility of further volatility around tariff announcements and blue-sky policy proposals, particularly for players with higher import exposure or greater dependence on US pricing.
Stocks To Watch In The Nifty Pharma Stock List
Within the nifty pharma stock list, the watchlist often includes large-cap names whose stock price movements can influence the broader sector. Consider the stock price of sun pharma, cipla limited stock price, lupin ltd stock price, aurobindo pharma stock price, and dr reddy's stock. These five names can provide a sense for sector breadth and for how policy changes or global cues might translate into the price action you observe in the Nifty Pharma index. For real-time insights into these names, you can consult Swastika's Sarthi AI stock assistant: Swastika's Sarthi AI stock assistant.
Frequently Asked Questions
What caused the market to slide on July 22, 2026?
The day was driven by three catalysts: Fresh Strikes from US, Crude Rises Again, and Pharma's Tariff Threat, amid geopolitical tensions and energy dynamics that raised risk-off concerns.
How did the Nifty Pharma stock list perform on that day?
The Nifty Pharma index declined 1.32% in early trade to 25,747.60, with all 19 pharma constituents trading in the red.
What were the intraday lows for Nifty 50 and Sensex on July 22, 2026?
Nifty 50 intraday low was 24,008.20 and Sensex intraday low was 76,851 as of 10:10 am.
What tariffs were proposed for US generic drugs?
Zero tariffs for the next two years, then tariffs could rise to 100% in year three and 200% thereafter, to incentivise US-based production facilities.
Where can investors get deeper stock insights into the Nifty Pharma stock list?
Explore deeper analysis with Swastika's Sarthi AI stock assistant:Swastika's Sarthi AI stock assistant.
Conclusion
July 22, 2026 was a teaching moment for traders and retail investors alike. The nifty pharma stock list did not move in isolation; it reflected a confluence of policy risk, geopolitical tension and energy price dynamics that can quickly alter risk appetites for the sector and the broader market. The practical takeaway is to treat sector-specific headlines and macro signals as coupled risk drivers, rather than standalone triggers. Investors should adjust their risk budgets, ensure proper diversification, and maintain a framework for monitoring pharma policy signals relative to energy and geopolitical developments.
As a next step, build a simple mental model: scenario planning around three catalysts–Fresh Strikes From US, Crude Rises, and Pharma Tariff Threat–and use hedges or position-sizing to manage potential drawdowns in your portfolio. For ongoing stock analysis, the Sarthi AI stock assistant can help you compare the nifty pharma stock list’s components and test ideas before taking action.
Open your trading and demat account here
Reference :
1 : Ndtvprofit
Crisil Share Price: GenAI Growth And Q2 CY26 Highlights
Key Takeaways
- crisil share price moved to Rs 4452.25 after a 3.49% gain on Q2 CY26 results.
- Consolidated net profit rose 26.2% YoY to Rs 216.5 crore on income from operations of Rs 1,075.4 crore, up 27.6%.
- crisil ratings segment revenue grew 21.4% YoY to Rs 305.12 crore in Q2 2026.
- Crisil is majority owned by S&P Global and is investing in GenAI to drive future growth.
Crisil Share Price Snapshot And Q2 CY26 Market Reaction
Investors watch crisil share price move to Rs 4452.25 and rise 3.49% after Crisil reported a robust Q2 CY26 performance. Consolidated net profit rose 26.2% YoY to Rs 216.5 crore on a 27.6% increase in income from operations to Rs 1,075.4 crore in Q2 CY26 as compared with Q2 CY25. Profit before tax stood at Rs 279.8 crore, up 24.4% YoY; net foreign exchange movement resulted in a loss of Rs 8.2 crore in Q2 2026 vs a loss of Rs 6.6 crore in Q2 2025. The market reaction reflects a mix of earnings momentum and a continued shift toward services-driven analytics in Crisil's portfolio.
Crisil Earnings And Revenue Growth In Q2 CY26
Consolidated net profit: Rs 216.5 crore; up 26.2% YoY. Income from operations: Rs 1,075.4 crore; up 27.6% YoY. Profit before tax: Rs 279.8 crore; up 24.4% YoY. Net foreign exchange movement: loss of Rs 8.2 crore in Q2 2026 vs a loss of Rs 6.6 crore in Q2 2025. These figures are crisil earnings for the quarter and highlight Crisil's ability to grow across its core and new lines of business, even in a volatile macro environment.
Crisil Ratings Momentum And Segment Growth
crisil ratings segment revenue grew 21.4% YoY to Rs 305.12 crore in Q2 2026, underscoring continued demand for rating services across sectors. Crisil Coalition Greenwich saw momentum in corporate and investment banking and continued traction in commercial banking. Crisil Intelligence saw continued demand for data analytics, consulting, and credit and risk solutions. Together, these pillars illustrate Crisil's diversified revenue mix and its ability to harvest growth across traditional ratings and advanced analytics.
GenAI Momentum And Crisil's Growth Outlook
Amid a volatile macroeconomic and geopolitical environment, Crisil has reinforced its GenAI focus to convert opportunities into long-term growth.
This is a signal that the strategy is not just about short-term gains but building a scalable platform for analytics-led growth that leverages GenAI across Crisil's multiple business lines.According to Amish Mehta of Crisil, “Our Q2 2026 performance reflects continued growth momentum and disciplined execution of our strategic priorities. Despite a volatile and challenging macroeconomic and geopolitical environment, we delivered growth across both our domestic and international businesses. As clients step up investments in GenAI, we are focused on leveraging our domain-led GenAI capabilities and future-ready talent to convert this opportunity into long-term growth.”
Reference :
Crisil Ownership And Global Backing
Crisil is majority owned by S&P Global, a fact that anchors its credibility and access to global methodologies and markets. The company operates as a global, insights-driven analytics firm with capabilities spanning Crisil Ratings, Crisil Intelligence, Crisil Coalition Greenwich, and Crisil Integral IQ; with activities across the Americas, Asia-Pacific, Europe, Australia and the Middle East. This global backing helps Crisil expand its footprint while maintaining rigorous, domain-specific research and risk assessment capabilities.
Credit Market Trends And The Big Picture For Retail Investors
Bank credit remained robust at 17.7% as of May 2026 compared to 9.0% as of May 2025, suggesting a supportive environment for Crisil's growth in financial services analytics and credit risk solutions. Credit to large corporates rebounded to 14.4%, while that to NBFCs remained the key driver of services sector credit growth. Yields on corporate bonds remained elevated, which contributed to a 25.7% YoY decline in issuance by value in Q2 2026; the number of issuers was down 15.3%; issuances were down 12.9%. These macro trends influence Crisil's advisory and ratings workflows as clients recalibrate risk and funding strategies. For investors, this backdrop underscores the continued relevance of Crisil's analytics in evaluating credit quality, ratings, and risk across sectors.
Stock Price Momentum, Market Signals, And Investor Takeaways
From a retail-investor perspective, Crisil's Q2 CY26 results reinforce a narrative of resilience and growth in analytics-driven services. The 3.49% rise in the crisil share price to Rs 4452.25, supported by a 26.2% YoY profit uplift and a 27.6% rise in income from operations, suggests the market is pricing in Crisil's ability to monetize GenAI opportunities and expand its data-intensive offerings. The strong performance of the ratings segment (21.4% YoY growth) adds further validation that Crisil's core capabilities remain in high demand even as the business mix evolves. A diversified earnings profile, plus a credible ownership structure with S&P Global, positions Crisil to weather macro headwinds and capitalize on GenAI-driven analytics opportunities. As always, a disciplined approach to growth, balance sheet quality, and a clear strategic roadmap are essential for long-term investors. If you want a deeper, data-driven read on Crisil's growth drivers and how to map them to your portfolio, consider using Swastika's Sarthi AI stock assistant for institutional-grade stock research [link provided below].
For a structured, side-by-side view of the quarter's key metrics, you can refer to the summary table below. It highlights the headline figures and YoY changes that underpin the stock's price action. This snapshot helps investors compare Crisil's Q2 CY26 performance with the prior-year period and understand where the company is gaining momentum across its business lines.
| Metric | Q2 CY26 | YoY Change |
|---|---|---|
| Consolidated net profit | Rs 216.5 crore | +26.2% |
| Income from operations | Rs 1,075.4 crore | +27.6% |
| Profit before tax | Rs 279.8 crore | +24.4% |
| Net forex movement | loss Rs 8.2 crore | – |
| Ratings services segment revenue | Rs 305.12 crore | +21.4% |
Key macro and sector trends to watch include robust bank credit growth, elevated corporate-bond yields, and continued demand for data analytics and risk-solutions. Crisil's multi-pronged growth engine–ratings, analytics, intelligence, and Greenwich-relevant services–positions it to benefit from both conventional rating workflows and the GenAI-enabled analytics frontier. If you’re evaluating Crisil as a potential investment, consider the stock's price reaction in light of these fundamentals and how GenAI investments could translate into longer-term earnings acceleration.
Frequently Asked Questions
What were Crisil's Q2 CY26 earnings and revenue?
Consolidated net profit: Rs 216.5 crore; Income from operations: Rs 1,075.4 crore; Year-over-year changes were +26.2% and +27.6% respectively. Profit before tax was Rs 279.8 crore, up 24.4% YoY.
What is Crisil's relationship with S&P Global?
Crisil is majority owned by S&P Global.
What was Crisil's stock price move after the Q2 CY26 results?
Crisil share price moved to Rs 4452.25 after a 3.49% gain following the Q2 CY26 results.
How did Crisil's Ratings segment perform in Q2 2026?
crisil ratings segment revenue grew 21.4% YoY to Rs 305.12 crore in Q2 2026.
What GenAI-related guidance did Crisil provide for growth?
Amid GenAI momentum, Crisil highlighted leveraging domain-led GenAI capabilities and future-ready talent to convert opportunities into long-term growth, as stated by Crisil's leadership.
Conclusion
In a market where GenAI is turning from ambition into execution, Crisil’s Q2 CY26 results offer a practical signal for retail investors: growth across traditional analytics, ratings, and new data-driven services remains intact, and the company is actively harnessing GenAI to broaden its value proposition. The crisil share price reaction reflects this mix of earnings momentum and strategic positioning, underpinned by S&P Global ownership that lends credibility and scale to Crisil’s model. The next step for a thoughtful investor is to test this narrative against a disciplined framework–check margins, segment growth, and the potential uplift from GenAI-enabled offerings as you assess a long‑term allocation.
Indiamart Intermesh Share Price After Q1FY27 Profit Rise: A Retail Investor's Deep Dive
Key Takeaways
- indiamart intermesh share price moved lower despite a 12.2% rise in Q1 net profit to Rs 172 crore.
- Revenue from operations rose 11.4% to Rs 414 crore, with web services contributing Rs 375.9 crore and accounting software Rs 38.5 crore.
- Analysts show mixed calls: 10 Buy, 2 Hold, 6 Sell; average 12-month target Rs 2,095.11 implying 14.9% upside.
- Intraday moves included opening at Rs 1,907, intraday low Rs 1,773, and around Rs 1,810.20 at 10:10 AM.
Indiamart Intermesh Share Price After Q1FY27: What Moved The Market
indiamart intermesh share price movements often reflect a tug-of-war between earnings momentum and market sentiment. In Q1FY27, Indiamart Intermesh Ltd reported a consolidated net profit rise of 12.2% to Rs 172 crore for the June quarter, while revenue from operations climbed 11.4% to Rs 414 crore. Yet, the indiamart intermesh stock tumbled over 7% in intraday trades, underscoring how investors weigh growth against valuation and guidance. The stock's intraday action contrasted with the Nifty 50's modest 0.59% decline, highlighting dispersion in stock-specific moves.
| Time (IST) | Price (Rs) | Change |
|---|---|---|
| Open | Rs 1,907 | −0.57% |
| Intraday Low | Rs 1,773 | −7.56% |
| 10:10 AM | Rs 1,810.20 | −5.62% |
Q1FY27 Earnings And Margin Data: A Closer Look
The quarter showed a 12.2% rise in consolidated net profit to Rs 172 crore to Rs 172 crore, up from Rs 153.5 crore in the year-ago period. Revenue from operations rose 11.4% to Rs 414 crore, versus Rs 372 crore a year ago. EBITDA (GU) grew 9.7% YoY to Rs 147 crore, up from Rs 134 crore, while EBITDA margin stood at 35.4%, slightly below the 35.9% seen in the prior year.
Other income increased to Rs 107 crore from Rs 92 crore, contributing to the overall earnings strength. These metrics reflect a company that is expanding top-line growth while maintaining a stable margin profile despite some expansion in other income streams.
Revenue Mix And Segment Focus: Web Services And Accounting Software
Revenue from Web and related services was Rs 375.9 crore, while accounting software services contributed Rs 38.5 crore. This mix highlights the company’s reliance on its Web services platform, even as software services provide a steady contribution to profitability. The composition underscores the importance of maintaining a robust platform ecosystem to sustain growth in a competitive B2B marketplace.
The market mood around indiamart intermesh stock also reflected an intra-day dynamic: 0.11 times its 30-day average traded volume, and RSI stood at 51.56, indicating neither overbought nor oversold territory in that moment.
Out of 18 analysts tracking the company, 10 maintained a Buy, 2 held, and 6 recommended Sell, according to Bloomberg data. The average 12-month consensus price target of Rs 2,095.11 implies an upside of 14.9% from current levels, suggesting some upside potential anchored in earnings growth and market positioning.
For deeper stock insights, explore Swastika's Swastika's Sarthi AI stock assistant.
What The Market Is Saying About The Indiamart Intermesh Share Price Target
The collective consensus price target provides a rough gauge for upside potential, with the 12-month target at Rs 2,095.11 signaling about a 14.9% appreciation from current levels. Investors should note that this target can shift as earnings trajectories, competitive dynamics, and macro conditions evolve, particularly in the Indian B2B e-commerce landscape where Indiamart Intermesh operates.
Why The Q1FY27 Results Look Mixed On The Surface
Even though profit improved and revenue grew, investors may be weighing valuation and future growth momentum against the current share price. The 12.2% profit rise is meaningful, but it must be interpreted with margins that held steady (EBITDA margin at 35.4% vs 35.9% YoY) and with the understanding that other income rose to Rs 107 crore from Rs 92 crore–an element that could reflect one-off or non-operating gains. The share price reaction, therefore, may reflect a combination of valuation expectations, market volatility, and the pace of growth in Web services and software offerings.
Frequently Asked Questions
What happened to the indiamart intermesh stock after the Q1FY27 results?
The indiamart intermesh stock moved lower, tumbling over 7% intraday even as Q1FY27 consolidated net profit rose 12.2% to Rs 172 crore and revenue grew 11.4% to Rs 414 crore.
What were the Q1FY27 numbers for Indiamart Intermesh?
Q1FY27 consolidated net profit rose 12.2% to Rs 172 crore; revenue from operations climbed 11.4% to Rs 414 crore; EBITDA stood at Rs 147 crore with an EBITDA margin of 35.4%.
What is the indiamart intermesh share price target according to the latest consensus?
The average 12-month consensus price target is Rs 2,095.11, implying an upside of 14.9% from current levels.
How did analysts rate Indiamart Intermesh after the results?
Out of 18 analysts, 10 recommended buying, 2 held, and 6 suggested selling the stock.
What were the intraday price moves mentioned in the report?
The stock opened at Rs 1,907, fell to as low as Rs 1,773, and was around Rs 1,810.20 at 10:10 AM, showing a 5.62% decline at that time.
Conclusion
Disclaimer: This analysis uses the numbers reported for Q1FY27 and the associated market data as plain market facts. Investors should conduct their own due diligence and consider consultation with a financial advisor before trading decisions.
Open your trading and demat account here
Reference :
1 : Ndtvprofit
Nestle India Share Price Momentum After Q1 Results: A Retail Investor's Guide
Key Takeaways
- Consolidated net profit rose 48% YoY to Rs 958.7 crore; revenue from operations rose 25% YoY to Rs 6,378.2 crore.
- Standalone PAT rose 47.9% to Rs 975.1 crore; total sales rose 6,363.3 crore with 25.4% YoY growth.
- Domestic sales grew 25% and exports grew 35.6%, with advertising spends up over 40% and EBITDA margin at 24.2%.
- Nestle India's stock rose 3.3% to Rs 1,500 post-earnings and has gained 15.9% in 2026, versus a -7.5% for the Nifty 50.
nestle india share price is in focus today as Nestle India reports a blockbuster Q1: consolidated net profit rose 48% year-on-year to Rs 958.7 crore, while revenue from operations rose 25% year-on-year to Rs 6,378.2 crore. Standalone Q1 profit after tax rose 47.9% to Rs 975.1 crore. The total sales grew 25.4% year-on-year to Rs 6,363.3 crore, signaling broad-based momentum across portfolios.
Growth drivers include solid volume expansion, a robust export performance despite geopolitical headwinds, and a marked uptick in advertising spends–up more than 40% year-on-year. The company highlighted strong momentum across segments such as milk products, nutrition, beverages, and prepared dishes, with KitKat continuing to gain market share and Nespresso expanding its retail footprint in Delhi-NCR, Mumbai and Bengaluru.
Investors reacted to the earnings with a positive tilt: shares rose 3.3% to Rs 1,500 in late morning trade. Year-to-date, the stock has surged about 15.9% in 2026, while the Nifty 50 has declined about 7.5% in the same period.
| Metric | Value |
|---|---|
| Consolidated Net Profit | Rs 958.7 crore |
| Consolidated Revenue | Rs 6,378.2 crore |
| Standalone PAT | Rs 975.1 crore |
| Total Sales | Rs 6,363.3 crore |
| Domestic Sales Growth | 25% |
| Exports Growth | 35.6% |
| Advertising Spend Growth | Over 40% |
| EBITDA Margin | 24.2% |
| Earnings Per Share | Rs 5.06 |
| Stock Price (Post-Earnings) | Rs 1,500 |
| YTD Stock Gain | 15.9% |
Nestle India Share Price And Q1 Profit Growth: A 48% Net Profit Jump
Driving the headline numbers, consolidated net profit rose 48% year-on-year to Rs 958.7 crore, while the company posted a 25% year-on-year rise in consolidated revenue to Rs 6,378.2 crore. Standalone Q1 PAT also advanced, up 47.9% to Rs 975.1 crore, with total sales at Rs 6,363.3 crore representing a 6.4% sequential increase from the prior quarter. Domestic sales grew 25% and exports grew 35.6% as global demand supported Nestle India’s growth engine.
The quarter’s drivers are clear: volume growth across portfolios, international demand lifting exports, and a disciplined branding push that saw advertising up more than 40% YoY. The firm maintained a broad-based growth trajectory across segments; KitKat continued to gain market share while beverages, milk products, and nutrition posted sustained double-digit momentum.
For deeper stock-level insights, Swastika's Sarthi AI stock assistant can help you model how these numbers translate into fair value: Swastika's Sarthi AI stock assistant.
Product Segment Momentum: KitKat, Beverages, Milk, And Pet Food Growth
KitKat continued to gain market share, and the powdered and liquid beverages segment posted the 20th consecutive quarter of double-digit growth. Milk products and nutrition benefited from underlying volume growth across key brands such as Milkmaid, while the pet food business delivered strong double-digit growth supported by portfolio expansion and sharper consumer engagement. Nespresso expanded its footprint across Delhi-NCR, Mumbai, and Bengaluru through a mix of retail formats, reinforcing Nestle India’s urban-to-rural reach and omnichannel presence.
Ads and brand investments appear to be a deliberate strategy to sustain growth, with the company noting robust double-digit growth in several core categories and a continued push to deepen distribution in rural markets.
Channel And Geography Trends: Rural Momentum And General Trade Growth
Domestic sales rose 25% for the quarter, underscoring steady demand in India's core markets. Exports grew 35.6% despite ongoing geopolitical headwinds, signaling resilience in the export channel. The general trade channel delivered strong double-digit growth across town classes, with rural markets leading the momentum, highlighting Nestle India’s penetration in tier-2 and tier-3 towns as a key growth driver.
These dynamics reinforce Nestle India’s diversified revenue mix and its ability to convert volume expansion into earnings across different channels and geographies.
Stock Market Reaction And Year-To-Date Performance: How The Market Valued The Quarter
The earnings landed with a positive market response. The stock rose 3.3% to Rs 1,500 in late morning trade, reflecting investor optimism around continued growth across categories and margin resilience. For the year 2026, Nestle India stock has gained 15.9% so far, while the Nifty 50 has fallen 7.5% in the same period, signaling a relative outperformance in the FMCG space.
Related Reads
Frequently Asked Questions
What were Nestle India's consolidated net profit and revenue in the latest quarter?
Consolidated net profit rose 48% year-on-year to Rs 958.7 crore; revenue from operations rose 25% year-on-year to Rs 6,378.2 crore.
How did Nestle India's standalone Q1 profit after tax perform?
Standalone Q1 profit after tax rose 47.9% year-on-year to Rs 975.1 crore.
What growth did Nestle India see domestically and in exports?
Domestic sales grew 25% during the quarter, while exports grew 35.6% despite geopolitical headwinds.
What were the key margins and earnings per share for the quarter?
EBITDA margin stood at 24.2% and earnings per share came in at Rs 5.06.
How did the market react to the earnings and what's the year-to-date performance?
Shares rose 3.3% to Rs 1,500 in late morning trade; the stock has gained 15.9% so far in 2026, while the Nifty 50 is down 7.5%.
Conclusion
In the near term, Nestle India share price momentum will likely hinge on ongoing volume growth, category leadership, and the ability to sustain margin resilience amid macro headwinds. Retail investors should monitor brand investments, cost trends, and cross-channel performance to gauge fair value in a disciplined, long-horizon framework.
Open your trading and demat account here
Reference :
1 : Moneycontrol
DLF Share Price In Focus Amid Sensex Slump: A Retail Investor Guide
Key Takeaways
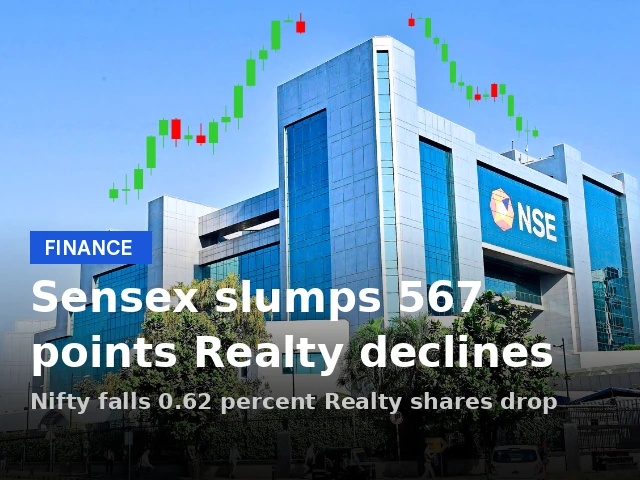
- Sensex slumped 567.30 points to 76,915.95 and Nifty 50 fell to 24,038.10.
- The dlf share price moved lower in mid-session trading as risk-off sentiment took hold.
- Realty peers such as godrej properties stock price, brigade enterprises stock price, sobha developers stock price, sunteck realty stock price, oberoi realty stock, and phoenix mills stock all declined.
- Global markets showed mixed signals with Brent crude at $91.55 and US indices also pulling back; adopt a risk-managed approach and use insights from Swastika's Sarthi AI stock assistant for deeper analysis.
What happens when Sensex slumps by 567 points? For retail investors, a drop of this magnitude is both a warning and a classroom. The dlf share price becomes one of the first signals to track as traders reassess valuations in a real estate–sensitive market. Today’s mid-session tape underlines a broader risk-off mood, where liquidity and sentiment drive quick re-pricing of high beta names. If you’re scanning the tape for signals, start with the broad numbers and then drill into the realty names that moved most sharply.
At 11:28 IST, the barometer index, the S&P BSE Sensex, tumbled 567.30 points or 0.72% to 76,915.95. The Nifty 50 index fell 149.40 points or 0.62% to 24,038.10. The Nifty traded below the 24,050 mark. In the broader market, the BSE 150 MidCap Index fell 1.03% and the BSE 250 SmallCap Index shed 0.32%. The market breadth was weak, with 1,349 shares rising, 2,467 falling, and 237 unchanged on the BSE. These numbers provide a snapshot of selling pressure across large-cap, mid-cap, and small-cap segments, signaling a cautious tone creeping into broad market participation.
Nifty Realty index fell 2.08% to 908.05, extending a downside tilt after a positive prior session. The retreat in realty stocks was broad-based. Among notable movers, Brigade Enterprises declined 3.41%, Lodha Developers fell 2.78%, DLF declined 2.78%, and godrej properties stock price slipped 2.28%. Sobha developers stock price dropped 2.01%, Aditya Birla Real Estate lost 1.89%, Prestige Estates Projects shed 1.72%, Phoenix Mills stock slipped 1.59%, and Oberoi Realty stock softened 1.3% as part of a wider real estate retreat.
In company-specific dynamics, Sunteck Realty declined 5.94% after reporting consolidated net profit of Rs 42.28 crore for Q1 FY27, down 33.68% year-on-year, on revenue from operations of Rs 191.56 crore, down 43.5% from Q4 FY26. By contrast, Cyient DLM posted a much healthier footprint, with net profit rising 118.23% to Rs 16.28 crore in Q1 FY27 and revenue from operations up 34.26% YoY to Rs 373.80 crore. These micro moves highlight how fundamentals and quarterly disclosures can diverge from broad market swings, creating a mixed landscape for stock-specific bets within the Realty space.
Global markets were also in focus. Asian equities traded in the green, supported by a rebound in U.S. markets. Brent crude nudged 0.6% higher to $91.55 a barrel. Overnight in the U.S., the S&P 500 fell 0.19% to 7,443.28, the Nasdaq Composite slipped 0.05% to 25,508.07, and the Dow Jones Industrial Average declined 307.16 points, or 0.59%, to 51,839.26. The U.S. also reported its ninth consecutive day of strikes on Iran, signaling continued geopolitical risk that can influence global risk appetite and commodity flows. These macro signals set a backdrop against which Indian equities, especially sensitive sectors like real estate, are priced today.
For retail investors, the key takeaway is to balance recognition of short-term volatility with a disciplined approach to fundamentals. While the sector may remain volatile in the near term, long-run value in quality real estate developers can still emerge as earnings and cash flow visibility improves. If you want a data-driven, AI-backed perspective that can complement your own research, consider Swastika's Sarthi AI stock assistant.
DLF Share Price Outlook Amid Sensex Slump
The dlf share price has moved in tandem with the broader market risk-off tone. While the Sensex 567-point decline paints a cautionary picture, it also creates potential entry points for risk-aware, long-term investors who focus on fundamentals and valuation discipline. From a price action perspective, the mid-session fall aligns with a sector-wide rotation away from cyclicals toward more defensive exposures. If you’re evaluating entry or exit points, it’s crucial to map the price against the company’s earnings trajectory, balance sheet quality, and capital expenditure plans to gauge true intrinsic value beyond headline moves.
Given the current backdrop, maintaining a price discipline–like setting a manageable stop-loss or using protection strategies–could help preserve capital while allowing selective exposure to high-quality real estate players. The dlf share price should be analyzed alongside liquidity conditions, macro factors like oil prices, and global risk sentiment. Retail investors may consider staggered allocations rather than lump-sum bets to minimize timing risk and preserve capital for future opportunities.
What The Realty Sell-Off Signals For The Housing Market And The Stocks To Watch
The Nifty Realty index’s 2.08% drop to 908.05 underscores how real estate equities can be sensitive to macro sentiment and policy signals. A cautious approach today means differentiating between leveraged plays and high-quality developers with robust land banks and diversified revenue streams. The day’s moves highlight that even within the same sector, fundamentals matter more than index-level headlines. For investors looking to identify potential outperformers, focusing on cash-flow stability, project execution leverage, and project mix can be more productive than chasing short-term price dips.
In this context, the following names fetch particular attention for price context and liquidity considerations: godrej properties stock price, brigade enterprises stock price, sobha developers stock price, sunteck realty stock price, oberoi realty stock, and phoenix mills stock. While declines were evident in the current session, one must separate temporary trading pressure from long-run value drivers such as project completion timelines, debt levels, and diversification of revenue streams. It’s precisely these factors that Sarthi AI stock insights can help illuminate, especially when coupled with your own risk controls.
Stock-Specific Real Estate Watch: What’s Moving And Why
godrej properties stock price slipped about 2.28% in today’s trade, reflecting a broader risk-off environment rather than a sharp reset in its fundamentals. Brigade enterprises stock price dropped around 3.41% as scale and project mix came under scrutiny in the current market context. sobha developers stock price retreated roughly 2.01%, consistent with broader mid-cap pressure within the sector. sunteck realty stock price fell about 5.94% after weak quarterly numbers and a significant revenue drop. Oberoi realty stock softened around 1.3%, and phoenix mills stock declined about 1.59%, illustrating a day when even quality assets faced re-pricing pressure. The contrasts among these names highlight the importance of differentiating between short-term volatility and long-term value.
Within the same session, Lodha Developers remained an active name in price action, signaling that even leading developers can be drawn into the broader pullback. The key takeaway for investors is to stress-test exposure to each stock’s balance sheet, debt maturity profile, and cash flow generation ability in a way that aligns with your risk tolerance and time horizon. If you’re seeking deeper, stock-level context, Swastika’s Sarthi AI stock assistant can provide live insights and stock-specific triggers to help you navigate volatility more confidently.
Global Signals, Oil, And The Indian Market’s Short-Term Path
Global markets provided a mixed backdrop. Asian equities traded in the green, supported by a rebound in U.S. markets, while Brent crude rose modestly to $91.55 a barrel. The U.S. market narrative was cautious: S&P 500 down 0.19%, Nasdaq down 0.05%, and Dow Jones down 0.59% at around the close, with the Dow posting a drop of 307.16 points to 51,839.26. The broader context–plus geopolitical dynamics such as the Iran situation–adds layers of risk that can shape Indian ADRs, FII flows, and market breadth on any given day. While short-term price action can be jarring, oil and geopolitical risk often test the resilience of sector balance sheets, including realty developers with heavy capital expenditure needs.
Frequently Asked Questions
What caused the Sensex to slump today?
The Sensex declined by 567.30 points to 76,915.95, with broad weakness across indices. The Nifty 50 fell to 24,038.10, and the Nifty Realty index dropped 2.08% to 908.05, indicating broad selling pressure in equities with a tilt toward the real estate sector.
Which realty stocks were among the biggest movers today?
Key movers included Brigade Enterprises (down 3.41%), Lodha Developers (down 2.78%), DLF (down 2.78%), Godrej Properties (down 2.28%), Sobha (down 2.01%), Aditya Birla Real Estate (down 1.89%), Prestige Estates Projects (down 1.72%), Phoenix Mills (down 1.59%), and Oberoi Realty (down 1.3%).
What was the performance of Sunteck Realty and Cyient DLM?
Sunteck Realty declined 5.94% after its Q1 FY27 results showed a profit drop to Rs 42.28 crore on a 43.5% revenue decline to Rs 191.56 crore. Cyient DLM posted a profit rise of 118.23% to Rs 16.28 crore with revenue up 34.26% YoY to Rs 373.80 crore in Q1 FY27.
What global factors influenced Indian markets today?
Asian markets traded in the green, supported by a rebound in U.S. markets, while Brent crude rose to about $91.55 a barrel. U.S. indices closed lower, with the S&P 500 down 0.19%, Nasdaq down 0.05%, and Dow Jones down 0.59% at the close, amid geopolitical tensions and oil price movements.
Where can I get deeper, stock-specific analysis for real-time decisions?
For deeper stock-specific analysis and real-time insights, consider Swastika's Sarthi AI stock assistant, a tool designed to provide institutional-level research to retail investors.
Conclusion
Remember, the market’s reset is not a call to abandon quality names but an invitation to refine your approach and to use smarter tools to navigate volatility. With a focused framework, you can turn today’s pullback into a structured, long-horizon opportunity rather than a reactionary risk event.
Open your trading and demat account here
Reference :
Big Budget


Popular Articles




.avif)
.avif)

.avif)



START YOUR INVESTMENT JOURNEY
Get personalized advice from our experts
- Dedicated RM Support
- Smooth and Fast Trading App
