


Caliber Mining IPO: Should You Apply, Wait, or Watchlist?




Key Takeaways
- Caliber Mining IPO details: price band ₹402-₹424; issue size up to ₹450 crore; open 17 Jul, close 21 Jul 2026; listing on 24 Jul 2026.
- Most important signal right now: GMP data is not available yet, so a definitive call can't be made.
- Key risks: high price band with limited disclosed financials; no GMP and uncertain retail allotment signals.
- Action: watchlist for now; for deeper analysis, consult Swastika's Sarthi AI stock assistant.
Caliber Mining IPO Details: Price Band, Lot Size, And Dates
Details from the source indicate a bookbuilding IPO with a face value of ₹10 per share, a lot size of 35 shares, and an aggregate issue size up to ₹450 crore. Here are the core numbers:
| Parameter | Details |
|---|---|
| Price Band | ₹402 - ₹424 |
| Lot Size | 35 shares |
| Issue Size | 1,06,13,207 shares (up to ₹450 crore) |
| Fresh Issue | 94,33,962 shares (up to ₹400 crore) |
| OFS | 11,79,245 shares (up to ₹50 crore) |
| Open date | 17 July 2026 |
| Close date | 21 July 2026 |
| Listing date | Friday, 24 July 2026 |
| Face Value | ₹10 per share |
| Exchange | BSE, NSE |
| Issue Type | Bookbuilding IPO |
| Registrar | To be announced |
| Lead Manager | To be announced |
| QIB Quota | 21,22,643 |
| NII Quota | 5,30,660 |
| Retail Quota | 13 |
Notes: The registrar is listed as to be announced in the official data; Kfin Technologies Ltd. is mentioned in the source as the registrar, but the definitive field shows To be announced. Check the final RHP for confirmation and registered broker instructions.
Caliber Mining IPO Business Background
Caliber Mining and Logistics Limited is the issuer of this main-board IPO. The company’s business line, as described in the filing, focuses on mining and logistics-related services. The issuer intends to raise funds primarily to support growth initiatives through a fresh issue, with an OFS to provide exit or liquidity for existing holders. While the business angle–mining logistics in India–can have strong long-term potential, the lack of detailed promoter background and track record in the source limits a full assessment of execution capability and governance quality.
Investors should seek more information on the promoter group, business diversification, and long-term cash flow visibility before committing; the price band is anchored by a significant amount of fresh capital with a sizable OFS, which could dilute future earnings if not offset by growth. The listing is planned on BSE and NSE with Kfin Technologies as registrar per the source; keep an eye on the official RHP for confirmatory details.
Caliber Mining IPO GMP And Subscription Signals
GMP data is not available yet, which means there is no real-time market signal to gauge demand. Subscription data across the QIB/NII/ Retail buckets is not fully disclosed in the source; this obscures early demand signals rather than clarifying investor appetite. In such scenarios, GMP often acts as a helpful cold-start indicator, but without it, investors must rely more on fundamentals, risk tolerance, and the quality of the business plan. Consider watching the subscription trend and the final GMP release on listing day.
For deeper data-driven analysis, you can consult Swastika's Sarthi AI stock assistant to simulate various outcomes based on your risk tolerance and holdings.
Caliber Mining IPO Valuation: Is The ₹402-₹424 Price Band Justified?
With 1,06,13,207 shares offering up to ₹450 crore and a fresh issue of up to ₹400 crore, the price band implies a valuation anchor that will hinge on future profitability and growth in mining logistics, along with capital allocation efficiency. However, the source does not provide revenue, EBITDA, or net profit details to benchmark price-to-earnings or EV/EBITDA multiples against peers. In such cases, retail investors should be cautious about premium pricing, particularly when the business remains capital-intensive and exposed to commodity cycles and regulatory factors. A thorough peer comparison is difficult without more numbers. Investors should await the final RHP for more robust valuation analysis.
Caliber Mining IPO Risks: What Could Go Wrong?
The primary risk is valuation uncertainty given limited financial disclosures and the absence of GMP signals. Execution risk in mining logistics, regulatory compliance, and potential shifts in commodity demand can affect revenue visibility. Additionally, as the issue includes a sizable OFS, there is a potential dilution risk if the new float does not translate into proportional earnings improvement. The registrar and lead manager details remain to be announced, which is a governance transparency concern that investors should monitor in the run-up to the issue.
Allotment &Amp Listing Timeline: What To Expect?
The window opens 17 July 2026 and closes 21 July 2026, with listing likely on 24 July 2026 on BSE/NSE. Allotment odds for retail investors are not provided in the source data; the retail quota is listed, but the exact allocation and tie-up with bidders will be disclosed in the RHP. Given the absence of GMP and explicit demand numbers, the initial listing price could be volatile and largely market-driven. Monitor official disclosures for allotment status after the subscription window closes.
UPI/ASBA: How To Apply For Caliber Mining IPO
In Indian IPOs, you typically apply via ASBA through your bank's interface or through UPI-based bidding if the platform supports it. Steps commonly include logging in to your online banking, selecting ASBA, entering the number of lots you want to apply for (each lot is 35 shares here), and authorizing the bid with your UPI or bank password. The blocked funds remain in your account during the bid and are debited only if you receive an allotment; otherwise, they are released. For this issue, confirm the exact process with your bank or the IPO registrar when the RHP is released. Use our guidance, or the Swastika Sarthi AI stock assistant for personalized steps and checks before you bid.
Note: The exact registrar and lead manager are to be announced; confirm the process details from the final RHP or the issuer's official communication.
Frequently Asked Questions
Is Caliber Mining IPO worth applying at ₹402-₹424?
Given the lack of GMP data and limited financial disclosures in the source, the IPO decision should be cautious. Consider waiting for more data or using Swastika's Sarthi AI stock assistant for a deeper comparison against peers.
What does GMP signal mean for Caliber Mining IPO?
GMP data is not available yet, so there is no live demand signal. GMP can guide pricing expectations, but its absence means you should rely more on fundamentals and risk assessment.
What are allotment odds for retail investors in Caliber Mining IPO?
Retail quota is listed as 13 in the source, but the final allotment odds will be disclosed after the subscription window closes and the registrar finalizes allocations.
How to apply for Caliber Mining IPO via ASBA or UPI?
Typically you apply through ASBA via your bank or use UPI-based bidding if supported. Steps: log in to bank, select ASBA, enter bid quantity (lots of 35 shares), and authorize; funds are blocked and debited only if allotted.
When is Caliber Mining IPO listing and what to expect on listing day?
Listing is tentatively on 24 July 2026 on BSE and NSE. Listing day price can be volatile and depends on market conditions and demand signals; monitor official disclosures for allotment and listing updates.
Conclusion
Caliber Mining IPO presents a ₹450 crore offering with a ₹402-₹424 price band and a mixed structure of fresh equity and OFS, but no GMP signal yet and incomplete benchmark data. For retail investors, this means you should be cautious and primarily watch the listing of more data before committing capital. The practical approach now is to watchlist this IPO and wait for more clarity on demand signals and financials before applying; after gathering more data, you can re-evaluate with greater confidence.
Latest Articles
Caliber Mining IPO: Should You Apply, Wait, or Watchlist?


Key Takeaways
- Caliber Mining IPO details: price band ₹402-₹424; issue size up to ₹450 crore; open 17 Jul, close 21 Jul 2026; listing on 24 Jul 2026.
- Most important signal right now: GMP data is not available yet, so a definitive call can't be made.
- Key risks: high price band with limited disclosed financials; no GMP and uncertain retail allotment signals.
- Action: watchlist for now; for deeper analysis, consult Swastika's Sarthi AI stock assistant.
Caliber Mining IPO Details: Price Band, Lot Size, And Dates
Details from the source indicate a bookbuilding IPO with a face value of ₹10 per share, a lot size of 35 shares, and an aggregate issue size up to ₹450 crore. Here are the core numbers:
| Parameter | Details |
|---|---|
| Price Band | ₹402 - ₹424 |
| Lot Size | 35 shares |
| Issue Size | 1,06,13,207 shares (up to ₹450 crore) |
| Fresh Issue | 94,33,962 shares (up to ₹400 crore) |
| OFS | 11,79,245 shares (up to ₹50 crore) |
| Open date | 17 July 2026 |
| Close date | 21 July 2026 |
| Listing date | Friday, 24 July 2026 |
| Face Value | ₹10 per share |
| Exchange | BSE, NSE |
| Issue Type | Bookbuilding IPO |
| Registrar | To be announced |
| Lead Manager | To be announced |
| QIB Quota | 21,22,643 |
| NII Quota | 5,30,660 |
| Retail Quota | 13 |
Notes: The registrar is listed as to be announced in the official data; Kfin Technologies Ltd. is mentioned in the source as the registrar, but the definitive field shows To be announced. Check the final RHP for confirmation and registered broker instructions.
Caliber Mining IPO Business Background
Caliber Mining and Logistics Limited is the issuer of this main-board IPO. The company’s business line, as described in the filing, focuses on mining and logistics-related services. The issuer intends to raise funds primarily to support growth initiatives through a fresh issue, with an OFS to provide exit or liquidity for existing holders. While the business angle–mining logistics in India–can have strong long-term potential, the lack of detailed promoter background and track record in the source limits a full assessment of execution capability and governance quality.
Investors should seek more information on the promoter group, business diversification, and long-term cash flow visibility before committing; the price band is anchored by a significant amount of fresh capital with a sizable OFS, which could dilute future earnings if not offset by growth. The listing is planned on BSE and NSE with Kfin Technologies as registrar per the source; keep an eye on the official RHP for confirmatory details.
Caliber Mining IPO GMP And Subscription Signals
GMP data is not available yet, which means there is no real-time market signal to gauge demand. Subscription data across the QIB/NII/ Retail buckets is not fully disclosed in the source; this obscures early demand signals rather than clarifying investor appetite. In such scenarios, GMP often acts as a helpful cold-start indicator, but without it, investors must rely more on fundamentals, risk tolerance, and the quality of the business plan. Consider watching the subscription trend and the final GMP release on listing day.
For deeper data-driven analysis, you can consult Swastika's Sarthi AI stock assistant to simulate various outcomes based on your risk tolerance and holdings.
Caliber Mining IPO Valuation: Is The ₹402-₹424 Price Band Justified?
With 1,06,13,207 shares offering up to ₹450 crore and a fresh issue of up to ₹400 crore, the price band implies a valuation anchor that will hinge on future profitability and growth in mining logistics, along with capital allocation efficiency. However, the source does not provide revenue, EBITDA, or net profit details to benchmark price-to-earnings or EV/EBITDA multiples against peers. In such cases, retail investors should be cautious about premium pricing, particularly when the business remains capital-intensive and exposed to commodity cycles and regulatory factors. A thorough peer comparison is difficult without more numbers. Investors should await the final RHP for more robust valuation analysis.
Caliber Mining IPO Risks: What Could Go Wrong?
The primary risk is valuation uncertainty given limited financial disclosures and the absence of GMP signals. Execution risk in mining logistics, regulatory compliance, and potential shifts in commodity demand can affect revenue visibility. Additionally, as the issue includes a sizable OFS, there is a potential dilution risk if the new float does not translate into proportional earnings improvement. The registrar and lead manager details remain to be announced, which is a governance transparency concern that investors should monitor in the run-up to the issue.
Allotment &Amp Listing Timeline: What To Expect?
The window opens 17 July 2026 and closes 21 July 2026, with listing likely on 24 July 2026 on BSE/NSE. Allotment odds for retail investors are not provided in the source data; the retail quota is listed, but the exact allocation and tie-up with bidders will be disclosed in the RHP. Given the absence of GMP and explicit demand numbers, the initial listing price could be volatile and largely market-driven. Monitor official disclosures for allotment status after the subscription window closes.
UPI/ASBA: How To Apply For Caliber Mining IPO
In Indian IPOs, you typically apply via ASBA through your bank's interface or through UPI-based bidding if the platform supports it. Steps commonly include logging in to your online banking, selecting ASBA, entering the number of lots you want to apply for (each lot is 35 shares here), and authorizing the bid with your UPI or bank password. The blocked funds remain in your account during the bid and are debited only if you receive an allotment; otherwise, they are released. For this issue, confirm the exact process with your bank or the IPO registrar when the RHP is released. Use our guidance, or the Swastika Sarthi AI stock assistant for personalized steps and checks before you bid.
Note: The exact registrar and lead manager are to be announced; confirm the process details from the final RHP or the issuer's official communication.
Frequently Asked Questions
Is Caliber Mining IPO worth applying at ₹402-₹424?
Given the lack of GMP data and limited financial disclosures in the source, the IPO decision should be cautious. Consider waiting for more data or using Swastika's Sarthi AI stock assistant for a deeper comparison against peers.
What does GMP signal mean for Caliber Mining IPO?
GMP data is not available yet, so there is no live demand signal. GMP can guide pricing expectations, but its absence means you should rely more on fundamentals and risk assessment.
What are allotment odds for retail investors in Caliber Mining IPO?
Retail quota is listed as 13 in the source, but the final allotment odds will be disclosed after the subscription window closes and the registrar finalizes allocations.
How to apply for Caliber Mining IPO via ASBA or UPI?
Typically you apply through ASBA via your bank or use UPI-based bidding if supported. Steps: log in to bank, select ASBA, enter bid quantity (lots of 35 shares), and authorize; funds are blocked and debited only if allotted.
When is Caliber Mining IPO listing and what to expect on listing day?
Listing is tentatively on 24 July 2026 on BSE and NSE. Listing day price can be volatile and depends on market conditions and demand signals; monitor official disclosures for allotment and listing updates.
Conclusion
Caliber Mining IPO presents a ₹450 crore offering with a ₹402-₹424 price band and a mixed structure of fresh equity and OFS, but no GMP signal yet and incomplete benchmark data. For retail investors, this means you should be cautious and primarily watch the listing of more data before committing capital. The practical approach now is to watchlist this IPO and wait for more clarity on demand signals and financials before applying; after gathering more data, you can re-evaluate with greater confidence.

Gold Price Today Across Indian Markets: City-Wise Trends And Practical Investor Takeaways
Key Takeaways
- Gold price today shows volatility with 24K rates around 14,300 per gram in Bengaluru on July 16.
- June lows near 12,860 per gram for 22K; a tentative bounce near 13,000 in early July.
- City-wide 24K quotes cluster around 14,329–14,346 per gram, with Delhi, Mumbai, and Chennai near the top.
- Silver price per kilogram hovered around 2,35,000 after peaking around 2,90,000 and sliding through June.
Gold Price Today Across Indian Markets: July 2026 Snapshot
Gold price today in India is oscillating within a narrow corridor as global rate narratives and regional tensions influence demand. The June US inflation print came in cooler than expected, which typically supports gold, but persistent geopolitical tensions and higher rate expectations kept gains cautious. The price journey since mid-June shows a sharp move: on June 15, the 22-karat jewelry gold price per gram hovered around Rs 14,000. By June 25, it slipped to Rs 12,860 per gram, followed by a cautious rebound in early July. This week opened with a dip and a mixed pace through Wednesday, before a fresh decline today. On July 16, Bengaluru’s market data show 24-karat pure gold at Rs 14,329 per gram, 22-karat at Rs 13,135, and 18-karat at Rs 10,747 per gram. Mangalore mirrored 24K and 22K levels at Rs 14,329 and Rs 13,135, with 18K around Rs 10,747 as well.
To ground the narrative in the latest numbers, yesterday’s move shows the 22-karat price per gram slipping Rs 25 to Rs 13,135, while a ten-gram block moved down to Rs 131,350. This pattern–modest daily deltas within a broad range–reflects the market’s sensitivity to global liquidity signals, currency movements, and local demand pockets. The takeaway for a retail investor is clarity: do not rely on a single datapoint; instead, track a short-range trend and consider staged exposure when you expect a longer plateau.
Chennai Gold Price Today: City-Wide 24K And 22K Rates Across Major Cities
Morning trade confirms a tight cluster in 24-karat rates and a stable band for 22-karat variants across Indian metros. Here are the city-wise quotes captured in the latest morning trade across the ten major markets:
- Delhi: 24K Rs 14,344; 22K Rs 13,150
- Mumbai: 24K Rs 14,329; 22K Rs 13,135
- Ahmedabad: 24K Rs 14,334; 22K Rs 13,140
- Chennai: 24K Rs 14,346; 22K Rs 13,150
- Kolkata: 24K Rs 14,329; 22K Rs 13,135
- Hyderabad: 24K Rs 14,329; 22K Rs 13,135
- Jaipur: 24K Rs 14,344; 22K Rs 13,150
- Chandigarh: 24K Rs 14,344; 22K Rs 13,150
- Lucknow: 24K Rs 14,344; 22K Rs 13,150
- Kochi: 24K Rs 14,329; 22K Rs 13,135
- Mangalore: 24K Rs 14,329; 22K Rs 13,135
Chennai gold price today sits near the top end of the spectrum in the 24K category, consistent with a broader trend where the 24K line hovers above Rs 14,300 and the 22K line sits around Rs 13,1xx across major markets. For investors, this city-wise snapshot highlights where local supply and demand dynamics can tilt the buying experience, even when the underlying pure gold value remains relatively steady.
To deepen your understanding of how these city quotes impact purchases or hedging, see Swastika’s Sarthi AI stock assistant, which can help you connect precious metals market signals to stock market decisions: Swastika's Sarthi AI stock assistant.
24 Karat Gold Price And 22 Karat Price Trends: July 2026 Moves And What They Signal
The 24-karat gold price today, as observed in Bengaluru on July 16, shows Rs 14,329 per gram (down Rs 28 from the previous day), while 22-karat jewelry gold is Rs 13,135 per gram (down Rs 25). The 18-karat variant trades around Rs 10,747. The same morning in Mangalore confirms the trend with 24K Rs 14,329 and 22K Rs 13,135, underscored by the same 18K rate around Rs 10,747.
This data suggests a converging price path where the pure metal remains at the Rs 14.3k level, while jewelry-specific variants maintain a small premium over the 24K price, adjusted for alloy content, making Rs 13.1k for typical 22K jewelry a practical benchmark for buyers. The spread between 24K and 22K remains around Rs 1,000 to Rs 1,200 per gram in most markets, a factor that jewelry buyers monitor when negotiating gains or discounts with local dealers.
Silver Price Stability And Intercity Variations: What It Means For Your Portfolio
Silver’s price path has been comparatively steadier in recent weeks, though it also moves with commodity markets and currency shifts. In May, silver price per kilogram peaked near Rs 2,90,000, then eased to about Rs 2,80,000, and declined further to Rs 2,40,000 in June. By early July, silver hovered around Rs 2,50,000 per kilogram, with last week’s readings settling near Rs 2,35,000 and then stabilizing. For a retail investor, silver offers diversification potential but comes with higher volatility on a per-gram basis than gold, and storage and liquidity considerations can affect convenience and cost of ownership.
City-wise, the silver price today mirrors the same trend observed in gold: fluctuations in demand, local liquidity, and currency movements contribute to small variations across metros. Investors should view silver as a complement to gold for hedging, rather than a direct substitute, especially in times of currency stress or rising inflation expectations.
Morning Trade Snapshot: City-Wise 1 Gram Gold Price Across India
Here is a consolidated look at the 1-gram price levels in the morning trade for key cities, highlighting both the 24K and 22K variants. The values reflect the latest morning quotes and show how city-specific pricing aligns with the national trend:
| City | 24K Price (Rs/gram) | 22K Price (Rs/gram) |
|---|---|---|
| Delhi | Rs 14,344 | Rs 13,150 |
| Mumbai | Rs 14,329 | Rs 13,135 |
| Ahmedabad | Rs 14,334 | Rs 13,140 |
| Chennai | Rs 14,346 | Rs 13,150 |
| Kolkata | Rs 14,329 | Rs 13,135 |
| Hyderabad | Rs 14,329 | Rs 13,135 |
| Jaipur | Rs 14,344 | Rs 13,150 |
| Chandigarh | Rs 14,344 | Rs 13,150 |
| Lucknow | Rs 14,344 | Rs 13,150 |
| Kochi | Rs 14,329 | Rs 13,135 |
| Mangalore | Rs 14,329 | Rs 13,135 |
Understanding 24K, 22K And 18K Price Differentials: Practical Investor Insights
Grasping the difference between 24K, 22K, and 18K gold prices is essential for deciding when to buy or sell jewelry versus raw gold. The 24-karat price reflects the value of pure gold, while 22-karat and 18-karat prices incorporate alloy content that makes up the jewelry and affects making charges. The July 16 data shows 24K at Rs 14,329 per gram and 22K at Rs 13,135, with 18K at Rs 10,747 in Bengaluru and Mangalore. A small delta between 24K and 22K in many cities points to relatively stable alloy premiums in the current environment, though regional pricing can deviate due to dealer policies and local demand. Understanding this differential helps you budget jewelry purchases, plan for investment-grade metal, and estimate the relative cost of converting jewelry into pure gold when needed.
For a retail investor, the practical takeaway is clear: track the ratio of 24K to 22K prices over several weeks to identify whether the premium is widening or narrowing. A widening gap can indicate stronger jewelry demand or supply constraints, while a narrowing gap suggests a move toward a more uniform raw-gold price across markets. A disciplined approach–buying in increments, setting price alerts, and using a hedging mindset–can help you navigate the current price environment more effectively.
Actionable Takeaways For Retail Investors: How To Use The Gold Price Today Data
Given the data, a few practical steps can help you navigate gold investments in this environment. First, consider a staged purchase or diversifying across 24K and one or two widely traded jewelry-focused variants to manage liquidity and price risk. Second, use city-wise variations to time small entry opportunities where your preferred dealer offers a favorable 22K to 24K delta or where local demand indicators suggest a short-term move. Third, complement your gold exposure with a portion of silver if your portfolio requires diversification against inflation and currency risk, while being mindful of the higher volatility in silver compared with gold.
Frequently Asked Questions
What is the current gold price today in Bengaluru and other major markets?
As of July 16, 2026, Bengaluru shows 24K gold at Rs 14,329 per gram, 22K at Rs 13,135 per gram, and 18K at Rs 10,747 per gram. Other major markets reflect similar patterns: Delhi 24K Rs 14,344; Mumbai 24K Rs 14,329; Chennai 24K Rs 14,346.
How does the 24 karat gold price today compare with the 22 karat price today in major cities?
Across major cities, 24K prices hover around Rs 14,329 to Rs 14,346 per gram, while 22K jewelry prices range from Rs 13,135 to Rs 13,150 per gram. For example, Delhi 24K Rs 14,344 vs 22K Rs 13,150; Mumbai 24K Rs 14,329 vs 22K Rs 13,135; Chennai 24K Rs 14,346 vs 22K Rs 13,150.
What has been the trend for gold price today since mid-June 2026?
From June 15 to June 25, the 22-karat price per gram moved from around Rs 14,000 to Rs 12,860, then rebounded toward Rs 13,000 in early July. On July 16, the 24K price in Bengaluru was Rs 14,329 per gram, with 22K at Rs 13,135 and 18K at Rs 10,747, indicating a cautious, range-bound movement despite global volatility.
What is the silver price per kilogram and how has it moved recently?
Silver price per kilogram moved from around Rs 2,90,000 in May to Rs 2,80,000, then Rs 2,40,000 in June, rising to about Rs 2,50,000 in early July, and last week around Rs 2,35,000, with some stabilization since. This trajectory suggests silver is tracking broader commodity dynamics with notable volatility.
Where can I track the gold price today data in real-time and get AI-assisted insights?
Real-time price data can be tracked on credible market platforms. For deeper, AI-assisted insights that connect precious metals moves to stock market decisions, you can use Swastika's Sarthi AI stock assistant:Swastika's Sarthi AI stock assistant.
Conclusion
This article was published without a generated conclusion. Please review and add a conclusion before publishing.
Open your trading and demat account here
Reference :
1 : Varthabharati

Google A Stock Price: A Retail Investor's Deep Dive Into Alphabet Stock Price Trends
Key Takeaways
- Retail investors can google a stock price to gauge Alphabet's momentum without chasing headlines.
- We explore the alphabet share price context, chart patterns, and the key drivers behind moves.
- The guide covers how alphabet stock chart signals can confirm trends and warn against noise.
- Use the Sarthi AI stock assistant for deeper stock research and a disciplined next step.
What if a single search could unlock clarity about Alphabet's price moves? If you want to google a stock price and know what matters, this Swastika Investmart guide helps Indian retail investors read price action beyond headlines. The aim is to translate price changes into context you can use when building or adjusting a portfolio. Swastika's research tools, including Swastika's Sarthi AI stock assistant, provide institutional-grade insight in a form that's accessible to retail investors. In this article, we break down essential steps to interpret Alphabet's stock movement and translate them into practical decisions.
How To Google A Stock Price For Alphabet: Reading Momentum In Alphabet Stock Price Moves
When you google a stock price, you often see a single number. But price is a signal; momentum is not just direction, it includes speed, volatility, and volume. For Alphabet, the alphabet stock price moves when there are shifts in ad demand, search monetization and AI product iteration; algorithm updates, regulatory risk, and macro conditions influence moves. Investors typically pay attention to the price path in conjunction with volume spikes and liquidity. Reading price action requires context: recent earnings, guidance, and strategic announcements can reframe what a move means. The alphabet stock price itself may reflect a broad shift in market expectations rather than a single headline-driven event.
The practical takeaway is simple: treat the alphabet stock price as a conversation between market expectations and actual performance. If the price breaks a short-term support or resistance, check the accompanying volume, see whether major peers are moving, and ask whether the news arc justifies the move. Remember, price is a leading indicator of consensus expectations, not a definitive measure of value. For readers new to price action, start with a baseline: identify the recent trend, observe a couple of two-way reversals, and avoid chasing fast moves without confirmation.
What Drives Alphabet Stock Price Movements In The Last Quarter
The Alphabet stock price does not move in a vacuum. Core drivers typically include the growth of advertising revenue, Google Cloud performance, and user engagement trends across core products. Quarterly results that beat or miss expectations can shift sentiment quickly, even if the long-term growth trajectory remains intact. AI progress and product announcements – from search improvements to new AI features – can also influence expectations and, by extension, the share price. Regulatory concerns, antitrust inquiries, and macroeconomic conditions add further layers of uncertainty that can cap or magnify moves.
When interpreting the Alphabet stock price in the near term, investors should distinguish between news-driven spikes and sustainable shifts in momentum. A one-off headline might cause a brief jump, but a sustained move usually requires a clear re-evaluation of fundamentals or guidance. In practice, combine earnings commentary with market-wide signals, such as sector rotation or interest rate expectations, to gauge whether a move is likely to persist.
For Indian investors, cross-referencing Alphabet stock price behavior with global peers can provide useful perspective. If the alphabet stock price is moving in tandem with the tech sector, it often signals macro-driven momentum rather than idiosyncratic company surprises. Conversely, price action that diverges from the sector may indicate company-specific developments worth deeper study.
Using The Alphabet Stock Chart To Confirm Trends And Avoid Noise
The alphabet stock chart is a visual representation of price history and momentum. A disciplined approach to charting starts with a clear timeframe: short-term charts for timing, medium-term for trend direction, and long-term for structural shifts. Simple tools like trendlines and moving averages help you identify the prevailing direction. A common practice is to watch the interaction between the price and the 50-day and 200-day moving averages to identify potential confirmatory signals. When the price crosses above a moving average with rising volume, it can indicate changing momentum; a cross below with weak volume might signal caution.
Another layer of validation comes from looking for recurring chart patterns such as higher highs and higher lows, breakouts from consolidations, or reversals near key levels. In the alphabet stock chart, it is essential not to chase every blip. Confirm signals with corroborating factors like earnings guidance, product updates, or macro catalysts and consider the risk of false positives in low-liquidity conditions.
To readers who want a practical, repeatable routine, consider building a simple process: (1) identify the trend on a medium-term chart, (2) confirm with a price-action signal on a shorter timeframe, (3) check volume for sustainability, and (4) review with a risk-control plan. Using a stock chart is not about predicting the exact price, but about understanding the probability of outcomes and where your risk controls will kick in.
Interpreting Alphabet Stock News And Market Sentiment For Retail Investors
News coverage, press releases, and analyst commentary can transiently move the alphabet stock news needle. A cautious approach is to differentiate between sensational headlines and substance: does the news affect the company’s long-term earning power, or is it a short-lived market reaction? Retail investors should measure the impact by evaluating whether the news changes the underlying thesis and whether the price movement aligns with the new reality. In practice, you would assess whether the news just driven a temporary spike or whether it signals a structural shift in revenue mix, margins, or capital allocation that could affect future Alphabet stock price levels.
Always anchor news-driven moves to a framework of risk management and position sizing. If a headline pushes the price sharply but you don’t have a rational exit plan, the odds of a painful reversal increase. Keep a clear note of your time horizon and your maximum acceptable loss. Using a structured approach helps you stay objective, even when the market is noisy and headlines are loud.
A Simple Framework For Indian Retail Investors To Act On Alphabet Stock Price Signals
To turn price signals into an actionable plan, start with a simple, repeatable framework that fits your risk tolerance and time horizon. Begin with a personal baseline: what is your total capital, your tolerance for drawdown, and your need for liquidity? Once you have a baseline, structure your decision checks around it. Here is a compact, practical approach you can implement today:
- Define your horizon: Are you a trader seeking short-term moves or an investor focused on long-term growth?
- Set a price discipline: Decide on entry and exit bands based on your risk appetite and the stock’s historical volatility.
- Look for confirmation: Use a combination of price action signals, such as breakouts or pullbacks, alongside a credible news signal and earnings trajectory.
- Limit position size: Avoid overexposure to any single move in Alphabet stock price. Diversify and maintain liquidity for risk management.
- Review periodically: Revisit your thesis and adjust as fundamental assumptions or market conditions change.
Frequently Asked Questions
What drives Alphabet stock price movements?
Alphabet stock price moves primarily due to advertising revenue performance, Google Cloud growth, AI product developments, and regulatory or macroeconomic factors that influence market sentiment.
How can Indian retail investors track Alphabet stock price effectively?
Use a reliable broker feed or exchange data to monitor the alphabet stock price, refer to the alphabet stock chart for trend signals, and corroborate price moves with earnings guidance and product updates.
What is a practical way to interpret Alphabet stock news?
Interpret news by asking whether the information changes the company’s long-term earning power or is a short-term sentiment shift; avoid overreacting to headlines and rely on a predefined risk framework.
How does google a stock price fit into a retail investor's decision framework?
Using google a stock price as a starting point helps you anchor price action in context, but you should couple it with a clear investment thesis, confirmation signals (from charts and news), and strict risk controls.
What practical steps can Indian investors take today to act on Alphabet price signals?
Define your horizon, set entry/exit bands, confirm signals with charts and credible news, manage risk, and periodically review your thesis; consider using Swastika's Sarthi AI stock assistant for deeper testing.
Conclusion
In today’s dynamic markets, the ability to google a stock price and translate it into a disciplined investment plan is a practical advantage for Indian retail investors. The key is to view Alphabet stock price moves as signals within a broader framework that emphasizes risk control, long-term thinking, and independent research. Start with a clear mental model: price reflects expectations, not intrinsic value, and you should only act when the signal aligns with your risk budget and time horizon.
Open your trading and demat account here
Reference :
1 : Google

Sterling & Wilson Stock: June 2026 Quarter Profit Up 69.60%
Key Takeaways
- sterling & wilson stock posted a 69.60% YoY rise in June 2026 quarter net profit to Rs 54.22 crore.
- Sales declined to Rs 1590.13 crore from Rs 1761.63 crore, a -9.74% YoY drop.
- OPM expanded to 4.95% from 4.85%, indicating margin improvement.
- PBDT and PBT declined by 23% and 24% YoY, while NP rose about 70% YoY.
sterling & wilson stock investors are watching a mixed bag from Sterling & Wilson Renewable Energy as its June 2026 quarter shows a robust net profit uptick alongside a revenue retreat. The company posted a net profit of Rs 54.22 crore for the quarter ended June 2026, up from Rs 31.97 crore in the year-ago quarter, reflecting a 69.60% year-on-year increase. Revenue declined to Rs 1590.13 crore from Rs 1761.63 crore in the prior-year period, a -9.74% year-on-year drop. Profitability margins improved modestly, with OPM rising to 4.95% from 4.85%.
Sterling &Amp Wilson Stock: June 2026 Quarter Financial Snapshot
The June 2026 quarter results provide a snapshot of the company's performance. Net profit stood at Rs 54.22 crore on sales of Rs 1590.13 crore, with an operating margin of 4.95% in the June 2026 quarter, compared with 4.85% in the June 2025 quarter.
| Metric | June 2026 | June 2025 | YoY Change |
|---|---|---|---|
| Net Profit (Rs crore) | 54.22 | 31.97 | 69.60% |
| Sales (Rs crore) | 1590.13 | 1761.63 | -9.74% |
| OPM % | 4.95% | 4.85% | +0.10pp |
| PBDT (Rs crore) | 59.97 | 77.48 | -23% |
| PBT (Rs crore) | 56.65 | 74.67 | -24% |
| NP (Rs crore) | 54.22 | 31.97 | 70% |
Data for the June 2026 quarter are based on the company's quarterly results. Last updated: Jul 16 2026 | 2:31 PM IST. First published: Jul 16 2026 | 2:31 PM IST.
Revenue And Profit Movement Compared With June 2025 Quarter
Compared with the June 2025 quarter, the June 2026 quarter shows a revenue decline of -9.74% to Rs 1590.13 crore from Rs 1761.63 crore, while net profit rose 69.60% to Rs 54.22 crore from Rs 31.97 crore.
OPM expanded to 4.95% from 4.85% in the prior-year quarter, while PBDT fell to Rs 59.97 crore from Rs 77.48 crore and PBT fell to Rs 56.65 crore from Rs 74.67 crore. Net profit rose to Rs 54.22 crore from Rs 31.97 crore, a 70% YoY increase.
Margin Dynamics And Operational Efficiency In Q2 2026
The operating profit margin of 4.95% indicates a modest improvement over the prior-year quarter. The higher profitability occurred despite a softer revenue base, underscoring the importance of cost control and efficiency in project execution.
For deeper stock-specific insights, consider Swastika's Sarthi AI stock assistant: Swastika's Sarthi AI stock assistant.
Net Profit Growth Drivers And PBDT/PBT Trends
From a year-on-year view, net profit rose 69.60% to Rs 54.22 crore, while PBDT and PBT declined 23% and 24%, respectively. This contrast reveals that earnings quality can improve even in periods of revenue headwinds, underscoring the need to monitor cash flow and margin sustainability.
The available data do not reveal the tax or non-operating items that might have influenced the net profit uplift, so investors should keep an eye on upcoming disclosures to gauge the sustainability of this improvement.
Implications For Retail Investors In Sterling &Amp Wilson Stock
For retail investors evaluating Sterling & Wilson Renewable Energy, the June 2026 quarter shows a jump in net profitability despite a softer sales base. The margin expansion to 4.95% is a positive signal, but the decline in PBDT and PBT warrants attention to the underlying project pipeline and working-capital dynamics. Investors should consider the stock's valuation, earnings quality, and growth runway before making a decision.
As part of a disciplined research approach, you can combine quantitative signals with qualitative drivers like project backlog and order wins. For deeper stock-level signals, consult Swastika's Sarthi AI stock assistant.
Frequently Asked Questions
What were Sterling & Wilson Renewable Energy's net profit in the June 2026 quarter?
Rs 54.22 crore.
What were the sales for the June 2026 quarter?
Rs 1590.13 crore.
What was the year-on-year net profit growth in the June 2026 quarter?
69.60%.
How did the operating profit margin change in the June 2026 quarter?
OPM was 4.95% in June 2026, up from 4.85% in June 2025.
What were the PBDT, PBT, and NP values for June 2026 quarter and their year-on-year changes?
PBDT: Rs 59.97 crore vs Rs 77.48 crore (-23%), PBT: Rs 56.65 crore vs Rs 74.67 crore (-24%), NP: Rs 54.22 crore vs Rs 31.97 crore (+70%).
Conclusion
In this evolving energy landscape, the June 2026 quarter results for Sterling & Wilson Renewable Energy show a nuanced picture: profitability improved on a year-over-year basis while revenue declined, signaling a non-linear earnings quality dynamic that warrants closer attention in the quarters ahead. Retail investors can use these insights to calibrate risk and potential upside, particularly by tracking margin trends and the trajectory of PBDT and PBT as demand conditions evolve.
Open your trading and demat account here
Reference :

Devson Catalyst Share Price Surges On IPO: A Deep Dive For Retail Investors
Key Takeaways
- Devson Catalyst share price opened at ₹196.00 on BSE SME, a 66.10% premium over ₹118.
- The IPO size was ₹42.34 crore with 33.38 lakh fresh shares and 2.50 lakh OFS.
- Oversubscription reached 220.35 times, signaling strong demand.
- Proceeds will fund a new Gujarat facility, plus working capital.
Devson Catalyst share price sparked investor chatter on its BSE SME listing, opening at ₹196.00 – a premium of about 66.10% over the ₹118 issue price. Devson Catalyst Limited manufactures catalysts, adsorbents and ceramic balls for petroleum refining, petrochemicals, steel and fertilisers. The IPO was priced in a band of ₹112–₹118 per share, comprising a fresh issue of 33.38 lakh equity shares and an OFS of 2.50 lakh shares, aiming to raise ₹42.34 crore. Listing on BSE SME occurred on Thursday, 16 July 2026, with first-day trading at ₹196.00.
Devson Catalyst Share Price: Listing Day Performance And Outlook
On listing day, the stock opened at ₹196.00, a premium of about 66.10% over ₹118. This signals strong demand for Devson Catalyst's niche product portfolio–catalysts, adsorbents and ceramic balls that serve petroleum refining, petrochemicals, steel and fertilisers. The devson catalyst ipo was priced in the ₹112–₹118 band, with a fresh issue of 33.38 lakh shares and an OFS of 2.50 lakh shares, totaling ₹42.34 crore. Investors welcomed the listing on BSE SME on 16 July 2026, as first-day trading began at ₹196.00.
| Parameter | Details |
|---|---|
| IPO Size | ₹42.34 crore |
| Fresh Issue | 33.38 lakh shares |
| Offer For Sale | 2.50 lakh shares |
| Price Band | ₹112–₹118 per share |
| Listing Price | ₹196.00 |
| Listing Premium | 66.10% (vs ₹118) |
| Oversubscription | 220.35× |
| Major Domestic Customers | IOCL, BPCL, Reliance Industries Limited |
Use Of Proceeds And Gujarat Facility Expansion
The company plans to utilise the net proceeds from the fresh issue primarily towards capital expenditure for establishing a new manufacturing facility at its existing location in GIDC, Wadhwan City, Gujarat. The remaining proceeds will be used to meet working capital requirements and for general corporate purposes. This capacity expansion aligns with growth drivers in the speciality chemicals space and supports a diversified customer base.
In this context, market chatter around the devson catalyst ipo highlighted appetite for niche players with long-term contracts. IOCL, BPCL and Reliance Industries Limited are among major domestic customers, underscoring the potential for stable volumes as the new facility comes online. A two-decade track record in manufacturing catalysts, adsorbents and ceramic balls adds credibility to execution risk management.
Growth Drivers In A Competitive Market For Speciality Chemicals
The specialty chemicals portfolio – covering catalysts, adsorbents and ceramic balls – targets critical industries such as petroleum refining, petrochemicals, steel and fertilisers. A diversified customer base reduces exposure to any single client and supports steadier revenue streams; relationships with IOCL, BPCL and Reliance contribute to this stability. The company also benefits from an established industry presence built over more than twenty years, creating a robust foundation for growth. Capacity expansion funded by the IPO proceeds is designed to meet capex cycles across core industries and capture market share from domestic peers.
Risks To Watch: Raw Material Volatility And Industrial Demand Cyclicality
Like many specialty chemical manufacturers, Devson Catalyst faces raw material price volatility that can compress margins. Industrial demand is cyclical and tied to capex across core industries, so periods of slow investment could weigh on volumes. The competitive landscape, both domestic and global, adds pricing pressure and requires ongoing product differentiation. Execution risk remains a key factor: timely commissioning of the new facility is crucial to translating expansion plans into real earnings growth. Investors should monitor input costs and capital expenditure cycles as leading indicators of performance.
What This Means For Retail Investors: Investment Considerations And Next Steps
For retail investors, the Devson Catalyst IPO story signals strong appetite for niche producers, but the current listing premium calls for careful valuation and risk assessment. The company’s two-decade track record, diversified domestic customer base and capacity expansion offer potential upside if the facility ramps up on schedule and margins stabilize. If you are considering exposure, align this with your risk tolerance, liquidity needs and time horizon. For deeper, data-driven stock analysis, consider Swastika's Sarthi AI stock assistant – Swastika's Sarthi AI stock assistant.
Frequently Asked Questions
What was the devson catalyst share price on listing day?
The stock listed at ₹196.00 on BSE SME, a premium of about 66.10% over the ₹118 issue price.
What is the size and structure of the devson catalyst ipo?
The ₹42.34 crore IPO comprised a fresh issue of 33.38 lakh equity shares and an Offer For Sale of 2.50 lakh shares, priced in a band of ₹112–₹118 per share.
What was the oversubscription rate for the IPO?
The public issue was oversubscribed 220.35 times.
Who are the major domestic customers?
IOCL, BPCL and Reliance Industries Limited.
What will the IPO proceeds be used for?
Net proceeds will fund capital expenditure for a new manufacturing facility at GIDC, Wadhwan City, Gujarat, with the remainder for working capital and general corporate purposes.
Conclusion
Retail investors should interpret the listing as a vote of confidence in niche specialty chemicals, but the upside hinges on disciplined execution and favorable feedstock dynamics. A practical approach is to evaluate the investment through a capex-driven growth lens: track the new facility’s ramp-up, monitor margins as costs evolve, and adjust your position if the plan meets milestones. Consider the Sarthi AI stock assistant for ongoing insights and to tailor this opportunity to your portfolio goals.
In the end, the Devson Catalyst listing underscores the balance between growth ambition and execution risk. Use the data, and use a robust decision framework, before committing capital; the Sarthi AI stock assistant can help you stay aligned with your investment thesis.
Open your trading and demat account here
Reference :
1 : 5Paisa
Iti Limited Share Price And The BSNL 4G Expansion Wave
Key Takeaways
- Iti Limited wins Rs 856.39 crore BSNL contract for 7,613 West Zone sites.
- Phase IX.2 previously delivered 23,633 sites across Maharashtra, Goa, Gujarat, Chhattisgarh, Madhya Pradesh and Mumbai LSA for Rs 2,640 crore.
- ITI Limited is executing BharatNet Phase III projects worth ~Rs 7,000 crore across multiple states.
- The stock briefly hit an intraday high of Rs 302.40 amid the news and has shown volatility in recent sessions.
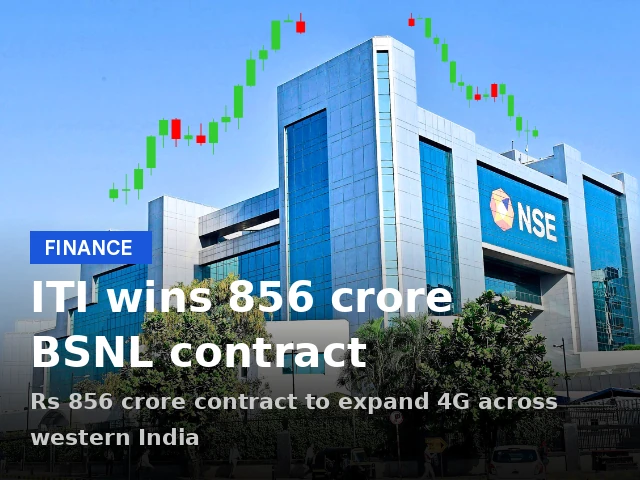
Investors tracking iti limited share price will want to understand how the latest bsnl 4g expansion order shapes ITI Limited's growth trajectory. The company secured Rs 856.39 crore contract to expand BSNL's 4G network across the West Zone, covering 7,613 sites to be planned, engineered, supplied, installed, tested and commissioned on a turnkey basis. This is a significant step in India's Atmanirbhar telecom initiative and adds another layer to ITI's expanding footprint in indigenous equipment deployment. The saturation sites funded under the Digital Bharat Nidhi programme further reinforce the domestic supply chain push and the government's emphasis on local equipment manufacturing.
Iti Limited Share Price In BSNL 4G Expansion Wave
For retail investors, the immediate takeaway is that the new order reinforces ITI Limited's role as a turnkey builder of countrywide mobile infrastructure. The Rs 856.39 crore contract expands the company’s reach within the BSNL 4G program, and the West Zone deployment of 7,613 sites adds scale to ITI’s execution capabilities. In the context of iti limited share price, the news signals execution visibility in a sector where government-led demand supports domestic equipment players. ITI Limited's earlier collaborations, including a Phase IX.2 rollout, set a precedent for rapid deployment and turnkey delivery that investors have tracked in recent months.
According to Rajesh Rai of ITI Limited, It is a very proud moment for ITI Limited as our prestigious client BSNL continues to repose great trust in ITI Limited's execution capability by awarding work order to us.
Reference :
1 : Ndtvprofit
This kind of official affirmation from leadership often translates into a perception of deeper contract execution reliability among investors. The company’s leadership frames the award as part of a broader Atmanirbhar telecom initiative, aligning ITI with a long-term national objective to build indigenous telecom capacity. The market has historically rewarded visible order inflows tied to policy-backed programs, and the 7,613-site expansion aligns with that pattern. If you are monitoring iti limited share price trends, you should watch how this contract interacts with the company’s ongoing obligations under Digital Bharat Nidhi and related saturation-site works.
7,613 West Zone Sites Under BSNL 4G Expansion: Execution And Implications For ITI Limited
The West Zone expansion marks a sizeable step in scaling ITI’s turnkey capability to deliver 4G infrastructure across a wide geography. The West Zone, already familiar with BSNL’s indigenous 4G rollout, now adds 7,613 more sites to the cumulative network built by ITI and its consortium partners. The turnkey nature of the project–encompassing planning, engineering, supply, installation, testing and commissioning–highlights ITI’s end-to-end project execution strength. For iti limited share price, the implication is twofold: first, a clearer revenue visibility over the contract lifecycle, and second, potentially improved market perception of ITI as an enabler of homegrown telecom equipment. The consortium approach, which has previously included Tata Consultancy Services in related workloads, suggests a robust delivery model that can help ITI navigate the complexities of large-scale deployments.
According to Rajesh Rai of ITI Limited, ITI Limited has steadfastly been executing and has proved to be an able ally in the country's Atmanirbhar telecom initiatives,
Looking at iti limited stock price dynamics around such orders, investors often weigh the near-term price response against the longer-term growth trajectory tied to execution risk, equipment monetization and policy-driven demand. The 7,613-site expansion, coupled with saturation sites under Digital Bharat Nidhi, underscores a sustained pipeline that can support revenue recognition over multiple quarters, not just a one-off spike. As the company continues to integrate local manufacturing with network deployment, the market will watch for efficiency metrics, margin stabilization, and any variance in project timelines that could influence iti limited share price levels in the near term.
Phase IX.2 Track Record: 23,633 Sites And Rs 2,640 Crore Turnkey Project
ITI Limited’s Phase IX.2 rollout across six states and the Mumbai Licensed Service Area stands as a concrete track record that informs how the current West Zone expansion could unfold. The prior project–completed on a Rs 2,640 crore turnkey basis and involving 23,633 sites–was executed with Tata Consultancy Services as a consortium partner. That history provides a baseline for expectations regarding project management, supply chain coordination, and field deployment at scale. Investors look at these precedents to gauge ITI’s ability to translate large orders into timely site saturation and revenue. The geographic breadth–covering Maharashtra, Goa, Gujarat, Chhattisgarh, Madhya Pradesh and the Mumbai LSA–also demonstrates ITI’s capability to operate across diverse regulatory and logistical environments, a factor that often weighs on iti limited share price during earnings cycles.
The Phase IX.2 milestone also reinforces the government’s preference for indigenous infrastructure providers, aligning ITI’s business model with a national strategy that prioritizes local manufacturing. This alignment supports a narrative of steady, policy-backed demand for ITI’s products and services, which can provide a degree of price and contract durability that investors value when assessing iti limited stock price volatility over the medium term.
BharatNet Phase III And Digital Bharat Nidhi: ITI Limited's Rs 7,000 Crore BharatNet Projects Across India
Beyond BSNL’s 4G expansion, ITI Limited is actively participating in BharatNet Phase III projects worth about Rs 7,000 crore. These projects span Himachal Pradesh, West Bengal, Andaman and Nicobar Islands, Arunachal Pradesh, Nagaland and Manipur. This multi-state footprint illustrates a broader government push to extend digital connectivity to diverse terrains, including hill states and union territories where domestic manufacturing and deployment expertise are critical. For retail investors, the BharatNet engagement signals a long-duration revenue stream that can complement the BSNL-related work, enhancing overall visibility for ITI’s order book and potentially supporting iti limited share price stability as execution milestones are met.
Market Reaction And ITI Limited Share Price Action After The News
The market response to these government-backed expansion orders has been positive in the short term, with ITI Limited stock showing upward movement on news flow around the new contract and prior Phase IX.2 execution. In intraday trading, the stock touched a high around Rs 302.40, reflecting a degree of enthusiasm among traders and some recovery after a recent downturn. While one-day moves do not redefine a stock’s long-term trajectory, they do indicate the market’s immediate interest in order wins that anchor a company’s growth narrative. Investors should monitor subsequent price action for confirmation of a medium-term uptrend, especially as project milestones begin to materialize and as BharatNet Phase III sites move from planning to execution.
To support more informed decision-making, consider leveraging Swastika's Sarthi AI stock assistant for deeper, institutional-grade research on ITI Limited and related stocks: Swastika's Sarthi AI stock assistant.
What Retail Investors Should Watch: A Practical Approach To Evaluating Indigenous Telecom Stocks
As ITI Limited expands its footprint through the bsnl 4g expansion and BharatNet Phase III, retail investors should focus on several practical angles. First, assess execution risk: can ITI sustain the pace required to deploy 7,613 sites in the West Zone while maintaining quality and site uptime? Second, analyze the revenue recognition timeline: while contract value is Rs 856.39 crore, how quickly will milestones convert into revenue, and what are the gross margins on these turnkey deployments? Third, monitor policy and domestic manufacturing momentum: the Digital Bharat Nidhi and related saturation-site programs aim to accelerate local content, which can positively influence margins and order visibility if ITI continues to win similar tenders. Finally, evaluate the broader market environment for indigenous telecom equipment players, including competitive dynamics with private sector suppliers and the risk of project delays that could impact iti limited stock price momentum.
In practice, investors should combine quarterly earnings updates with policy-oriented news to form a probabilistic view of ITI’s trajectory. The company’s leadership has framed the contract as a signal of trust and a stepping stone within the Atmanirbhar telecom framework, which aligns with a longer-term growth thesis rather than a short-term spike. If you want a structured approach to combining number-driven signals with strategic context, consider a simple mental model: treat each major contract as a milestone toward a more predictable revenue base, and watch for improvements in project execution metrics, such as site commissioning timelines and supply-chain efficiency. For deeper stock-level insights, you can explore Swastika's Sarthi AI stock assistant at the link above.
Frequently Asked Questions
What is the value of the BSNL contract awarded to ITI Limited for expanding the 4G network in the West Zone?
Rs 856.39 crore for deployment at 7,613 sites in the West Zone on a turnkey basis.
How many sites are included in the West Zone BSNL 4G expansion?
7,613 sites.
What was the scope and value of ITI Limited's Phase IX.2 project?
Phase IX.2 covered 23,633 sites across Maharashtra, Goa, Gujarat, Chhattisgarh, Madhya Pradesh and the Mumbai LSA, with a contract value of Rs 2,640 crore on a turnkey basis.
What BharatNet Phase III initiatives is ITI Limited involved in, and what is their approximate value?
ITI Limited is executing BharatNet Phase III projects worth about Rs 7,000 crore across Himachal Pradesh, West Bengal, Andaman and Nicobar Islands, Arunachal Pradesh, Nagaland and Manipur.
What did ITI Limited's chairman say about the BSNL contract?
"It is a very proud moment for ITI Limited as our prestigious client BSNL continues to repose great trust in ITI Limited's execution capability by awarding work order to us."
Conclusion
ITI Limited’s new Rs 856.39 crore bsnl contract to deploy 7,613 additional 4G sites in the West Zone, together with Phase IX.2’s proven track record and BharatNet Phase III opportunities, positions the company as a central player in India’s indigenous telecom push. Retail investors should view these developments as evidence of a long-term growth pathway anchored in domestic capability, not just a one-off order win. The real test will be execution, margin discipline, and the sustainability of revenue visibility as BharatNet sites move from planning to on-ground deployment.
Next-step takeaway: use a simple probability-based framework–weight contract wins by their execution risk and milestone-driven revenue recognition–and apply it to iti limited share price trajectory over the next several quarters. If you want a deeper, AI-assisted analysis that synthesizes policy, project milestones, and market signals, Swastika's Sarthi AI stock assistant can provide a structured, institutional-grade view to help you optimize decisions in this evolving space.
Big Budget


Popular Articles




.avif)
.avif)

.avif)



START YOUR INVESTMENT JOURNEY
Get personalized advice from our experts
- Dedicated RM Support
- Smooth and Fast Trading App
