


Molbio Diagnostics IPO: A Retail Investor's Guide For August 2026




Key Takeaways
- Molbio Diagnostics IPO opens August 10-12, 2026 with a price band Rs 768-807 per share.
- The Molbio Diagnostics IPO comprises a fresh issue of 25 Lakh Shares totalling Rs 200 Crore and an OFS of 92 Lakh Shares.
- Milky Mist Dairy Food IPO has a total issue size of Rs 1,553 crore, comprising a fresh issue of Rs 1,428 crore and an OFS of Rs 125 crore, with price band Rs 133-140.
- Dhoot Transmission IPO includes a fresh issue of Rs 1,400 crore and OFS up to 1.63 crore shares at Rs 829-871, open Aug 10-12; listing on NSE/BSE.
Four initial public offerings are set to enter India's primary market this week, creating a spectrum of opportunities and risks for retail investors. The Molbio Diagnostics IPO stands out as a high-profile mainboard issue that blends a fresh issue with a sizable offer for sale. As you evaluate whether to subscribe, it's essential to understand the price band, open dates, the total issue size, and where the stock will list. This guide walks you through the Molbio Diagnostics IPO along with three other listings – Milky Mist Dairy Food IPO, Dhoot Transmission IPO, and Fascinate Textile SME IPO – so you can make informed decisions.
Molbio Diagnostics IPO: Open Dates, Price Band, And Listing Details
The Molbio Diagnostics IPO opens for subscription from Monday, 10 August 2026, to Wednesday, 12 August 2026. The price band is Rs 768 to Rs 807 per share. The public issue comprises a fresh issue of 25 lakh shares totalling Rs 200 crore, along with an offer for sale of 92 lakh shares. The stock will list on both the NSE and BSE, giving retail investors access to a potentially active post-listing trading window. For investors evaluating the offer, it serves as a growth-oriented play in a health-tech field with significant testing and diagnostics demand.
As you compare Molbio Diagnostics IPO with the other listings this week, note the scale and structure differences. The company behind Molbio Diagnostics IPO aims to raise capital for expansion and perhaps to provide liquidity for existing shareholders. The price band implies a fulcrum around the Rs 800 per share level, which is a common anchor for mid-cap listings that carry growth potential; however, the final listing price would depend on demand and the broader market environment. You can monitor the launch details and subscribe according to your risk tolerance and financial plan. If you seek deeper insights during this process, consider Swastika's Sarthi AI stock assistant to gauge potential scenarios and stay updated across sectors.


Milky Mist Share Price: Understanding Market Expectations For Listing
Milky Mist Dairy Food is a mainboard IPO with a total issue size of Rs 1,553 crore. The issue structure includes a fresh issue of 10.20 crore shares totalling Rs 1,428 crore and an offer for sale of 89 lakh shares, up to Rs 125 crore. The price band is Rs 133 to Rs 140 per share, and the issue opens on Tuesday, August 11, closing on Thursday, August 13. The listing will be on NSE and BSE. Retail investors should assess the balance between fresh capital deployment for growth and the potential liquidity provided by the OFS portion as the stock begins trading. Milky Mist Share Price dynamics post-listing will depend on brand strength, distribution expansion, and market sentiment toward consumer staples in the Indian economy.
Dhoot Transmission IPO: Fresh Issue And OFS Overview
Dhoot Transmission's IPO is structured with a fresh issue of shares worth Rs 1,400 crore and an offer for sale of up to 1.63 crore shares. The issue opens for subscription on Monday, August 10 and closes on Wednesday, August 12, with a price band of Rs 829 to Rs 871 per share. Equity shares are proposed to be listed on the NSE and BSE. This listing could reflect the company's expansion in power transmission networks and products in India, but investors should assess the orders backlog, project execution capabilities, and pricing discipline to gauge long-term value.
Fascinate Textile SME IPO: Book-Building On The NSE SME
Fascinate Textiles is a book-built SME issue with a total size of Rs 66.98 crore. The issue comprises a fresh issue of 35 lakh shares aggregating Rs 53.94 crore and an offer for sale of 8 lakh shares totalling Rs 13.04 crore. The IPO opens for subscription on Tuesday, August 11 and ends on Thursday, August 13. Fascinate Textiles will list on the NSE SME. This listing offers a compact exposure to SME-scale textile manufacturing, with risk and reward aligned to micro-cap dynamics.
IPO Comparison: A Quick Side-By-Side View
Retail investors often compare IPOs on the scale of fresh issuances, OFS, price bands, and listing readiness. The Molbio Diagnostics IPO contrasts with Milky Mist Dairy Food IPO by structure (fresh issue plus OFS) and brand positioning in diagnostics versus a dairy consumer play. Dhoot Transmission emphasizes a larger fresh issue and a similar mainboard listing, while Fascinate Textile SME focuses on a smaller, SME-specific opportunity with a book-built process. While each listing has distinct risks and growth drivers, a common thread is the importance of understanding how much capital is being raised, how much liquidity is being offered, and the implied valuation discipline in the price band.
| IPO | Fresh Issue | OFS | Price Band | Open | Close | Listing |
|---|---|---|---|---|---|---|
| Molbio Diagnostics IPO | 25 Lakh Shares (Rs 200 Cr) | 92 Lakh Shares | Rs 768-807 | 10 Aug | 12 Aug | NSE & BSE |
| Milky Mist Dairy Food IPO | 10.20 Crore Shares (Rs 1,428 Cr) | 89 Lakh Shares (Rs 125 Cr) | Rs 133-140 | 11 Aug | 13 Aug | NSE & BSE |
| Dhoot Transmission IPO | Rs 1,400 Cr | Up To 1.63 Crore Shares | Rs 829-871 | 10 Aug | 12 Aug | NSE & BSE |
| Fascinate Textile SME IPO | 35 Lakh Shares (Rs 53.94 Cr) | 8 Lakh Shares (Rs 13.04 Cr) | Price Not Disclosed | 11 Aug | 13 Aug | NSE SME |
In the current IPO landscape, investors should stay mindful of the differences in scale and risk. The presence of OFS in multiple listings means some liquidity could flow to existing shareholders, which can influence post-listing price dynamics. For a deeper, structured take on Molbio Diagnostics IPO and the rest of the week's openings, keep a close watch on the price discovery process as each issue finds its own balance between demand and supply. Swastika's Sarthi AI stock assistant can help weigh these factors across sectors and stock profiles.
Related Reads
- Molbio Diagnostics IPO: Key Facts And Growth Outlook
- Zepto IPO Wave: An In-Depth Look At The Zepto IPO And The Coming Indian IPO Pipeline
- Zepto IPO And The August IPO Rush: A Retail Investor's Guide
Frequently Asked Questions
What is the Molbio Diagnostics IPO price band?
The Molbio Diagnostics IPO price band is Rs 768 to Rs 807 per share.
When is the Molbio Diagnostics IPO open for subscription?
The Molbio Diagnostics IPO opens for subscription from August 10, 2026, to August 12, 2026.
What does the Molbio Diagnostics IPO consist of in terms of fresh issue and OFS?
Molbio Diagnostics IPO comprises a fresh issue of 25 lakh shares totaling Rs 200 crore and an offer for sale of 92 lakh shares.
On which exchanges will Molbio Diagnostics IPO list?
Molbio Diagnostics IPO will list on the NSE and BSE.
What are the open dates and price bands for the other IPOs opening in the same week?
Milky Mist Dairy Food opens Aug 11-13 with a price band of Rs 133-140; Dhoot Transmission opens Aug 10-12 with a price band of Rs 829-871; Fascinate Textile SME opens Aug 11-13 with no price band disclosed in the article.
Conclusion
The retail investor today faces a week packed with opportunities and considerations across four distinct IPOs. The Molbio Diagnostics IPO represents a growth-oriented bet in the diagnostics space, supported by a fresh issue of 25 lakh shares and an OFS of 92 lakh shares at a Rs 768-807 price band, with listing on NSE and BSE. Meanwhile, Milky Mist Dairy Food, Dhoot Transmission, and Fascinate Textile SME offer different risk-return profiles and structures, from large mainboard cadences to SME listings. Investors should align each opportunity with their risk appetite, time horizon, and capital allocation rules, noting the open dates (Aug 10–12 for Molbio and Dhoot, Aug 11–13 for Milky Mist and Fascinate Textile) and the listing exchanges.
Open your trading and demat account here
Reference :
1 : Ndtvprofit
Latest Articles
Molbio Diagnostics IPO: A Retail Investor's Guide For August 2026


Key Takeaways
- Molbio Diagnostics IPO opens August 10-12, 2026 with a price band Rs 768-807 per share.
- The Molbio Diagnostics IPO comprises a fresh issue of 25 Lakh Shares totalling Rs 200 Crore and an OFS of 92 Lakh Shares.
- Milky Mist Dairy Food IPO has a total issue size of Rs 1,553 crore, comprising a fresh issue of Rs 1,428 crore and an OFS of Rs 125 crore, with price band Rs 133-140.
- Dhoot Transmission IPO includes a fresh issue of Rs 1,400 crore and OFS up to 1.63 crore shares at Rs 829-871, open Aug 10-12; listing on NSE/BSE.
Four initial public offerings are set to enter India's primary market this week, creating a spectrum of opportunities and risks for retail investors. The Molbio Diagnostics IPO stands out as a high-profile mainboard issue that blends a fresh issue with a sizable offer for sale. As you evaluate whether to subscribe, it's essential to understand the price band, open dates, the total issue size, and where the stock will list. This guide walks you through the Molbio Diagnostics IPO along with three other listings – Milky Mist Dairy Food IPO, Dhoot Transmission IPO, and Fascinate Textile SME IPO – so you can make informed decisions.
Molbio Diagnostics IPO: Open Dates, Price Band, And Listing Details
The Molbio Diagnostics IPO opens for subscription from Monday, 10 August 2026, to Wednesday, 12 August 2026. The price band is Rs 768 to Rs 807 per share. The public issue comprises a fresh issue of 25 lakh shares totalling Rs 200 crore, along with an offer for sale of 92 lakh shares. The stock will list on both the NSE and BSE, giving retail investors access to a potentially active post-listing trading window. For investors evaluating the offer, it serves as a growth-oriented play in a health-tech field with significant testing and diagnostics demand.
As you compare Molbio Diagnostics IPO with the other listings this week, note the scale and structure differences. The company behind Molbio Diagnostics IPO aims to raise capital for expansion and perhaps to provide liquidity for existing shareholders. The price band implies a fulcrum around the Rs 800 per share level, which is a common anchor for mid-cap listings that carry growth potential; however, the final listing price would depend on demand and the broader market environment. You can monitor the launch details and subscribe according to your risk tolerance and financial plan. If you seek deeper insights during this process, consider Swastika's Sarthi AI stock assistant to gauge potential scenarios and stay updated across sectors.
Milky Mist Share Price: Understanding Market Expectations For Listing
Milky Mist Dairy Food is a mainboard IPO with a total issue size of Rs 1,553 crore. The issue structure includes a fresh issue of 10.20 crore shares totalling Rs 1,428 crore and an offer for sale of 89 lakh shares, up to Rs 125 crore. The price band is Rs 133 to Rs 140 per share, and the issue opens on Tuesday, August 11, closing on Thursday, August 13. The listing will be on NSE and BSE. Retail investors should assess the balance between fresh capital deployment for growth and the potential liquidity provided by the OFS portion as the stock begins trading. Milky Mist Share Price dynamics post-listing will depend on brand strength, distribution expansion, and market sentiment toward consumer staples in the Indian economy.
Dhoot Transmission IPO: Fresh Issue And OFS Overview
Dhoot Transmission's IPO is structured with a fresh issue of shares worth Rs 1,400 crore and an offer for sale of up to 1.63 crore shares. The issue opens for subscription on Monday, August 10 and closes on Wednesday, August 12, with a price band of Rs 829 to Rs 871 per share. Equity shares are proposed to be listed on the NSE and BSE. This listing could reflect the company's expansion in power transmission networks and products in India, but investors should assess the orders backlog, project execution capabilities, and pricing discipline to gauge long-term value.
Fascinate Textile SME IPO: Book-Building On The NSE SME
Fascinate Textiles is a book-built SME issue with a total size of Rs 66.98 crore. The issue comprises a fresh issue of 35 lakh shares aggregating Rs 53.94 crore and an offer for sale of 8 lakh shares totalling Rs 13.04 crore. The IPO opens for subscription on Tuesday, August 11 and ends on Thursday, August 13. Fascinate Textiles will list on the NSE SME. This listing offers a compact exposure to SME-scale textile manufacturing, with risk and reward aligned to micro-cap dynamics.
IPO Comparison: A Quick Side-By-Side View
Retail investors often compare IPOs on the scale of fresh issuances, OFS, price bands, and listing readiness. The Molbio Diagnostics IPO contrasts with Milky Mist Dairy Food IPO by structure (fresh issue plus OFS) and brand positioning in diagnostics versus a dairy consumer play. Dhoot Transmission emphasizes a larger fresh issue and a similar mainboard listing, while Fascinate Textile SME focuses on a smaller, SME-specific opportunity with a book-built process. While each listing has distinct risks and growth drivers, a common thread is the importance of understanding how much capital is being raised, how much liquidity is being offered, and the implied valuation discipline in the price band.
| IPO | Fresh Issue | OFS | Price Band | Open | Close | Listing |
|---|---|---|---|---|---|---|
| Molbio Diagnostics IPO | 25 Lakh Shares (Rs 200 Cr) | 92 Lakh Shares | Rs 768-807 | 10 Aug | 12 Aug | NSE & BSE |
| Milky Mist Dairy Food IPO | 10.20 Crore Shares (Rs 1,428 Cr) | 89 Lakh Shares (Rs 125 Cr) | Rs 133-140 | 11 Aug | 13 Aug | NSE & BSE |
| Dhoot Transmission IPO | Rs 1,400 Cr | Up To 1.63 Crore Shares | Rs 829-871 | 10 Aug | 12 Aug | NSE & BSE |
| Fascinate Textile SME IPO | 35 Lakh Shares (Rs 53.94 Cr) | 8 Lakh Shares (Rs 13.04 Cr) | Price Not Disclosed | 11 Aug | 13 Aug | NSE SME |
In the current IPO landscape, investors should stay mindful of the differences in scale and risk. The presence of OFS in multiple listings means some liquidity could flow to existing shareholders, which can influence post-listing price dynamics. For a deeper, structured take on Molbio Diagnostics IPO and the rest of the week's openings, keep a close watch on the price discovery process as each issue finds its own balance between demand and supply. Swastika's Sarthi AI stock assistant can help weigh these factors across sectors and stock profiles.
Related Reads
- Molbio Diagnostics IPO: Key Facts And Growth Outlook
- Zepto IPO Wave: An In-Depth Look At The Zepto IPO And The Coming Indian IPO Pipeline
- Zepto IPO And The August IPO Rush: A Retail Investor's Guide
Frequently Asked Questions
What is the Molbio Diagnostics IPO price band?
The Molbio Diagnostics IPO price band is Rs 768 to Rs 807 per share.
When is the Molbio Diagnostics IPO open for subscription?
The Molbio Diagnostics IPO opens for subscription from August 10, 2026, to August 12, 2026.
What does the Molbio Diagnostics IPO consist of in terms of fresh issue and OFS?
Molbio Diagnostics IPO comprises a fresh issue of 25 lakh shares totaling Rs 200 crore and an offer for sale of 92 lakh shares.
On which exchanges will Molbio Diagnostics IPO list?
Molbio Diagnostics IPO will list on the NSE and BSE.
What are the open dates and price bands for the other IPOs opening in the same week?
Milky Mist Dairy Food opens Aug 11-13 with a price band of Rs 133-140; Dhoot Transmission opens Aug 10-12 with a price band of Rs 829-871; Fascinate Textile SME opens Aug 11-13 with no price band disclosed in the article.
Conclusion
The retail investor today faces a week packed with opportunities and considerations across four distinct IPOs. The Molbio Diagnostics IPO represents a growth-oriented bet in the diagnostics space, supported by a fresh issue of 25 lakh shares and an OFS of 92 lakh shares at a Rs 768-807 price band, with listing on NSE and BSE. Meanwhile, Milky Mist Dairy Food, Dhoot Transmission, and Fascinate Textile SME offer different risk-return profiles and structures, from large mainboard cadences to SME listings. Investors should align each opportunity with their risk appetite, time horizon, and capital allocation rules, noting the open dates (Aug 10–12 for Molbio and Dhoot, Aug 11–13 for Milky Mist and Fascinate Textile) and the listing exchanges.
Open your trading and demat account here
Reference :
1 : Ndtvprofit

Income Tax Return Verification: Your Guide To AY 2026-27 Deadlines, Belated Returns And Revisions
Key Takeaways
- Missing the original Income Tax Return deadline doesn't end your filing options; belated or revised returns are available.
- AY 2026-27 deadlines vary by taxpayer category, with July 31, 2026 for non-audit cases and later dates for others.
- Belated filings incur late fees and interest; revised returns have a defined 12-month window.
- Carry-forward losses may be affected by late filing; consider using Swastika's Sarthi AI stock assistant for market insights during tax season.
Income Tax Return Verification: A Retail Investor’s Guide To AY 2026-27 Deadlines, Belated Returns, And Revisions
Missing the original ITR deadline isn’t the end of the road for a retail investor. You can still file, either belatedly or as a revised return, depending on your category and the rules that apply to AY 2026-27. The term Income Tax Return Verification is central to ensuring your ITR is accepted and any corrections are captured on time. This guide walks you through the deadlines, the consequences of late filing, and the options that keep your tax records clean while you focus on your investments and wealth-building strategy.
Across taxpayers, the deadlines are not uniform. Original due dates outlined for AY 2026-27 differ by whether an audit is required. If you missed your date, you have until the applicable belated or revised return windows to get things right, with some penalties for late filing. In addition to penalties, there are practical considerations such as the carry-forward of losses and how revised returns interact with the assessment process. Read on to understand how to navigate the timeline and minimize disruptions to your trading and investing activities.
AY 2026-27 Filing Deadlines By Category
Here is the classification of original deadlines by taxpayer category for AY 2026-27, along with the belated and revised return deadlines:
| Taxpayer Category | Original Due Date | Belated Return Deadline | Revised Return Deadline |
|---|---|---|---|
| Salaried Individuals, Pensioners And Other Taxpayers Not Requiring Audit | July 31, 2026 | December 31, 2026 | March 31, 2027 |
| Non-Audit Business Owners And Professionals | August 31, 2026 | December 31, 2026 | March 31, 2027 |
| Taxpayers Whose Accounts Are Subject To Tax Audit | October 31, 2026 | December 31, 2026 | March 31, 2027 |
| Taxpayers Covered Under Transfer-Pricing Provisions | November 30, 2026 | December 31, 2026 | March 31, 2027 |
Note: The last date for filing a belated return is December 31, 2026, and the last date for filing a revised return is March 31, 2027. Belated returns and revised returns are subject to the applicable rules under the Income Tax Act, and additional tax or interest may apply depending on the specifics of the case.
What Is A Belated Return And How The Fees Apply
A belated return is an ITR filed after the original due date. For AY 2026-27, a belated return may attract a late-filing fee of Rs 1,000 if total income does not exceed Rs 5 lakh and Rs 5,000 in other cases. Interest under Section 234A may also apply if there is unpaid tax liability. The belated return is a separate filing window that allows you to report income and deductions that you may have missed in the original return.
What Is A Revised Return And The 12-Month Window For AY 2026-27
A revised return (Section 263(5)) can be filed within 12 months from the end of the relevant tax year, or before the completion of assessment, whichever is earlier. An updated return (ITR-U) can be filed within 48 months from the end of the relevant assessment year, and this option is available even if you did not file an earlier return for that year. Additional tax of 25% or 50% may apply depending on the circumstances. The AY 2026-27 revised return deadline is March 31, 2027.
Late Fees And Interest: The Cost Of Filing After The Deadline
In addition to the late-filing fee, taxpayers with unpaid tax liability may have to pay interest. The Income Tax Department states that filing after the due date can attract a fee of up to Rs 5,000, along with interest where applicable. It’s important to understand these costs in your planning, as they can affect the total tax outgo and cashflow for your investment decisions.
Impact On Loss Carry-Forward When Filing Late
One important consequence of late filing is that certain losses may not be available for carry-forward. This can matter for investors who use losses to offset gains in future years. When you file belatedly or via a revised return, you should be aware of how these rules apply to your specific situation and plan accordingly.
Filing And Verification: Quick Notes On The Process
While the deadlines are fixed, the core process of filing and verification remains consistent for most taxpayers. Ensure your information is accurate, report all eligible income, and review the details before submission. The ITR can be verified electronically through the official channels, aligning with the notion of Income Tax Return Verification, to ensure timely acceptance and avoid errors that could trigger amendments or further filings.
For readers who also want to connect tax timing with market opportunities, Swastika’s research tools can help. Consider using the following resource to get enterprise-grade insights during tax season: Swastika's Sarthi AI stock assistant.
Related Reads
Frequently Asked Questions
What is the AY 2026-27 filing deadline by category?
Salaried Individuals, Pensioners and other taxpayers not requiring audit have July 31, 2026 as the original due date; Non-audit business owners and professionals have August 31, 2026; Taxpayers whose accounts are subject to tax audit have October 31, 2026; Taxpayers covered under transfer-pricing provisions have November 30, 2026.
What are the late filing fees for belated returns?
A belated return may attract a late-filing fee of Rs 1,000 if total income does not exceed Rs 5 lakh and Rs 5,000 in other cases; interest under Section 234A may apply if there is unpaid tax liability.
What is a revised return and its deadline for AY 2026-27?
A revised return under Section 263(5) can be filed within 12 months from the end of the relevant tax year, or before completion of assessment, whichever is earlier. The revised return deadline for AY 2026-27 is March 31, 2027; an updated return (ITR-U) can be filed within 48 months from the end of the relevant assessment year.
How does late filing affect loss carry-forward?
Filing late can result in certain losses not being available for carry-forward to future years.
Where can I get help with income tax return verification and market insights?
Consult a tax advisor; for stock market research and tax-season insights, use Swastika's Sarthi AI stock assistant.
Conclusion
For the retail investor, the key takeaway is that AY 2026-27 presents a structured set of filing timelines that accommodate late filings within defined windows. Understanding whether you fall into the salaried, non-audit, audit, or transfer-pricing category helps you map the right Belated Return or Revised Return path and minimize penalties. The practical steps are simple: identify your category, note the original deadline, and act within the belated or revised windows to avoid unnecessary costs. If you’ve already filed, you can consider a revised return to correct errors or omissions within the 12-month window or the 48-month window for ITR-U, depending on your situation.
Open your trading and demat account here
Reference :
1 : Ndtvprofit

Tata Motors Share Price Outlook: Key Drivers, Earnings And Global Cues
Key Takeaways
- Tata Motors Share Price Responds To Earnings And Oil-Price Moves.
- Key Technical Levels Anchor Near-Term Direction At 24,700–24,750.
- FII/DIIs And Global Cues Drive Market Sentiment And Possible Reversals.
- Explore Deep Stock Insight With Swastika's Sarthi AI Stock Assistant.
Tata Motors Share Price: Key Factors Driving The Next Session
The near-term direction of Tata Motors share price will largely hinge on five interlinked drivers. First, crude oil prices are the most immediate macro catalyst. After a short dip, oil rebounded as market participants weighed supply risks around Hormuz and potential disruptions to shipping lanes. If these disruptions extend, Brent crude could move higher–an outcome that tends to weigh on domestic inflation expectations and discretionary demand, both of which influence carmakers like Tata Motors. JPMorgan’s projection of $7-8 per barrel monthly increases in Brent in case of prolonged disruption means the stock may respond to the oil narrative more than any single earnings print.
Second, Q1 earnings visibility is rising. With 2,045 companies reporting in the week, investors will parse commentary and guidance that either validates or challenges the macro backdrop. The market’s reaction to Tata Motors earnings will help calibrate expectations for the sector, including domestic auto demand and export cycles. Goldman Sachs’ macro view suggests a shift toward reasonably valued sectors as the economy stabilizes, which could be favorable for a high-quality, value-tilted name like Tata Motors.
Third, US jobs data has shifted investor expectations away from immediate rate hikes. The July nonfarm payrolls surprised to the downside, falling by 23,000 jobs, weakening the case for an immediate Fed rate increase. A softer US rate path generally supports risk assets abroad and improves risk appetite for emerging markets, indirectly supporting Tata Motors share price through a broader equity rally.
Fourth, FIIs and DIIs have been net buyers for two consecutive weeks. Foreign institutional investors purchased Rs 2,911 crore during the latest week, while domestic institutions added Rs 7,768 crore. This sustained buying flow tends to lift large-cap stocks and can positively influence Tata Motors and peers as outflows reverse and risk sentiment stabilizes. The de-escalation of geopolitical tensions also underpins this trajectory, helping to support more constructive market posture.
Finally, global cues–particularly the technology-led rally in the US and inflation data–shape local expectations. A stronger global backdrop can lift Indian equities through higher risk appetite and a more favorable growth outlook. Investors should monitor how US inflation prints, Fed commentary, and global demand cycles interplay with domestic macro data to gauge potential breakpoints for Tata Motors share price.
Tata Motors Stock Price Outlook Amid Q1 Earnings And Global Cues
The stock-price narrative for Tata Motors blends company-specific earnings with broader market dynamics. The upcoming June quarter earnings season sets the stage for re-rating in value-oriented pockets of the market, and Tata Motors–being a marquee large-cap–often acts as a proxy for the cyclical recovery in the auto space. As Goldman Sachs notes, the sector could see a rebound as macro conditions improve; this could reflect in Tata Motors stock price as investor confidence returns and earnings-as-valuation dynamics improve. Investors should watch guidance, margin trends, and demand signals in both domestic and international markets to gauge how the stock price may respond in coming weeks.
Technical framing suggests the Nifty’s immediate hurdle in the 24,700–24,750 zone, with a decisive move above 24,750 potentially opening the door to 25,000 and then 25,200 in the short term. Conversely, the 200-day EMA around 24,400–24,350 provides a cushion that could limit downside risk in a risk-off environment. The presence of a solid support system makes Tata Motors Stock Price potentially more resilient to broad swings, but the stock will still ride on the waves of oil narratives, earnings surprises, and global liquidity conditions.
| Area | Level |
|---|---|
| Immediate Hurdle | 24,700–24,750 |
| Short-Term Target | 25,000 |
| Next Target | 25,200 |
| Support / 200-Day EMA | 24,350–24,400 |
HAL Stock Price Outlook: Sector Signals For Investors
HAL stock price movements are often influenced by broader industrial demand and defense sector dynamics, both of which interact with the general macro narrative described above. While the article highlights HAL as part of the upcoming earnings slate, Tata Motors’ peers in the industrial and manufacturing arena may also reflect the momentum or caution that grips the broader market. Investors should consider HAL stock price in light of defense spending cycles, order flows, and global supply-chain signals, all of which can influence sentiment and sector breadth. A constructive macro backdrop and improving demand signals can help HAL stock price participate in any recovery rally alongside broader indices.
With the market looking for clarity around oil trajectories and earnings trajectories, HAL and other large-cap names could benefit from a shift in risk appetite. However, investors should remain mindful of the external risks–oil price volatility, global inflation, and geopolitical developments–that could reprice risk assets in the near term. The strategic takeaway remains: align stock-picking with a stronger macro narrative and rely on robust risk controls when navigating sector interdependencies.
Vodafone Idea Stock Price Outlook: Earnings And Market Sentiment
Vodafone Idea stock price is among the set of names investors are watching as the earnings cycle unfolds. The broader market backdrop–spurred by oil, earnings, and global cues–will shape sentiment around the telecom sector, which has its own set of competitive and regulatory headwinds. The article’s framing of FII/DII flows and macro data provides a lens to gauge how Vodafone Idea stock price might respond to quarterly results, guidance updates, and evolving demand for mobile data and services. As liquidity conditions improve and risk appetite broadens, telecom names that balance growth with prudent capital management could see renewed interest from long-only and trading investors alike.
Investors should also monitor how international considerations–such as global inflation prints and US rate expectations–impact Indian equities and telecom valuations. In the near term, Vodafone Idea stock price could be sensitive to sector-wide moves as well as company-specific earnings signals, so a measured, data-driven approach is prudent for participants tracking this name.
Tata Motors Earnings And Tata Motors Quarterly Results: What To Expect
The earnings cadence for Tata Motors remains a focal point for retailers and institutions alike. The June quarter results will be among the many that shape sentiment for the auto sector as macro and demand conditions evolve. The article underscores that 2,045 companies are scheduled to announce June-quarter earnings, and Tata Motors’ results will be viewed through the lens of whether the company can sustain volume growth, margin stability, and product mix improvement in a challenging macro. Investors should expect commentary on supply chain resilience, commodity costs, and pricing strategies to inform any eventual re-rating of Tata Motors earnings and the stock’s valuation multiple.
From a technical perspective, the market’s setup–resistance around 24,700–24,750 and strong support near 24,400–24,350–provides a framework within which Tata Motors earnings could translate into a directional move. If earnings deliver a positive surprise or provide a constructive revenue trajectory, the stock could participate in a broader market bounce, especially if global liquidity remains supportive and oil volatility settles.
For a deeper, stock-specific analysis of Tata Motors share price, connect with Swastika’s Sarthi AI stock assistant to tailor insights to your risk tolerance, time horizon, and portfolio composition. Swastika's Sarthi AI stock assistant can help you parse earnings commentary, technical triggers, and market sentiment signals in one place.
Related Reads
- Tata Motors Share Price And Market Momentum: 5 Driving Factors To Watch
- Infosys Share Price Outlook: A Retail Investor's Comprehensive Guide To Monitoring And Investing
- Tamil Nadu Reforms And The MSME Charter: A Roadmap To An Industrial Turnaround
Frequently Asked Questions
What is Tata Motors share price?
The article does not provide a real-time Tata Motors share price. It discusses Tata Motors as part of the upcoming June-quarter earnings and market drivers. For live quotes, check your trading platform.
What factors could influence Tata Motors stock price?
Five drivers are highlighted: Crude oil prices, Q1 earnings, US jobs data, FII/DIIs, and global cues. Each can move Tata Motors stock price through earnings expectations, sector sentiment, and macro conditions.
When are Tata Motors earnings due?
The article notes the June quarter earnings season with about 2,045 companies reporting; Tata Motors is among the names to watch closely.
What are the key technical levels for Nifty that could affect Tata Motors share price?
The technical view cites an immediate Nifty hurdle in the 24,700–24,750 zone, with a break above 24,750 potentially lifting targets to 25,000 and 25,200. The 200-day EMA around 24,400–24,350 provides support.
How do FIIs and DIIs impact sentiment around Tata Motors stock?
Net buying by FIIs and DIIs in the current and prior weeks suggests improving sentiment that can buoy large-cap stocks like Tata Motors as inflows resume and risk appetite strengthens.
Conclusion
Retail investors should treat Tata Motors share price as a barometer of both macro risk appetite and cyclicality in the auto space. The market is parsing oil dynamics, earnings trajectories, and global liquidity, which means that discipline in risk management and a clear view of potential support and resistance levels will pay off in a volatile environment. The next move hinges on whether 24,700–24,750 becomes a breakout zone or whether the 24,350–24,400 range holds as a reliable base. Either outcome will shape how Tata Motors and peers are priced in the days ahead.
Open your trading and demat account here
Reference :
1 : Economictimes

RBI Monetary Policy Repo Rate: Bond Flows And Yields In India
Key Takeaways
- Foreign flows into Indian government bonds are likely to stay subdued in the near term despite tax relief.
- Tax relief on overseas purchases of sovereign debt may not be enough to spur meaningful inflows.
- RBI Monetary Policy Repo Rate path and a prolonged pause shape yields and currency more than relief measures.
- Deferred global bond index inclusion further limits incremental foreign flows in the near term.
What if removing taxes on overseas purchases of Indian government bonds isn't enough to unlock a flood of foreign money? The August 2026 Market Outlook from SBI Funds Management argues that foreign investor interest in Indian government bonds may stay subdued in the near term, amid a complex web of factors including the RBI Monetary Policy Repo Rate path, the global rate cycle, and rupee expectations. Investors are watching global bond yields, the domestic interest-rate cycle, and rupee expectations to decide whether India attracts meaningful foreign debt flows. In short, tax relief is not a silver bullet; other headwinds loom.
RBI Monetary Policy Repo Rate: Implications For Indian Bond Yields And Flows
The RBI Monetary Policy Repo Rate path will be the anchor of the domestic yield curve for the months ahead. The August 2026 Market Outlook notes that the RBI is expected to keep policy rates unchanged for a prolonged period, with normalization pushed further out. The central bank's one-year-ahead CPI projection sits at 5.3%, while average headline inflation for FY27 lands at 5%. This combination gives the central bank room to maintain a pause, despite pockets of inflation risk in core items that hover around the 4% target. Fundamentally, the relative attractiveness of Indian debt versus global peers remains a function of currency risk, inflation expectations, and the pace of rate normalisation abroad.
Second, although tax relief on overseas purchases of sovereign debt is meaningful, SBI Funds Management argues it is unlikely to trigger a structural overhaul in foreign demand. The deferred inclusion into a global bond index also reduces the marginal flow that India might attract from foreign portfolio investors. Taken together, the near-term picture is one of tactical inflows that respond to price differentials and hedging costs rather than a broad re-pricing of Indian bonds. This nuance matters for retail investors because it signals a period where domestic yield dynamics and policy messaging carry more weight than foreign capital shifts.
Finally, for investors seeking actionable signals, consider how the RBI Monetary Policy Repo Rate path interacts with the rupee trajectory and inflation momentum. If inflation cools toward the 4% core level while the rupee remains resilient, Indian debt could hold up better than in some other economies. However, any surprise depreciation in the rupee or an unexpected run-up in global yields would still challenge return prospects. If you want macro-to-stock connections explained clearly, Swastika's Sarthi AI stock assistant can translate these signals into stock ideas: Swastika's Sarthi AI stock assistant.
RBI Bond Yields And Foreign Flows: Subdued Near-Term Outlook
Bond yields in India are moving in a complex dance with global rates. The SBI Funds Management view remains that the yield differential between Indian and global bonds, coupled with the policy cycle and rupee expectations, does not offer sufficient comfort to foreign investors. The persistent elevation of global yields in developed markets, driven by weaker fiscal conditions and inflation still above target in several economies, is a headwind for Indian debt as an external source of demand. The deferred index inclusion acts as an additional constraint on incremental inflows, meaning the near-term debt flow is likely to be tactical rather than structural.
RBI Policy Stance And The Prolonged Rate Pause: Implications For Retail Investors
The RBI's policy stance, as reflected in the August guidance, signals a prolonged pause with rate normalisation pushed further into the future. The central bank's focus on core inflation around 4% gives it room to keep rates unchanged, even as overall CPI sits around 5.3% for the year ahead. This stance tends to support longer-duration assets if inflation remains contained and if currency volatility stays manageable. For retail investors, that means a cautious tilt toward duration risk hedging and selective credit exposure rather than aggressive rate-risk bets. The policy landscape remains supportive of domestic yields but not supportive of rapid external inflows, given the macro backdrop.
RBI Rate Decision: Market Expectations And Policy Signals
Investors awaiting the RBI rate decision will be watching inflation trajectories, currency moves, and the balance between growth and price stability. The August policy guidance’s emphasis on a prolonged pause implies that any shift in the policy stance will come only with a clear deviation in inflation data or rupee dynamics. The 1-year ahead CPI projection at 5.3% and FY27 inflation at 5% remain critical anchors for pricing in the bond market. Retail investors should prepare for volatility around policy events, maintain a menu of duration exposures, and use hedging tools to manage currency risk. This is not a scenario for chasing high yields; it is a time to emphasize risk controls and structural resilience.
Related Reads
- RBI Policy Update: How The RBI Monetary Policy Shapes Indian Markets
- RBI Monetary Policy Repo Rate: Inflation Eases
- RBI Monetary Policy Repo Rate: Market Signals And HSBC Outlook
Frequently Asked Questions
What does SBI Funds Management say about near-term foreign inflows into Indian government bonds?
They expect subdued foreign investor interest in Indian government bonds in the near term; tax relief on overseas purchases is unlikely to dramatically lift demand, and any inflows are expected to be tactical rather than structural.
What factors determine foreign debt flows into India according to SBI Funds Management?
Global bond yields, the domestic interest-rate cycle, and rupee expectations are the key determinants shaping whether India attracts meaningful foreign debt flows.
What is the impact of deferring India's inclusion in a global bond index?
The deferment could limit incremental foreign portfolio investment, reducing the potential for a near-term inflow boost.
What inflation projections did SBI Funds Management cite in their August 2026 Market Outlook?
One-year-ahead CPI projection is 5.3%, and average headline inflation for FY27 is projected at 5%.
What does the RBI policy stance suggest about rate movements in the near term?
The August policy guidance points toward a prolonged pause, with rates expected to remain unchanged for an extended period.
Conclusion
The near-term picture for India's sovereign debt remains cautious rather than celebratory. Tax relief helps, but the larger forces–the RBI policy path, persistent inflation dynamics, and elevated global yields–are likely to keep flows modest and directional risk tilted toward currency and duration rather than a broad revival of foreign participation. Retail investors should build resilience by focusing on quality durations, hedging currency exposure, and using macro signals to guide securities selection. A practical mental model: treat sovereign debt as a hedge against inflation and currency volatility, not as a yield shotgun, and align risk budgets with the RBI policy stance.
Open your trading and demat account here
Reference :
1 : Ndtvprofit

Tata Motors Share Price And Market Momentum: 5 Driving Factors To Watch
Key Takeaways
- Tata Motors Share Price remains in focus as Q1 earnings approach and oil markets move.
- Sensex closed at 78,499 and Nifty 50 at 24,571 with mixed breadth across sectors.
- Oil price trajectories, earnings calendars, and macro data are the primary catalysts to watch.
- Foreign and domestic flows, plus global cues, will determine the next directional move for Indian equities.
Sensex closed nearly 456 points lower (0.58%) at 78,499, while Nifty 50 fell 65 points (0.27%) to end the session at 24,571. Broader markets were mixed, with the Nifty Smallcap 100 closing in the red, while the Nifty Midcap 100 gained 0.2%. Against this backdrop, Tata Motors Share Price will be in sharper focus as the June quarter earnings season accelerates. As 2,045 companies are scheduled to announce their results between Monday and Friday, investors will watch Tata Motors, HAL, and Vodafone Idea closely for clues about demand, margins, and capital expenditure in the auto and telecom spaces.
Crude oil prices, after a brief drop in the first three sessions, rose again on Thursday and Friday amid ongoing uncertainty over negotiations affecting the Strait of Hormuz. The trajectory of oil prices will largely depend on the duration of supply disruptions. JPMorgan estimates that every additional month of disruption could push Brent crude higher by about $7 to $8 a barrel. If disruptions continue for three months, the bank expects average monthly Brent prices to reach around $114 a barrel. Goldman Sachs has also warned that Brent could climb to $120 a barrel if shipping disruptions persist. This energy dynamic matters for Tata Motors Share Price because auto manufacturers are sensitive to commodity costs and inflation expectations that flow through to consumer demand.
On the earnings front, the results calendar is heating up, with 2,045 companies scheduled to announce their June quarter earnings between Monday and Friday. Tata Motors, HAL, and Vodafone Idea will be keenly watched by investors. Goldman Sachs sees the Nifty 50 rebounding to 26,500, a level above its record high of 26,373, as it turns more constructive on India following an improvement in the macro backdrop. The broker expects investors to increasingly favor reasonably valued segments as expectations of an economic recovery improve. As foreign outflows ease in the second half, the biggest beneficiaries are likely to be the most-sold and attractively valued pockets of the market, particularly large-cap stocks and banks.
The US jobs data added another layer of nuance, with the July report showing a weaker-than-expected payrolls figure. US nonfarm payrolls fell by 23,000 last month after a downwardly revised increase of 20,000 in June, while economists polled by Reuters had expected payrolls to rise by 80,000 in July. The softer data suggests a Fed that might pause on rate hikes at the next meeting, a stance that can support equity valuations in India, including Tata Motors Share Price, by reducing near-term discounting of cash flows.
Flow dynamics remained supportive, with FIIs net buying Rs 2,911 crore in the current week, following Rs 5,949 crore bought the previous week. Domestic Institutional Investors (DIIs) also sustained their buying momentum, recording net purchases of Rs 7,768 crore, with inflows seen in four of the five trading sessions. The sustained buying by both FIIs and DIIs has been attributed to the de-escalation of geopolitical tensions, which bolsters investor confidence and market sentiment. For Tata Motors Share Price, this suggests a more constructive backdrop if flows persist, though stock-specific performance will still hinge on earnings and sector dynamics.
On the global front, a tech-led rally that has propelled US stocks to record highs faces a fresh test next week as new inflation data could shape expectations around the Federal Reserve's monetary path. The S&P 500 notched its first all-time closing high in two months, underpinned by a rebound in technology and semiconductors. Within Asia, the KOSPI was the weak link in July, with the combined drag from chipmakers Samsung Electronics and SK Hynix contributing to a broad setback in market value. Market participants are balancing AI spending optimism against competitive pressure from Chinese peers, which adds a dimension of sector-specific volatility to the broader market environment.
Technically, the Nifty faces an immediate hurdle in the 24,700–24,750 zone, as noted by Sudeep Shah of SBI Securities. A decisive close above 24,750 could trigger a fresh rally toward 25,000, followed by 25,200 in the near term. On the downside, the 200-day EMA around 24,400–24,350 remains a strong support area. The market stands at a technical inflection point, where whichever side breaks first could define the next major trend for Indian equities.
For investors who want deeper insights into stock-level dynamics and to scan across sectors with institutional-grade research, Swastika offers a powerful tool. You can explore Swastika's Sarthi AI stock assistant for comprehensive stock analysis and index insights, designed to help retail investors navigate this complex landscape: Swastika's Sarthi AI stock assistant.
Tata Motors Share Price Outlook Amid Q1 Earnings And Market Mood
The market is at a juncture where earnings visibility for Tata Motors and peers could recalibrate risk appetite. While the broader market narrative leans toward a recovery as macro data improves, the auto sector's sensitivity to commodity costs remains a key risk. If Tata Motors reports margins that beat expectations or signals stronger order momentum in core markets, Tata Motors Share Price could get a retracement lift even as macro conditions remain cautious. Conversely, any soft commentary on demand or cost pressures could weigh on the stock, given the sector's cyclicality. Investors should watch not just the headline earnings beat or miss, but the quality of margin expansion, price realization, and guidance for the next quarter. Two critical catalysts stand out: the trajectory of crude oil costs, which influence operating expenses and consumer sentiment, and the demand outlook from key markets where Tata Motors has exposure. As Goldman Sachs notes a potential macro pivot and the Nifty moves toward 26,500, stock-specific progress in Tata Motors will hinge on how well the company translates macro optimism into earnings momentum.
From a technical lens, a robust move above near-term resistance could unlock incremental upside for Tata Motors Share Price as part of the broader cyclical and auto index rally. A disciplined earnings print paired with macro tailwinds could help re-rate the stock to align with its sector peers. The takeaway for investors is clear: align position sizing with your risk tolerance, monitor commodity cost trajectories, and watch for management commentary that clarifies product launches, capex plans, and price strategies that could sustain margins.
Oil Price Trajectory And Its Impact On Indian Markets
Oil markets have traded with heightened sensitivity to supply disruptions. After a dip in the first three sessions, crude prices rebounded on Thursday and Friday amid ongoing uncertainty over the Strait of Hormuz. JPMorgan’s projection that every extra month of disruption could lift Brent by about $7–$8 per barrel highlights the potential for energy costs to feed into inflation expectations and corporate margins. If the disruptions persist for three months, JPMorgan suggests Brent could average around $114 a barrel; Goldman Sachs has warned of a possible move toward $120 if the Strait of Hormuz bottleneck remains unresolved. For Tata Motors and other automakers, energy cost trajectories can tighten margins and alter pricing power, affecting the Tata Motors Share Price as investors reassess risk-reward in cyclical sectors.
Beyond the auto sector, higher energy costs can weigh on consumer spending as households face higher gasoline and transport costs. That dynamic can indirectly influence Tata Motors’ domestic demand environment, especially in entry-level segments where affordability is a key driver. On the flip side, if oil prices stabilize or ease, supported by favorable demand signals or supply discipline, the risk premium on equities could ease, providing a favorable backdrop for a broader market rally that would also benefit Tata Motors Share Price as a beneficiary of improved risk sentiment.
US Jobs Data And The Fed Path: Implications For Indian Equities
The July U.S. jobs report added more nuance to the global outlook. The unexpected decline in nonfarm payrolls by 23,000, after a downward revision of 20,000 in June, contrasted with economists’ expectations for an 80,000 gain. This softer payrolls print reduces the probability of an immediate rate hike by the Federal Reserve and supports a more accommodative stance in the near term. For Indian markets and Tata Motors Share Price specifically, a less aggressive Fed path can sustain global liquidity streams and support higher equity multiples. Investors should watch how the Fed’s evolving projections interact with inflation data and the strength of the U.S. domestic demand cycle, as any shift could reverberate through cross-border risk sentiment and the valuation calculus for cyclicals in India.
As the Fed path becomes less certain, foreign investor behavior in Indian equities could remain sensitive to macro headlines and domestic earnings signals. A calmer U.S. monetary backdrop tends to bolster risk-taking in global equity markets, which includes auto and infrastructure-related names that drive Tata Motors’ long-term capital deployment and earnings trajectory. In short, the U.S. data flow matters not just for U.S.-centric assets but for the risk-on/risk-off posture that Indian equities inherit from global liquidity conditions.
FII And DII Flows: What The Latest Numbers Suggest
The appetite of both foreign and domestic investors has a meaningful bearing on near-term price action. In the latest week, FIIs were net buyers to the tune of Rs 2,911 crore, continuing a two-week buying streak. DIIs, meanwhile, showed stronger buying momentum with net inflows of Rs 7,768 crore across four of five trading sessions. The persistence of such inflows is often a supportive backdrop for large-cap and value-oriented pockets, including names in Tata Motors’ domain. If flows sustain, the stock and the broader market could see a steadier bid, helping to offset some of the macro-driven volatility triggered by energy or earnings headlines.
However, flows can reverse quickly if geopolitical tensions flare up or if there are surprises from the earnings calendar. Retail investors should avoid overexposure to a single theme and instead consider diversification across cyclicals and defensives, while keeping an eye on how Tata Motors Share Price behaves in response to earnings announcements and sector-specific signals.
Global Cues And Technical Levels For Nifty
The global backdrop has continued to tilt toward risk-on on improving tech and semiconductor sentiment in the United States, even as inflation data remains a close watch. The S&P 500 posted its first all-time closing high in two months this week, reflecting a rebound in technology shares that had previously cooled after a strong run. Meanwhile, the Asia region saw mixed performance in July, with the KOSPI lagging as chipmakers faced sector-specific headwinds. These dynamics can influence the appetite for cyclical plays in India, including Tata Motors, as investors weigh global growth trajectories and the durability of AI-driven demand across sectors.
From a technical perspective, SBI Securities’ Sudeep Shah notes that the Nifty’s immediate hurdle sits at 24,700–24,750, and a decisive move above 24,750 could spark a rally toward 25,000, then 25,200 in the short term. The downside appears cushioned by the 200-day EMA in the 24,400–24,350 range, offering a substantial support zone for risk-managed investors. In practice, traders and long-term investors alike should align positions with these levels, as breakouts or breakdowns from these bands are likely to define the next leg of the trend for the Nifty and for individual names such as Tata Motors Share Price.
Practical Takeaways For Retail Investors
Retail investors should approach the week with a structured framework that prioritizes risk management, stock-specific diligence, and a disciplined earnings-readiness approach. Start by mapping your exposure to cyclicals, financials, and defensives to ensure you are not overly concentrated in a single theme as market drivers swing between macro momentum and company-level surprises. Track the Q1 earnings calendar closely, particularly for Tata Motors and peers, and watch commodity price trajectories, which have direct implications for margins and pricing power in the auto sector.
Keep a keen eye on foreign and domestic flows as a barometer of market sentiment and liquidity. If FIIs and DIIs sustain inflows, the probability of a risk-on environment rises, supporting not just Tata Motors Share Price but broader market leadership. Conversely, any escalation in geopolitical tensions or a sharper-than-expected rise in oil prices could pressure risk assets and trim gains in cyclicals. A balanced approach–combining core exposure with selective cyclicals and a margin of safety–helps navigate the potential volatility.
Related Reads
- Infosys Share Price Outlook: A Retail Investor's Comprehensive Guide To Monitoring And Investing
- Tamil Nadu Reforms And The MSME Charter: A Roadmap To An Industrial Turnaround
- HDFC Bank Share Price In July: FII Sector Flows And Defensive Rotation For Retail Investors
Frequently Asked Questions
What is Tata Motors Share Price Today?
The article does not provide the current Tata Motors share price. It focuses on market context, earnings, and macro drivers that could influence the stock.
Why Might Tata Motors Stock Price Fall?
The article does not report a specific price fall for Tata Motors. It highlights five market drivers—oil prices, Q1 earnings, US jobs data, FII/DIIs, and global cues—that could impact the stock depending on macro and earnings momentum.
What Factors Could Drive Tata Motors Share Price In The Coming Week?
Oil price trajectories, the June quarter earnings for Tata Motors and peers, US payrolls data, and foreign and domestic flows are the primary catalysts that could shape Tata Motors Share Price in the near term.
Where Can I Access AI Stock Analysis For Tata Motors?
Use Swastika's Sarthi AI stock assistant.Swastika's Sarthi AI stock assistant.
Conclusion
The road ahead for Tata Motors Share Price sits at the intersection of earnings momentum, energy costs, and global liquidity. A robust Q1 performance could reinforce risk appetite and lift the stock alongside the broader rally in cyclicals, while a cautious earnings tone or persistent energy pressure could test even the strongest risk-takers. The key takeaway for retail investors is to focus on price levels and earnings signals–watch 24,750 as a near-term pivot, and monitor oil trajectories and U.S. data for directional clues. Build a plan that accommodates both macro surprises and stock-specific developments, so you are positioned to react calmly rather than reactively.
Open your trading and demat account here
Reference :
1 : Economictimes
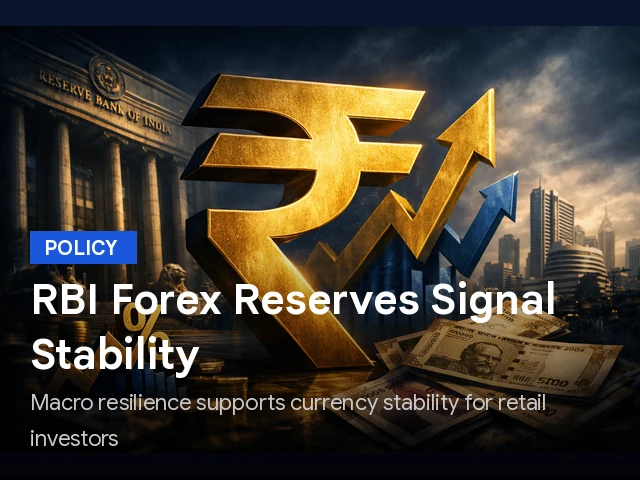
RBI Forex Reserves: What The Latest RBI Data Means For Retail Investors
Key Takeaways
- RBI Forex Reserves climbed to $692.866 billion for the week ended July 31, 2026, up $10.512 billion.
- Foreign Currency Assets rose by $8.75 billion to $564.68 billion, lifting the reserve mix.
- Gold Reserves rose by $1.685 billion to $104.743 billion, while SDRs and IMF positions also ticked higher.
- FCNR Scheme inflows under the FCNR Scheme total $32 billion to date, reflecting policy steps to attract forex flows.
In a world where geopolitical risk and liquidity flows can ripple through markets with little warning, India's RBI Forex Reserves tell a quiet but critical story about macro resilience and currency stability. For the week ended July 31, 2026, the central bank reported total reserves at $692.866 billion, a gain of $10.512 billion from the prior week. The move comes after a previous week where reserves rose by $6.118 billion, illustrating a consistent inflow that helps calm volatility in the rupee and sustain market confidence. The latest data set the stage for how retail investors might approach domestic equities, fixed income, and even currency hedges in a world of shifting external pressures.
RBI Forex Reserves: What The Latest RBI Data Means For Retail Investors
The RBI Forex Reserves figure at $692.866 billion marks a robust buffer for the economy. The jump of $10.512 billion in the week ended July 31 highlights the central bank's ability to mobilize capital quickly to reassure investors and maintain orderly markets even as global tensions influence risk appetite. In tandem with the rupee's volatility, these reserves provide the liquidity that supports the financial system's functioning. For a retail investor, that translates to more predictable exit routes and less liquidity risk in times of stress.
Breaking down the components, foreign currency assets rose by $8.75 billion to $564.68 billion. This component reflects the value of non-dollar assets held in the reserve portfolio, accounting for currency movements in euro, pound, and yen that are included in the reserve basket. The central bank has been working to attract foreign inflows through measures like the FCNR(B) scheme; the week also saw gold reserves increase by $1.685 billion to $104.743 billion, SDRs up by $0.048 billion to $18.666 billion, and the reserve position with the IMF rising by $0.028 billion to $4.778 billion. The data also remind investors that the all-time high of $728.494 billion was reached during the week ended February 27 this year, before the West Asia conflict which led to several weeks of turnover in the reserves and consequent rupee pressure.
Additionally, the central bank and the government had launched measures to attract more forex flows into the country last month, including the FCNR(B) measure. The country has so far received $32 billion under these FCNR schemes, illustrating sustained demand for dollar liquidity that supports macro stability. These inflows help to bolster RBI's foreign exchange reserves and provide a cushion during periods of global financial stress, a factor many retail investors monitor when assessing risk and currency exposure within their portfolios.
| Metric | Value |
|---|---|
| Total RBI Forex Reserves | $692.866 Billion |
| All-Time High (Week Ended Feb 27) | $728.494 Billion |
| Foreign Currency Assets | $564.68 Billion |
| Gold Reserves | $104.743 Billion |
| SDRs | $18.666 Billion |
| IMF Reserve Position | $4.778 Billion |
| Weekly Change | +$10.512 Billion |
| FCNR(B) Inflows Under FCNR Scheme | $32 Billion (to date) |
For a retail investor, the takeaway is to watch how reserve composition evolves alongside global risk sentiment. The rise in foreign currency assets, coupled with higher gold reserves and SDRs, paints a picture of a diversified buffer that can mitigate sudden currency shocks. The ongoing FCNR inflows further illustrate how policy tools can influence liquidity in times of external stress, potentially stabilizing both the macro environment and the risk appetite for domestic equities and bonds.
RBI Gold Reserves: What The Numbers Tell Us
One of the most visible shifts in the reserve portfolio has been the RBI Gold Reserves. The RBI Gold Reserves rose by $1.685 billion to $104.743 billion during the week. Gold remains a strategic asset for central banks and a hedge against external shocks, providing diversification within the reserve portfolio. For retail investors, a stronger gold reserve backdrop can underpin a sense of macro stability, which often translates into steadier equity markets and more predictable bond yields in the medium term.
From a practical perspective, the growing gold allocation within the reserves can influence inflation expectations, currency stability, and the currency-hedging narrative that many investors weigh when deciding how to allocate across gold, equities, and debt instruments. The data point also aligns with a longer-term trend of using gold as a stabilizer for reserve adequacy in countries with volatile external funding conditions.
RBI FCNR Scheme: How It Works And Why It Matters
RBI FCNR Scheme covers Foreign Currency Non-Resident deposits, a policy tool designed to attract foreign exchange inflows into the economy. The central bank and the government had launched a series of measures to attract more forex flows into the country last month, including the FCNR(B) measure. The data show that the country has so far received $32 billion under these FCNR schemes, illustrating sustained demand for dollar liquidity that supports macro stability. For investors, the FCNR inflows translate into greater reserve strength and a more predictable macro environment, which can reduce currency-driven risk in a diversified portfolio.
RBI Dollar Sales: Interventions That Stabilize The Rupee
In periods of heightened volatility, the RBI's interventions in the forex market through dollar sales play a critical role in stabilizing the rupee. The latest weekly data reflect this ongoing effort to balance flows and prevent abrupt rupee moves that could disrupt fixed income portfolios and equity valuations. Dollar sales, combined with the strengthening reserve mix, help create a smoother pricing environment for Indian assets and a measure of confidence for retail investors navigating currency exposure in their portfolios.
Practical Takeaways For Retail Investors From The Reserve Data
Two practical implications stand out for retail investors. First, the resilience of RBI forex reserves indicates that the central bank has the capacity to manage liquidity and currency fluctuations, reducing the risk of abrupt rupee moves that could disrupt portfolios. Second, the ongoing FCNR inflows and the measured pace of asset diversification hint at calmer macro conditions relative to the height of the conflict earlier in the year. With this backdrop, stock ideas and fixed income allocations should be considered with a focus on quality, liquidity, and hedging where appropriate.
To translate macro signals into actionable ideas, explore Swastika's Sarthi AI stock assistant for stock and index insights that align with current reserve dynamics.
Risks And Outlook: What To Watch Next
Looking ahead, the path for RBI forex reserves will depend on global policy shifts, commodity prices, and the scale of external demand for Indian assets. While the reserve base remains robust, a geopolitical impulse or a policy change in major economies could alter risk appetite and flows. Investors should monitor how FCNR inflows evolve in coming weeks and how the RBI's dollar sales and currency actions interact with market pricing.
Related Reads
- RBI Forex Reserves: What The July 2026 Data Signals For Retail Investors
- RBI Foreign Exchange Reserves Rise: Implications For Investors
- Gold Price World Gold Council Signals A Structural Uptrend: What Indian Retail Investors Should Know Now
Frequently Asked Questions
How Much Are RBI Forex Reserves In The Latest Week?
RBI Forex Reserves stood at $692.866 billion for the week ended July 31, 2026. The components include Foreign Currency Assets at $564.68 billion, Gold Reserves at $104.743 billion, SDRs at $18.666 billion, and IMF Reserve Position at $4.778 billion.
What Components Make Up RBI Forex Reserves?
The reserve bundle comprises Foreign Currency Assets, Gold Reserves, SDRs, and the IMF Reserve Position. In the latest data, Foreign Currency Assets led the rise, followed by a gain in Gold Reserves, with SDRs and IMF position also ticking higher.
What Is The RBI FCNR Scheme And How Much Inflows Have Been Attracted?
RBI FCNR Scheme refers to the Foreign Currency Non-Resident Deposit scheme. Measures to attract forex flows, including FCNR(B), have led to inflows totaling about $32 billion under these schemes to date.
Why Does RBI Intervene With Dollar Sales?
Dollar sales are used to stabilize the rupee during external stress and to maintain orderly currency markets. Such interventions complement reserve management and help anchor market expectations for retail investors.
What Was The All-Time High RBI Forex Reserves And When Was It Reached?
The all-time high was $728.494 billion, reached in the week ended February 27 this year, before subsequent volatility related to regional conflicts affected flows.
Conclusion
The RBI's current reserve stance provides a cushion for retail investors, signaling macro stability even as global risk sentiment ebbs and flows. The combination of higher foreign currency assets and gold reserves suggests a balanced approach to risk diversification and currency management that can support a range of asset classes in the near term.
Next steps: use this macro context to refine your risk framework and stock ideas. Focus on liquidity, currency risk, and a disciplined asset allocation approach. For deeper macro-to-stock insights, try Swastika's Sarthi AI stock assistant to translate these signals into actionable ideas: Swastika's Sarthi AI stock assistant.
Big Budget


Popular Articles





.avif)
.avif)

.avif)



START YOUR INVESTMENT JOURNEY
Get personalized advice from our experts
- Dedicated RM Support
- Smooth and Fast Trading App
