


NMDC Share Price: Key Movers On August 10 – LIC Stock, Hindalco, Hitachi Energy India Stock And More




Key Takeaways
- NMDC fixed iron ore prices: Lump ₹5,250/tonne; Fines ₹4,500/tonne.
- Hitachi Energy India backlog hits ₹32,222.1 crore; ₹634.63 crore used from ₹1,513.28 crore capex allocation.
- LIC launches New Bima Jyoti plan; OFS sale of 82.23 crore equity shares for ₹31,552.34 crore.
- Molbio Diagnostics and Dhoot Transmission IPOs open August 10–12.
Across Indian markets, the NMDC share price is under the spotlight as ore pricing shifts ripple through the sector. NMDC has fixed the price of lump ore at ₹5,250 per tonne and fines at ₹4,500 per tonne, a move that will be closely tracked for its potential relevance to the NMDC share price. The pricing decisions come amid large orders, capacity expansions, and regulatory developments across several blue chips, including Hindalco, Hitachi Energy India, and Adani Enterprises, as investors weigh the impact on revenue, margins, and future growth prospects.
NMDC Share Price And Iron Ore Price Fix: What Investors Should Watch
The iron ore price fix announced by NMDC is a direct input in the company’s earnings mix. For investors, the key question is whether lump ore pricing translates into higher revenue per tonne and how it filters through to margins in the next quarters. While the fix provides a transparent benchmark, its impact on the NMDC share price will depend on demand realizations, production mix, and the state of global steel demand. Market watchers will be looking at how these two price bands compare with historical levels and what it suggests about future volume growth and pricing power.
| Iron Ore Price Metric | Value |
|---|---|
| Iron Ore Lump Price | ₹5,250/tonne |
| Iron Ore Fines Price | ₹4,500/tonne |
In the broader market, the revision will be tracked for its potential relevance to the NMDC share price as traders compare ore price and shipment volumes to the company’s reported production and extraction costs. Investors should monitor commentary from management on ore mix and shipping schedules in upcoming quarterly results.
Hitachi Energy India Stock: A 165 MW Battery Storage System Order And A Record Backlog
Hitachi Energy India has declared its first Battery Energy Storage System (BESS) order for a 165 MW/330 MWh project in Andhra Pradesh. This order compounds with a record backlog of ₹32,222.1 crore, signaling a strong long-term growth runway in storage and grid modernization. The company has also utilized ₹634.63 crore from its ₹1,513.28 crore capex allocation, marking progress in its capex program while maintaining balance sheet discipline.
From an investor’s perspective, such orders are meaningful because they illustrate the company’s ability to win large-scale projects and convert them into recurring revenue streams. The BESS space, supported by government policy wheels and improving project economics, may act as a growth engine for Hitachi Energy India in the coming years.
Hindalco Stock: Capacity Expansion At Kuppam And The CFIUS Review Update
Hindalco plans to add 10 KTPA of capacity at its Kuppam facility by FY29, involving an investment of ₹768 crore. The expansion signals the company’s conviction on metals demand, particularly in aluminum and downstream processing, to meet rising demand from core sectors like auto and packaging. In parallel, the CFIUS review for Hindalco’s proposed acquisition of AluChem Companies has been delayed, with final clearance now expected by September 2, 2026. These regulatory timelines can influence investor sentiment and project scheduling for Hindalco’s expansion plan.


LIC Stock: New Bima Jyoti Plan And The OFS Sale
LIC has launched New Bima Jyoti, a non-participating, non-linked individual savings life insurance plan, effective August 10, 2026. This product expansion fits into LIC’s broader strategy of diversified savings products for retail customers while maintaining strong distribution leverage. Separately, the government completed the sale of 82.23 crore equity shares, representing 13% of the OFS, for an aggregate consideration of around ₹31,552.34 crore. The OFS sale represents a material portion of the government’s disinvestment program and has implications for supply/demand dynamics in public-sector coverage and LIC’s own capital position.
Delhivery Stock: GST Demand Reduction And The Logistics Sector Outlook
Delhivery has seen its GST demand reduced to ₹1.51 crore from ₹5.36 crore in a West Bengal appellate ruling, a relief for the company’s near-term financials. The decision reflects the ongoing state-level tax rationalization that benefits logistics and e-commerce players. Investors should watch how this development translates into cash flow and profitability metrics in the next quarterly results and how Delhivery’s costs respond to a more predictable GST regime.
Adani Enterprises Stock: AACL Global IFSC Incorporation And Other Moves
Adani Enterprises’ arm, Adani Airport, has incorporated AACL Global IFSC, signaling strategic moves in the aviation sector and international financial services. While this may not immediately move the Adani Enterprises stock, it signals an expansion of the group’s footprint and potential synergies with aviation and logistics assets. Investors should track how this corporate action aligns with the group’s capital allocation priorities and the potential impact on earnings visibility.
Jindal Worldwide Stock And Rights Issue
Jindal Worldwide’s board has approved a rights issue of up to ₹650 crore. The proceeds are intended to strengthen the balance sheet and aim to make the company debt-free by FY27. The move is a classic capital structure optimization that could influence the stock’s risk-return profile as it unfolds over the next few quarters. Meanwhile, MRF shareholders approved a final dividend of ₹229 per equity share for FY26, reaffirming shareholder friendly actions in the sector.
IPO Openings: Molbio Diagnostics And Dhoot Transmission
Molbio Diagnostics and Dhoot Transmission are scheduled to open their IPOs on August 10 and will remain open until August 12. For IPO investors, this period represents a critical window to allocate capital to new listing opportunities in the life sciences and engineering sectors. As liquidity conditions evolve, early access to these issues could provide attractive entry points for selective long-term and mid-term exposure.
Market Context: Why The News Matters For Your Stock Watchlist
The confluence of fixed ore prices, large order wins, capacity expansions, and regulatory moves across the listed universe suggests a more dynamic environment for Indian equities. The direct channel is through company earnings visibility and capital allocation discipline – particularly for heavyweight names like NMDC stock, Hindalco stock, and Hitachi Energy India stock – but the broader ripple effects may touch adjacent sectors such as logistics (Delhivery stock), insurance (LIC stock), and aviation/infra (Adani Enterprises stock, AACL Global IFSC).
Related Reads
- SBI Share Price And Q1 Pulse: Titan, Hindalco, Delhivery In Focus
- Tata Steel Share Price And Market Pulse: A Practical Investor's Guide
- Bharti Airtel Share Price Momentum After LIC's June Quarter Bets
Frequently Asked Questions
What price changes did NMDC announce for iron ore?
NMDC fixed the price of lump ore at ₹5,250 per tonne and fines at ₹4,500 per tonne.
What is Hitachi Energy India's order backlog and capex utilization?
Hitachi Energy India's order backlog is ₹32,222.1 crore, and ₹634.63 crore has been utilised from a ₹1,513.28 crore capex allocation.
What is Hindalco's capacity expansion plan?
Hindalco plans to add 10 KTPA of capacity at its Kuppam facility by FY29, at an investment of ₹768 crore. The CFIUS review for its AluChem acquisition has been delayed, with final clearance expected by September 2, 2026.
What is LIC's New Bima Jyoti plan and the OFS sale?
LIC launched New Bima Jyoti, a non-participating, non-linked individual savings life insurance plan, effective August 10, 2026. The government completed the sale of 82.23 crore equity shares, representing 13% of the OFS, for about ₹31,552.34 crore.
What happened to Delhivery's GST demand?
Delhivery's GST demand was reduced to ₹1.51 crore from ₹5.36 crore by the West Bengal appellate authority.
When are Molbio Diagnostics and Dhoot Transmission IPOs open?
Molbio Diagnostics and Dhoot Transmission are scheduled to open their IPOs on August 10 and will remain open until August 12.
Conclusion
Retail investors should translate today’s moves into a practical playbook: monitor how NMDC share price tracks the iron ore price fix, and maintain a watchlist that includes high-conviction beneficiaries of capex and policy reform like Hitachi Energy India and Hindalco. Use the information as a framework for scenario testing – what happens to earnings if ore prices hold, rise, or compress? The next step is to couple fundamental research with price action signals and to keep an eye on regulatory shifts that could alter the timing of project execution.
As you do, consider Swastika’s Sarthi AI stock assistant for institution-grade insights tailored to a retail investor’s needs: Swastika's Sarthi AI stock assistant.
The market won’t wait for perfect clarity, but with disciplined research and a clear risk framework you can navigate the volatility and identify the best risk-adjusted opportunities among the movers on August 10 and beyond.
Latest Articles
Thyrocare Stock Price: Q1 FY27 Performance, Pathology Growth, And Specialty Diagnostics Expansion


Key Takeaways
- Thyrocare's Q1 FY27 revenue rose 24.34% year-on-year to Rs 240.02 crore, with net profit up 34.06% to Rs 52.19 crore.
- Pathology revenue rose 26% to Rs 225.6 crore, with franchise revenue at Rs 142.8 crore (27% YoY).
- 55.2 million tests were processed, revenue per test Rs 39.8 (down 2%), and revenue per patient Rs 404 (up 7%).
- Specialty diagnostics expansion with allergy testing and genomics via NIPT strengthens growth, supported by a network of ~11,700 franchises.
For investors tracking the thyrocare stock price, the latest Q1 FY27 numbers illuminate a turning point in India's diagnostic leader. The company reported consolidated net profit of Rs 52.19 crore, up 34.06% YoY from Rs 38.93 crore. Revenue from operations rose to Rs 240.02 crore, a 24.34% rise. PBT was Rs 68.29 crore, up 35.28% YoY, while EBITDA stood at Rs 77.27 crore with a margin of 32.2% versus 29.9% a year earlier. The pathology segment delivered Rs 225.6 crore in revenue, expanding 26% YoY, with franchise revenue at Rs 142.8 crore (27% YoY).
Thyrocare continues to expand into specialty diagnostics, marking the next phase of its growth journey. The company began this journey with allergy testing and genomics testing and has since progressively expanded its specialty test portfolio, with a focus on building clinical trust through scientific rigor, uncompromising quality, and industry-leading turnaround times.
Operationally, the company processed 55.2 million diagnostic tests during the quarter; YoY increase: 28%. Revenue per test stood at Rs 39.8, down 2% from a year earlier, while revenue per patient rose 7% to Rs 404. The pathology segment's growth, combined with a robust franchise and partner network, underpins the improving margins as the group scales.
Thyrocare's quarterly active franchise count is approximately 11,700, underscoring its PAN India reach and the strategic emphasis on underserved regions. This network, along with the expanded allergy and genomics testing, is positioned to support the next leg of growth as the company continues to expand its specialty portfolio and improve clinical trust.
Thyrocare Stock Price And Q1 FY27 Performance Breakdown
Key metrics from the quarter demonstrate a continuing trajectory of profitability and scale. Consolidated net profit rose to Rs 52.19 crore, up 34.06% YoY. Revenue from operations climbed to Rs 240.02 crore, up 24.34% YoY. PBT reached Rs 68.29 crore, up 35.28% YoY, and EBITDA was Rs 77.27 crore with a 32.2% EBITDA margin in Q1 FY27, compared with 29.9% in Q1 FY26. Pathology revenue stood at Rs 225.6 crore, a 26% YoY increase; within pathology, franchise revenue grew to Rs 142.8 crore, up 27% YoY, and partnership revenue rose 26% YoY.
| Metric | Q1 FY27 Value | YoY Change | Q1 FY26 (If Available) |
|---|---|---|---|
| Consolidated Net Profit | Rs 52.19 crore | 34.06% | Rs 38.93 crore |
| Revenue From Operations | Rs 240.02 crore | 24.34% | To be announced |
| PBT | Rs 68.29 crore | 35.28% | To be announced |
| EBITDA | Rs 77.27 crore | 34% | To be announced |
| EBITDA Margin | 32.2% | To be announced | 29.9% |
| Pathology Segment Revenue | Rs 225.6 crore | 26% | To be announced |
| Franchise Revenue | Rs 142.8 crore | 27% | To be announced |
| Tests Processed | 55.2 million | 28% | To be announced |
| Revenue Per Test | Rs 39.8 | -2% | To be announced |
| Revenue Per Patient | Rs 404 | 7% | To be announced |
| Active Franchise Count | Approximately 11,700 | To be announced | To be announced |
Specialty diagnostics has become the next frontier for Thyrocare. The company has started with allergy testing and genomics, including non-invasive prenatal testing (NIPT), and plans a phased expansion of its test menu. This strategic pivot emphasizes clinical trust, high-quality standards, and industry-leading turnaround times, aiming to differentiate Thyrocare from peers who rely primarily on routine pathology services.
In the broader market context, Thyrocare continues to expand its reach in underserved regions and scale its franchise and partner network while maintaining a commitment to affordable, high-quality healthcare services across India. The strategic mix of network expansion and a diversified test portfolio could be a key driver of future growth, particularly if the specialty diagnostics menu gains market traction and adoption in tier 3 and tier 4 cities.
Analysts note the momentum in resource allocation toward network expansion and value-driven diagnostics. The company has also been cited for focusing on operational efficiency and reducing turnaround times across its network, which remains a critical factor for patient trust and repeat business. This combination of growth levers sustains a sharper focus on margins and revenue per test while continuing to push volume growth in tests processed.
For investors seeking deeper, structured insights on Thyrocare and similar stocks, Swastika's Sarthi AI stock assistant offers an institutional-level lens on Thyrocare and similar stocks. Swastika's Sarthi AI stock assistant can help you model scenarios and compare performance across peers in the diagnostics space.
Pathology Segment Growth In Q1 FY27: Revenue, Franchise, And Tests
The pathology segment remains the growth engine of Thyrocare's business. Revenue within this segment rose to Rs 225.6 crore in Q1 FY27, reflecting a 26% year-on-year increase, while within pathology, franchise revenue climbed to Rs 142.8 crore, up 27% YoY. Partnership revenue also rose by 26% compared with the year-ago period. The segment's performance aligns with the company's broader strategy to expand the franchise network and strengthen partnership models across India.
Operationally, the company processed 55.2 million diagnostic tests during the quarter, an increase of 28% YoY. The revenue per test stood at Rs 39.8, down 2% YoY, while revenue per patient rose 7% to Rs 404. The network expansion contributed to higher throughput and better capacity utilization across the lab network.
Franchise And Partnership Revenue Trends In Q1 FY27
Franchise revenue remains a critical pillar of Thyrocare's growth. It rose to Rs 142.8 crore in Q1 FY27, up 27% YoY. The company's franchise and partnership revenue growth reflects the effectiveness of its capillaries into smaller towns and semi-urban areas, a trend that is expected to benefit margins and scale over time. The partnership revenue, though reported with a multiple of base numbers, rose 26% YoY, signaling a strengthening of the collaborative revenue model that complements the core franchise system.
With approximately 11,700 quarterly active franchises, Thyrocare has built a broad network across PAN India. The expansion into specialty diagnostics further increases the weight of franchise earnings by offering higher-margin, value-added tests through its partner network. The emphasis on training, quality assurance, and standardized protocols supports a consistent service level across the network and plays a key role in patient retention and brand trust.
Operational Efficiency And Diagnostic Test Volume In Q1 FY27
From an operations perspective, Thyrocare delivered a robust test volume: 55.2 million diagnostic tests processed in the quarter, up 28% YoY. The cost structure and turnaround time improvements strengthened EBITDA margins to 32.2%. The revenue per test figure of Rs 39.8 declined slightly due to mix and pricing dynamics, but the revenue per patient increased 7% to Rs 404, indicating improved value capture per patient despite price erosion at the per-test level. The company’s automated laboratory network and standardized processes underpin these efficiency gains, enabling higher throughput with consistent quality.
Strategically, the company’s push into specialty diagnostics – allergen panels, genomics, and NIPT – is expected to broaden the test mix and elevate patient outcomes. The expansion into these high-value segments could drive better per-patient economics and create opportunities to leverage the existing network more effectively. As the portfolio diversifies, management will need to balance volumes with the costs of expanding the specialized testing capabilities and ensuring clinical rigor.
Specialty Diagnostics Expansion: Allergy Testing And Genomics Through NIPT
The specialty diagnostics journey for Thyrocare began with allergy testing and genomics, with a phased expansion of the test menu underway. The launch of NIPT marks a key milestone in this transition toward high-value diagnostics, where turnaround times, accuracy, and clinical trust become differentiators in a crowded market. This strategic pivot aims to capture incremental demand from patients seeking comprehensive diagnostic solutions in a single, trusted lab network with scale and reliability.
Allergy testing and genomics tests typically command higher margins and cross-sell opportunities within the franchise and partner ecosystem. Thyrocare's move into these segments could favorably impact future profitability if the company successfully expands test menus without compromising quality or turnaround times. The emphasis on clinical validity and evidence-based reporting will be essential in building trust with clinicians and patients alike, particularly in markets that previously had limited access to high-quality diagnostics.
From a regional perspective, Thyrocare's PAN India expansion – including underserved regions – is a critical enabler for the new specialty portfolio. With a larger national footprint, the company can offer broader coverage for allergy and genomics tests, better serving clinicians and patients who need faster, accurate results. The ongoing training of franchise partners and the standardization of testing protocols across centers will support scalable growth as the specialty portfolio grows.
Retail Investor Takeaways: Valuation, Profitability, And Growth Outlook
For retail investors, the key takeaway from Thyrocare's Q1 FY27 results is a company delivering robust topline growth while expanding the addressable market through specialty diagnostics. A 24.34% YoY rise in revenue to Rs 240.02 crore and a 34.06% YoY increase in consolidated net profit to Rs 52.19 crore signal a strong operating discipline. The PBT of Rs 68.29 crore and EBITDA of Rs 77.27 crore with a 32.2% EBITDA margin suggest the company is on a path to improved profitability as it scales the franchise network and broadens its test mix.
The pathology segment's growth, combined with a franchise network of roughly 11,700 active franchises, underscores a business model anchored in high-volume testing and recurring revenue from the franchise ecosystem. The revenue per test at Rs 39.8 and revenue per patient at Rs 404 show the importance of test mix and patient-level monetization as drivers of value creation.
From a growth perspective, the expansion into allergy and genomics, including NIPT, indicates a strategic pivot toward higher-margin services that can improve profitability per patient over time. The two-headed approach of scaling the existing lab network while adding high-value, high-margin tests could support a resilient revenue mix even if per-test price pressures persist. Investors should monitor the pace of test menu expansion, the uptake of specialized tests, and the ability to maintain industry-leading turnaround times – all of which contribute to a sustainable competitive edge in India's diagnostics landscape.
In sum, the combination of robust Q1 FY27 performance, a growing pathology franchise, a rising tests volume, and a disciplined expansion into specialty diagnostics gives Thyrocare a compelling growth narrative. The stock price implications will hinge on execution in the specialty space, the pace of network expansion, and the company's ability to sustain margins as volume grows. Investors might consider a staged approach to exposure as the franchise network scales and the specialty testing portfolio matures.
Frequently Asked Questions
What was Thyrocare's consolidated revenue from operations in Q1 FY27?
Rs 240.02 crore, up 24.34% year-on-year.
What was Thyrocare's consolidated net profit in Q1 FY27?
Rs 52.19 crore, up 34.06% YoY from Rs 38.93 crore.
How did the pathology segment perform in Q1 FY27?
Pathology revenue rose 26% YoY to Rs 225.6 crore, with franchise revenue at Rs 142.8 crore (up 27% YoY), and partnership revenue up 26% YoY.
How many diagnostic tests did Thyrocare process in the quarter?
55.2 million tests were processed, up 28% YoY.
What expansions are part of Thyrocare's specialty diagnostics strategy?
Expansion into allergy testing and genomics, including non-invasive prenatal testing (NIPT), with a phased expansion of the test menu.
How many active franchises did Thyrocare have in Q1 FY27?
Approximately 11,700 quarterly active franchises.
Conclusion
Thyrocare's Q1 FY27 results illustrate a company successfully navigating a transition from volume-led pathology to higher-margin, specialty diagnostics within a PAN India footprint. With revenue of Rs 240.02 crore and net profit of Rs 52.19 crore, the business delivered a 34.06% YoY improvement in earnings and a 24.34% rise in top-line, supported by a 26% YoY expansion in pathology revenue and a 27% rise in franchise revenue. The 55.2 million tests processed, at Rs 39.8 per test and Rs 404 per patient, reflect a robust scale-driven model as Thyrocare expands into allergy testing and genomics, including NIPT, through a phased, quality-first approach.
Open your trading and demat account here
Reference :

Geopolitical Tensions And The Nifty Share Price: What Friday's Sell-Off Means For Indian Retail Investors
Key Takeaways
- Geopolitical tensions and rising crude prices pushed the nifty share price lower.
- The nifty share price traded around 23,623 with intraday lows near 23,611.20; the bombay stock exchange sensex hovered near 75,543.
- Realty, Auto, Rural and Defence sectors led the declines, while smallcaps and midcaps also weakened.
- Retail investors should stay disciplined, build a watchlist, and consider Swastika's Sarthi AI stock assistant for research.
Friday’s sell-off delivered a sharp reminder that global tensions and macro shocks can quickly translate into local market moves. The nifty share price slid as the broad-based decline took hold across the Nifty 50 and the Bombay Stock Exchange Sensex, with quotes showing the Nifty 50 down 1.03% to 23,623 as of 10:10 IST. The Sensex slipped 1.11% to 75,543, and the intraday momentum priced in further losses–nifty share price fell as low as 23,611.20, while the Sensex dropped to 75,504.
Three dynamics shaped the day: geopolitical tensions rising, crude prices on the rise, and weak global cues. Each thread reinforced the other, creating a risk-off mood that weighed on the nifty share price. In the backdrop, Brent crude crossed above $101 per barrel for the first time in two months, with WTI hovering near $92, as attacks in the Red Sea linked to Iran-backed groups amplified supply concerns.
In this sell-off, sectoral leadership flipped–Nifty Realty tumbled 1.82%, while Auto, Rural and Defence also fell. The broader market did not escape: Nifty Smallcap 250 slipped about 1.46%, and Nifty Midcap 150 declined around 1.25%. The global risk-off tone also showed up in futures: US stock futures were largely flat, with S&P 500 futures flat, Nasdaq-100 futures down around 0.26%, and Dow Jones futures lower by about 20 points. Asian markets joined the retreat, with Japan’s Nikkei 225 down 2.79%, Topix off 1.0%, South Korea’s Kospi sliding over 5%, and CSI 300 easing 1.4%.
Market Snapshot
| Metric | Value |
|---|---|
| 23,623 | |
| Nifty 50 Intraday Low | 23,611.20 |
| Bombay Stock Exchange Sensex Level (as of 10:10 IST) | 75,543 |
| Sensex Intraday Low | 75,504 |
| Brent Crude | Above $101/bbl |
| WTI Crude | Near $92/bbl |
| US Futures | S&P 500 futures flat; Nasdaq-100 futures down 0.26%; Dow futures around -20 pts |
| Global Cues | Nikkei 225 -2.79%; Topix -1.0%; Hang Seng -1.33%; CSI 300 -1.4% |
What should an individual investor take away from this complex confluence of drivers? First, view the move as a reminder that markets respond to a combination of macro signals rather than any single news item. Second, the sell-off may present selective opportunities for high-conviction stock ideas that align with a long-term plan, especially when valuations remain reasonable. Third, risk management becomes essential in the near term: set clear stop-loss rules, rebalance your portfolio, and avoid over-leveraging during heightened volatility.
In the near term, you can implement a disciplined plan: maintain a portion of your portfolio in cash or high-quality fixed income to reduce drawdown risk, but keep your SIPs active if you are investing for the long run. Build a watchlist of quality franchises with durable earnings, and use a structured framework to evaluate entries. If you’d like deeper stock-level research, consider Swastika's Sarthi AI stock assistant.
Nifty Share Price Drop: Friday Sell-Off And Implications For Retail Investors
The day’s action underscored that the nifty share price does not move in isolation. The move reflected a confluence of macro forces where geopolitical tensions and energy prices intertwine with global risk appetite. Traders watched a broad-based retreat across sectors, with the Nifty 50’s decline led by weight on the Realty sector. In this context, retail investors should assess whether their equity holdings reflect long-term goals or short-term reactions and consider whether currency of capital, risk budget, and time horizon align with current market conditions.
From a risk management perspective, it is prudent to re-check asset allocation and ensure air-tight stop-loss frameworks on individual positions. If you are building new positions, consider staggered entries or a systematic investment plan (SIP) approach to avoid chasing a single moment of fear. Long-term investors with robust financials and defensible franchises could see this environment as an opportunity to add selectively, but only where valuations and cash flows justify a buy. For stock-level insights and model-building, Swastika's Sarthi AI stock assistant can be a helpful companion in screening and evaluating ideas: Swastika's Sarthi AI stock assistant.
Crude Oil Surge And The Nifty 50 Stock Price: Reading The Market Pulse
The crude oil story remains central to market direction. With Brent crude trading above the $101-per-barrel mark for the first time in two months and WTI hovering near $92, fears of supply disruption fed risk-off sentiment. The attacks by Iran-backed Houthis on Saudi oil tankers and subsequent signaling of possible further actions intensified concerns about shipping routes and the Strait of Hormuz, although the market remains focused on the broader macro narrative. For the nifty 50 stock price, crude price surges often translate into higher input costs for multiple sectors, while inflation expectations can temper consumer demand and cap earnings growth in near-term quarters.
In such episodes, it is helpful to monitor how commodity-linked sectors perform relative to more insulated names. While the near-term volatility can trigger drawdowns, it may also reveal mispriced opportunities in quality businesses whose earnings power remains intact over the long horizon. The key for retail investors is to separate skillful, thesis-driven ideas from speculative punts, using a structured process to validate potential entries and risk controls.
SGX Nifty Live Share Price And Sensex Live Price Dynamics
A quick glance at the SGX nifty live share price can provide a morning read on where the nifty share price might open in Indian trade. The global backdrop–comprising flat US futures, weakness in major Asian indices, and oil-price pressures–often foreshadows the opening tilt for Indian markets. Similarly, sensex live price quotes–daily intraday highs and lows–help traders gauge momentum and polarity across large-cap names. In Friday’s session, the overnight and early-morning signals aligned with a cautious, risk-off stance that fed into the intraday declines observed in the Nifty 50 and Sensex.
Traders watching the sgx nifty live share price will want to pair that signal with a careful assessment of sectoral breadth as well as liquidity in small- and mid-cap segments. The day’s performance highlighted how global cues translate into domestic outcomes, reinforcing the importance of material risk controls and a disciplined investment plan for retail participants.
Market Sectors In Focus: Nifty Realty, Auto, Rural And Defence In The Sell-Off
The sell-off’s sectoral footprint offers a practical lens on what is driving the nifty share price lower. Realty led the declines with a 1.82% fall, reflecting a mix of cyclical and policy-sensitive concerns that can weigh on valuations when investor risk appetite contracts. Auto, Rural and Defence sectors also joined the red parade, underscoring breadth weakness that pressurizes both index levels and sentiment. The broader market faced pressure too, with Nifty Smallcap 250 down about 1.46% and Nifty Midcap 150 down around 1.25%.
From a portfolio perspective, the breadth signal matters as much as the points move. Serial declines across mid- and small-cap indices can test risk tolerance and force a re-evaluation of exposure to high-beta pockets. For long-term investors, this is often a reminder to anchor holdings in durable franchises while maintaining a flexible risk framework that can weather volatility without forcing hurried exits.
Practical Steps For Retail Investors Amid A Sell-Off
Here are practical steps you can apply right away, tailored for Indian retail investors navigating this environment:
- Revisit your risk budget and ensure you have a clearly defined plan for drawdown scenarios. If you’re near a life-stage or financial milestone, be even more conservative with equity exposure.
- Maintain discipline with systematic investments (SIPs) rather than attempting to time the bottom. If you’re already investing for the long term, use pullbacks to add to high-conviction, well-structured ideas rather than chasing momentum names.
- Build a watchlist of resilient franchises with durable earnings, robust balance sheets, and sustainable cash flows. Focus on quality rather than chasing the latest hot name.
- Use a robust risk-management framework: predefined stop-loss levels for individual positions and a periodic review cadence to rebalance against changing risk profiles.
- Educate yourself with stock-specific research and market context. For deeper insights, consider using Swastika's Sarthi AI stock assistant: Swastika's Sarthi AI stock assistant.
Related Reads
Frequently Asked Questions
What caused Friday's market sell-off in Indian equities?
A broad-based decline was driven by rising geopolitical tensions, a surge in crude prices (Brent above $101 per barrel, WTI near $92), and weak global cues.
Where did Nifty 50 and Sensex stand intraday as of 10:10 IST?
The Nifty 50 was at 23,623, down 1.03%, with an intraday low of 23,611.20. The Sensex was at 75,543, down 1.11%, with an intraday low of 75,504.
Which sectors led declines in the Nifty during the session?
Nifty Realty fell 1.82%, with Auto, Rural and Defence also among the laggards. The broader market weakness extended to small-cap and mid-cap segments.
What should retail investors do in response to this sell-off?
Maintain risk discipline, review exposures, consider SIPs for the long term, and use research tools like Swastika's Sarthi AI stock assistant to inform ideas.
How do global cues influence Indian markets in such times?
A mix of flat or weak US futures, regional market weakness, and oil-price surges can feed volatility. In this session, US futures were mixed, with Nasdaq and S&P futures down, and major Asian indices retreating.
Conclusion
The Friday sell-off is a reminder that the nifty share price moves in response to a blend of macro signals–geopolitics, energy prices, and global cues. For retail investors, the prudent takeaway is to keep a disciplined, long-term approach: do not chase a single day’s move, ensure your risk controls are in place, and use pullbacks as a potential entry point for high-quality ideas. In practice, this means re-checking asset allocation, sticking to SIPs where appropriate, and maintaining a watchlist of durable franchises that can withstand cyclical shocks.
Open your trading and demat account here
Reference :
1 : Ndtvprofit
Flipkart Share Price And Bengaluru Food Delivery: A Strategic Investor View
Key Takeaways
- Bengaluru becomes the testbed for Flipkart's food-delivery push.
- Regulatory concerns and a Rs 3,000 crore GST-avoidance allegation set a risk backdrop.
- Launch date is not officially announced; the pilot is expected within a month.
- Investors should watch the ONDC integration and execution to gauge flipkart share price trajectory.
For investors tracking the flipkart share price, Bengaluru is the new epicenter for a strategic test that could ripple across Indian e-commerce and retail. Reports indicate Flipkart plans to launch a food-delivery service starting in Bengaluru within a month, with a pilot rollout to test the offering before expansion. The company is exploring launching the service through a separate app and also making it available on ONDC. It is building a solid value proposition to compete in the crowded delivery space, while regulatory concerns loom in the background.
In this piece, we break down what this means for Flipkart's growth trajectory, how ONDC could alter the competitive landscape, and what retail investors should watch as more details emerge. We also explore the potential impact on the flipkart share price as investors assess execution risk, margin prospects, and regulatory risk. For deeper stock insights, consider Swastika's Sarthi AI stock assistant.
Flipkart Share Price Outlook As Bengaluru Food Delivery Initiative Takes Shape
As Flipkart tests this new delivery service, investors watch to see whether the model can scale beyond Bengaluru and what margins may look like. The test's success metrics include delivery times, restaurant onboarding, and the ability to monetize with a take-rate that supports profitability. While a long-run upside is plausible, the immediate impact on the flipkart share price remains contingent on execution and regulatory clarity. The company is reportedly exploring two paths for the service: a standalone app and ONDC participation, which could influence user acquisition costs and competitive dynamics.
Critical to understanding risk-reward is how the pilot aligns with Flipkart's broader strategy of leveraging commerce enablers to capture deeper customer value. If successful, this venture could accelerate cross-category sales and strengthen the network effects that drive marketplace economics. However, the regulatory backdrop adds a layer of complexity. Investors should monitor ongoing inquiries and any statements from the Competition Commission of India (CCI) related to online marketplaces, discounting practices, or GST compliance, as these factors could influence capital allocation and the path to profitability.
Bengaluru Food Delivery Pilot And Growth Trajectory For Flipkart
The Bengaluru pilot is designed as a controlled test of a food-delivery proposition that could inform expansion playbooks if it proves scalable and profitable. Reported to begin within a month, the pilot aims to measure customer adoption, restaurant onboarding, delivery speed, and the economics of a new delivery arm within the Flipkart ecosystem. If Bengaluru yields favorable unit economics, the next wave could target additional cities with a refined operating model for logistics and merchant partnerships.
From an investor lens, the crucial questions center on whether Flipkart can monetize delivery through higher order frequency, cross-sell opportunities, and improved customer retention. Margin discipline will hinge on efficient logistics, favorable take-rates, and the ability to keep delivery costs under control during scale. If the company can demonstrate consistent unit economics, the flipkart share price could reflect a blended expectation of growth and margin expansion over time.
OnDC And The Competitive Landscape: What Flipkart's Expansion Means For The Indian E-Commerce Market
Flipkart's delivery foray is expected to be tested on the Open Network for Digital Commerce (ONDC) as well as via a separate app, signaling a dual-track approach to capture market share and learn across channels. ONDC's open-network framework could tilt the competitive landscape in favor of platforms that collaborate with local restaurants, merchants, and delivery partners, potentially reducing consumer prices and enabling more rapid experimentation with discounting and bundling. The broader market impact hinges on how ONDC-driven cost efficiencies translate into service quality and merchant acceptance as the footprint expands.
Meanwhile, the FIRST association has argued to the CCI that Flipkart's GST-avoidance strategy enabled deep discounts and distorted competition on its marketplace. The pool of nearly Rs 3,000 crore cited in the complaint is a key reference point for the narrative around pricing power and supplier dynamics. While these assertions require formal adjudication, they highlight the regulatory risk that investors must weigh when considering any expansion into delivery segments and potential cross-subsidization across platforms.
Regulatory Scrutiny And The Rs 3,000 Crore GST Avoidance Allegation: Investor Risk
The regulatory frame around e-commerce discounts and GST compliance is increasingly prominent in Indian markets. The CCI's involvement in this case could influence Flipkart's strategic options, including how aggressively it discounts delivery or subsidizes merchant terms to drive adoption. The Rs 3,000 crore pool cited by FIRST underscores the scale of the potential leverage at play, and it remains a living risk that could evolve with ongoing investigations and policy clarifications. For investors, this creates a decision framework that weighs near-term regulatory risk against the potential for longer-term market share gains from a broader delivery platform.
As with any high-growth bet, the timing of regulatory actions matters as much as the actions themselves. If the authorities signal speedier clarity or more stringent guidelines, there could be a temporary re-rating of risk and a shift in how the market prices Flipkart's growth options. The upshot for traders and long-term investors is to stay attuned to official developments, earnings commentary, and how capital is allocated between growth experiments, acquisitions, and core marketplace profitability. The flipkart share price trajectory, while indirectly affected, will be a reflection of execution realism and policy clarity rather than a single news event.
Value Proposition, Pricing, And The Potential Impact On The Flipkart Share Price
Flipkart frames the new delivery venture as part of a broader effort to build a strong value proposition that can attract more frequent orders, stronger merchant partnerships, and higher-margin services around core marketplace offerings. The test's success will depend on pricing strategy, delivery speed, reliability, and the ability to offer compelling bundles that convert traffic into profitable orders. A sustainable take-rate and disciplined cost controls will be the primary levers that determine whether the new delivery arm adds to, or detracts from, overall profitability. In a high-discount environment, the challenge is to ensure that discounts do not erode margins beyond the point of long-term viability for the platform and its partners.
From an investor perspective, the path to a favorable flipkart share price reaction will hinge on clear, data-driven progress in Bengaluru and credible plans for scaling beyond the pilot. Look for signs of merchant onboarding rates, customer retention, unit economics, and the pace of ONDC integration. If these elements align with a credible growth story, the stock narrative could shift toward a balanced mix of top-line growth and margin discipline. Otherwise, investors should expect continued volatility as the market weighs execution risk and regulatory uncertainty.
Sarthi AI Stock Research: How Retail Investors Can Model The Potential Upside
To estimate the potential impact of Flipkart's delivery venture on shareholder value, retail investors can use a framework that incorporates path-dependency, capex intensity, logistics margins, and regulatory risk. A practical approach is to model base-case, optimistic, and downside scenarios, adjusting take-rate, order frequency, and average order value across time. Key inputs include: (i) test-market margins in Bengaluru, (ii) expected adoption rates in the early phase, (iii) ONDC-driven customer acquisition efficiency, and (iv) regulatory risk adjustments. Swastika's Sarthi AI stock assistant can help you simulate scenarios and translate qualitative factors into quantitative implications for the flipkart share price.
Dealers and retail investors can begin with a simple model: assume a base take-rate of X% on gross merchandise value, times Y million annual orders in the initial year, with growth assumptions across 2-3 years. Add a margin overlay for logistics and technology investments, and apply a probability-weighted discount rate to capture regulatory risk. The goal is to yield a range of outcomes and identify triggers that would cause re-evaluation. For more granular stock analysis, consider Swastika's Sarthi AI stock assistant.
Frequently Asked Questions
What is Flipkart reportedly planning in Bengaluru?
A Bengaluru-based pilot to launch a food-delivery service starting within a month, with testing before a broader rollout. The service is expected to run on a separate app and on ONDC.
Has Flipkart announced an official launch date?
No official launch date has been announced.
What is FIRST's complaint about Flipkart's business practices?
FIRST alleges predatory and discriminatory practices on Flipkart's marketplace and GST avoidance that allegedly created a pool of nearly Rs 3,000 crore to fund discounts.
What regulatory body has been approached regarding these concerns?
The Competition Commission of India (CCI) has been approached by FIRST regarding these concerns.
What is ONDC's role in Flipkart's delivery initiative?
Flipkart is exploring launching the service through a separate app and making it available on ONDC.
Conclusion
As Bengaluru becomes the proving ground for Flipkart's delivery ambition, investors should treat the outcome as a test of execution risk, capital allocation, and regulatory resilience more than a single headline about a new service. The path to sustainable upside will require disciplined margin management, evidence of merchant take-rates that support profitability, and a credible scale plan that translates pilot learnings into real market traction. The flipkart share price will reflect these dynamics as the story unfolds across cities, channels, and policy shifts.
Open your trading and demat account here
Reference :
1 : Ndtvprofit

Aia Engineering Share Price Momentum: Volume Surges And Retail Investor Insights
Key Takeaways
- AIA Engineering registered a 16.58x volume surge by 10:46 IST, signaling rising market interest.
- The aia engineering share price moved to Rs 4,535.00, down 0.93% from the prior close.
- Nuvama wealth management stock traded 1.74 lakh shares by 10:46 IST,up 1.43% to Rs 1,975.00.
- ICICI Prudential Life Insurance stock price traded 10.13 lakh shares by 10:46 IST, down 0.46% to Rs 499.35.
Can a single intraday volume spike reveal the market's appetite more clearly than a cautious earnings note? The latest snapshot around aia engineering share price suggests that traders and institutions may be parsing demand more keenly than headlines alone convey. By 10:46 IST, aia engineering stock registered 42,196 shares traded on the BSE, a 16.58-fold surge over the two-week average daily volume of 2,545 shares. The price stood at Rs 4,535.00, down 0.93% from the previous close, while last session volume stood at 2,130 shares. These numbers are not just abstract metrics; they are signals about the current rhythm of supply and demand in a market that rewards clarity over noise. For retail investors looking to gauge whether a move is a one-off blip or the start of a broader shift in interest, the confluence of price and volume is a reliable starting point. The following sections unpack what these signals mean for the aia engineering share price and its peers on BSE today.
Why volume matters in the context of price is not a trendy platitude; it is the simplest truth in price discovery. A price move accompanied by a surge in traded volume generally suggests that new participants are validating the move, whether they are short-term traders or longer-term buyers. In this batch of data, the aia engineering stock shows a pronounced volume spike relative to its two-week norm, which warrants deeper examination beyond the day’s price tick. In the sections ahead, we will place these figures in a broader context–how such volume patterns appear in other names and what they imply for a retail investor building a watchlist or deciding entry points.
Aia Engineering Share Price And Volume Surge: Reading The Data
The day’s data paints a focused picture: the aia engineering share price was Rs 4,535.00 as of mid-morning, with a decline of 0.93% versus the prior close. The volume by 10:46 IST was 42,196 shares on the BSE, translating to a 16.58x spurt over the two-week average daily volume of 2,545 shares. The last session itself recorded 2,130 shares traded. Taken together, these numbers suggest renewed interest in the stock, but the direction of the price move remains modest. For a retail investor, the key takeaway is that a volume spike does not guarantee an immediate breakout or breakdown; it signals that a broadening pool of participants is testing the stock’s demand at current levels.
| Stock | Price (Rs) | Change | Volume (Last Session) | 2-Week Avg Volume | Volume Surge (x) |
|---|---|---|---|---|---|
| AIA Engineering Stock | 4535.00 | -0.93% | 2,130 | 2,545 | 16.58x |
| Nuvama Wealth Management Stock | 1975.00 | +1.43% | 24,686 | 19,518 | 8.93x |
| ICICI Prudential Life Insurance Stock | 499.35 | -0.46% | 127,000 | 117,000 | 8.69x |
For context, another name in the same day’s report shows a much larger absolute volume, with ICICI Prudential Life Insurance stock price moving in step with a massive intraday turnover of 10.13 lakh shares by 10:46 IST, a surge of 8.69x over the two-week average daily volume of 1.17 lakh shares. The price here was Rs 499.35, down 0.46%. This juxtaposition–exceptionally high turnover across some names, with modest price moves–underscores a market still discerning between interest and conviction. The dimension of one stock justifying a multi-hundred-thousand-share day while another experiences a steeper, though still small, price drift, is a reminder that volume is a spectrum, not a verdict.
Beyond the AIA Eng and ICICI names, other stocks including nuvama wealth management stock, hcl technologies stock, and cyient stock price were among those cited as seeing surges in volumes on BSE today. Such cross-asset volume patterns can reflect a broader reallocation of capital among mid-cap vs large-cap or domestic vs foreign participation, depending on the sectoral tilt and macro cues. Retail investors should track which clusters of stocks are attracting interest and whether the price action aligns with the volume signal. The presence of a volume spike is not a standalone signal; it becomes meaningful when cross-checked with price action, sector context, and the depth of market participation.
For readers who crave a deeper, data-driven approach, Swastika's Sarthi AI stock assistant can help pull in institutional-grade analytics and tailor insights to your portfolio context. Swastika's Sarthi AI stock assistant can be a practical next step for investors seeking a structured framework to interpret such momentum signals alongside risk controls.
How The Aia Engineering Share Price And Volume Surges Compare With Sector Averages
To translate a single day’s data into a better sense of trend, compare the volume surge against its sector's norms. The 16.58x surge for aia engineering stock relative to its two-week average stands out, but it is not alone in observed interest–the same report notes a surge for other stocks as well, including nuvama wealth management stock and icici prudential life insurance stock price activity. When a stock overshoots its two-week average volume by a wide margin alongside an inconclusive price move, investors should watch for confirmation: does price drift align with the volume trend in subsequent sessions, or does the momentary interest fade? The answer requires a few practical checks: how many days of follow-through, what the intraday range looks like, and whether large players (institutions or banks) appear to have repositioned positions or rebalanced exposure.
For aia engineering stock, the delta between price and volume invites a cautious interpretation. A steeper intraday move could materialize if the price finds acceptance above a near-term resistance, but until price action shows sustained strength and the volume sustains or grows, risk-control measures remain essential for retail investors. Conversely, the 1.43% rise in the nuvama wealth management stock price to Rs 1,975.00 on a 174,000-share volume by 10:46 IST indicates a different rhythm–more robust immediate price momentum, albeit within a context of a two-week average around 19,518 shares. These kinds of contrasts illustrate the value of monitoring multiple names in parallel rather than chasing a single data point in isolation.
Another important layer is the attention paid by market participants to cross-asset signals. The report notes that ICICI Prudential Life Insurance stock price traded 1.013 million shares by 10:46 IST, an eightfold-plus surge relative to its two-week average of 117,000 shares. The price here fell to Rs 499.35, a reminder that volume alone without price direction can be ambiguous in its implications. The broader takeaway for a retail investor is to look for corroboration: are other names showing similar volume relief or rejection? Is the market breadth supportive, or are only select names participating in these abnormal volumes?
In practical terms, you should consider building a simple framework: (1) confirm the stock-specific price movement with the volume signal, (2) compare with two-week averages and intraday ranges, (3) observe whether other stocks in the same region or sector show parallel momentum, and (4) consider macro cues such as sector-specific demand, commodity prices, and liquidity conditions. The data from today’s report suggests that volume spikes can appear even when price moves are nuanced, reinforcing the importance of multi-factor analysis for retail investors seeking to navigate the Indian equity landscape responsibly.
To keep this approach grounded in real data, here are the key numbers from today’s observations for a quick reference: aia engineering stock price at Rs 4,535.00 with a -0.93% move and a 42,196-share turnover by 10:46 IST (16.58x vs two-week avg 2,545). Nuvama wealth management stock traded 174,000 shares with a +1.43% price move to Rs 1,975.00 (8.93x vs two-week avg 19,518). ICICI Prudential Life Insurance stock price moved to Rs 499.35 on a turnover of 1,013,000 shares by 10:46 IST, up from the two-week avg of 117,000 and a surge of 8.69x. The last-session volumes were 24,686 shares for nuvama and 127,000 shares for ICICI, respectively.
Practical Steps For Retail Investors To Monitor Aia Engineering Stock And Its Peers
Most retail investors do not need to chase every spike; they need a disciplined process. Start with a watchlist that includes aia engineering stock, nuvama wealth management stock, and icici prudential life insurance stock price movements, plus cyclical peers like hcl technologies stock and cyient stock price to capture a broad sentiment. When you observe a sudden volume spike–such as the 16.58x surge seen today–wait for a confirmation signal in the form of a price test and a continuation or reversal pattern before acting. If you are already holding any of these names, consider setting a risk-limited plan: tier your entry, use a tight stop, and evaluate whether the move adds incremental conviction to your thesis about the stock’s fundamentals or simply reflects temporary liquidity shifts.
What Investors Should Watch Next For Aia Engineering Share Price And Its Peers
Next sessions will be telling. If the aia engineering share price holds above or around Rs 4,500 and the volume sustains or climbs, that would strengthen the case for renewed upside momentum anchored by broader participation. Conversely, if the price retests below the day’s low and volume fades, the risk of a near-term pullback increases. The dynamics observed in nuvama wealth management stock and icici prudential life insurance stock price activity–where double- or triple-digit volumes coincide with meaningful price moves–suggest a potential reallocation of liquidity if these patterns persist. Retail investors should remain patient, confirm with additional data points such as intraday ranges and sector momentum, and avoid overreacting to a single data point.
In sum, today’s data highlights how volume can act as a leading indicator of interest, even when price action remains modest. The aia engineering share price narrative is a reminder that momentum often unfolds across multiple days and across related names, not in a single instant. Staying patient, validating with follow-up sessions, and using a structured research tool can help you separate noise from signal and position your portfolio for the next move with greater confidence.
Frequently Asked Questions
What was the aia engineering share price movement on the latest session?
The aia engineering stock price was Rs 4,535.00, down 0.93% from the prior close, with a volume of 42,196 shares by 10:46 IST on the BSE, which is a 16.58x surge over the two-week average volume of 2,545 shares.
How did the volume in aia engineering stock compare to its two-week average?
By 10:46 IST, aia engineering stock displayed a 16.58x surge in volume (42,196 shares) versus a two-week average of 2,545 shares.
What was the volume and price movement for nuvama wealth management stock on the same day?
Nuvama wealth management stock traded 174,000 shares by 10:46 IST, up 1.43% to Rs 1,975.00, with a two-week average daily volume of 19,518 shares, a surge of 8.93x.
What were the volume and price details for icici prudential life insurance stock price on that day?
ICICI Prudential Life Insurance stock price traded 1,013,000 shares by 10:46 IST, down 0.46% to Rs 499.35, against a two-week average daily volume of 117,000 shares, a surge of 8.69x. Last session volume was 127,000 shares.
Which other stocks were noted for volume surges on BSE on July 24, 2026?
Other stocks noted for volume surges included hcl technologies stock and cyient stock price, among others mentioned in the report, indicating broader activity in the market on that day.
Conclusion
Retail investors should treat volume surges as a useful clue about market interest, not a guaranteed forecast of the next price move. The current data around aia engineering share price shows a notable volume spike alongside a modest price drift, underscoring the importance of confirmation through follow-up sessions and cross-checks with peers and sector signals. The prudent next step is to calibrate entries and risk controls while monitoring the momentum fabric across related names like nuvama wealth management stock and icici prudential life insurance stock price. This approach helps convert momentary interest into a well-considered investment thesis.
Open your trading and demat account here
Reference :
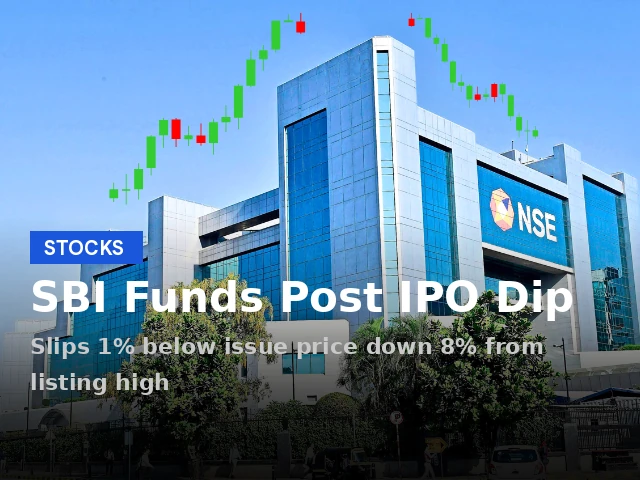
SBI Funds Management Private Limited Share Price: What The Post-IPO Move Means For Retail Investors
Key Takeaways
- The SBI Funds Management price moved below its issue price of ₹574 during intraday trading.
- It is down 8% from its listing day high of ₹625.
- The IPO subscription was robust, anchored by global and domestic funds including BlackRock and LIC.
- Retail investors should monitor market trends and consider risk controls and diversification.
Today, the sbi funds management private limited share price is under focus as investors assess the post-IPO trajectory. The stock slipped 1% to ₹572.15 in Friday's intraday deals and traded briefly below its ₹574 issue price. It is 8% down from its listing-day high of ₹625 touched on July 21, 2026. At 10:18 AM, the price was ₹574.05, about 0.62% lower than the prior tick, while the BSE Sensex fell 1.13%.
These numbers are not just digits; they reflect the shifting dynamics in Indian asset management leadership and the appetite for financial assets as household savings migrate toward active and passive funds. The sbi funds management private limited share price movements illuminate a market where faith in the business model must contend with macro swings, regulatory chatter and the competitive intensity of the mutual fund space. As an informed retail investor, you want to watch how price action aligns with evidenced demand in the IPO and the subsequent aftermarket.
| Event | Price (₹) | Date/Time | Notes |
|---|---|---|---|
| Listing Day High | ₹625 | Jul 21, 2026 | High watermark on listing day; currently ~8% above post-IPO levels |
| Intraday Price (Friday) | ₹572.15 | Jul 24, 2026 | Stock slipped 1% intraday; traded below issue price |
| Price At 10:18 AM | ₹574.05 | Jul 24, 2026 | 0.62% lower vs prior tick |
| IPO Issue Price | ₹574 | IPO Date | Offer price; anchor allotment raised ₹2,663 crore |
| Trading Volume | 1.8 Million | Jul 24, 2026 | NSE and BSE combined |
The IPO details paint a more complete picture of demand and expectations. The IPO was subscribed 41.6 times on the last day of bidding, led by qualified institutional buyers (QIBs) who bid 140.11 times. Non-institutional investors (NII) subscribed 22.51 times, retail investors 3.59 times, shareholders 9.51 times, and employees 4.65 times. This indicates a broad-based appetite with notable strength from institutional participants, which often underpins long-term performance narratives for asset managers.
Prior to the IPO, the anchor allotment raised ₹2,663 crore, a signal that marquee global and domestic investors were keen on aligning with SBI Funds Management’s growth story. Prominent anchor investors included BlackRock, Goldman Sachs, HDFC Mutual Fund, ICICI Prudential, Life Insurance Corporation (LIC) of India, Nomura India, and the Abu Dhabi Investment Authority. This mix of strategic backers is often viewed as a positive sign for institutional credibility and distribution reach, both of which are crucial for an asset manager whose value proposition rests on scale and a diversified product ecosystem.
What The SBI Funds Management IPO Subscription And Anchor Investor Backing Indicates For The Listing
The subscription metrics reveal a robust demand tail, especially from QIBs, which can signal confidence in the business model and growth runway. An IPO that is subscribed 41.6x on the final day, with QIBs bidding 140.11x, demonstrates strong cornerstone support and a readiness among large institutions to deploy capital in a leading asset management platform. Subscriptions from NIIs, retail, shareholders and employees – 22.51x, 3.59x, 9.51x, and 4.65x respectively – show a broad base of interest across different investor classes, which can set the stage for broad aftermarket liquidity and a sustainable trading dynamic post-listing.
Anchor investments by global and domestic players – BlackRock, Goldman Sachs, HDFC Mutual Fund, ICICI Prudential, LIC, Nomura India, and the Abu Dhabi Investment Authority – provide a vote of confidence in SBI Funds Management’s platform, distribution reach and potential for scale across mutual funds, SIPs and passive assets. This backing is particularly relevant for a company that is described by market observers as India’s largest asset management company by AUM, with leadership across mutual fund AUM, SIPs, and passive assets. The strength of the anchor cohort can translate into steadier flows and a durable competitive position in a crowded market, though it does not guarantee smooth sailing in all market conditions.
SBI Funds Management Listing And Aftermarket Performance: What To Monitor
With a listing high of ₹625 and current price action around ₹574, the stock sits about 8% below its listing-day peak. This is consistent with a post-listing consolidation phase typical for many new listings in the asset-management space, where initial euphoria gives way to a more measured price discovery process shaped by performance, product launches, and regulatory signals. Retail investors should watch how flows into mutual funds and the broader market environment influence AQAAUM growth (the asset manager’s average assets under management) and the pricing power of the various schemes under SBI Funds Management Private Limited.
Brokerage notes frame this as a growth story tethered to the health of equity markets and the trajectory of mutual fund revenue. For instance, Equirus Securities anticipates a 16% CAGR in overall mutual fund AQAAUM from FY26 to FY29, with a 17% CAGR in equity AQAAUM, suggesting the core equity exposure of SBI Funds Management remains a key engine. They project revenue growth of about 14% and EBITDA growth of around 15% CAGR, and they have initiated coverage with a LONG rating and a March 2027 target price of ₹627 per share. The risks highlighted include adverse market trends, potential underperformance by schemes, and regulatory shifts that could affect fee structures and profitability.
Brokerage Outlook On SBI Funds Management: Growth, Risks, And Valuation
Systematix Institutional Equities underscores the strategic value of having State Bank of India and Amundi Asset Management backing, framing SBI Funds Management as a dominant player across retail, institutional and alternative asset management segments. They emphasize SBI Funds Management’s broad distribution reach, deep penetration in metro and B-30 markets, and a brand-led growth path that leverages a diversified product portfolio and operating efficiency. This framing aligns with the market narrative that the stock could benefit from secular trends in household savings moving toward financial assets, provided performance stays competitive and there are no material regulatory headwinds.
ICICI Securities, meanwhile, stresses that earnings remain closely linked to equity market performance. Any material shift in mutual fund fee regulations could impact revenue and profitability, a risk that becomes more salient as the Indian mutual fund industry continues to evolve under regulatory oversight. Taken together, the brokerage notes present a nuanced view: the growth engine is intact but the stock’s multiple will hinge on how the company translates assets under management growth into sustainable revenue and margin expansion in a dynamic regulatory landscape.
For retail investors seeking more structured research and scenario analyses, Swastika offers a suite of tools designed to help translate complex market signals into actionable decisions. You can explore these insights through Swastika's Sarthi AI stock assistant, which provides institutional-level research on any stock or index to retail investors.
Practical Takeaways For Retail Investors: How To Approach The SBI Funds Management Private Limited Share Price Now
First, treat the current price around ₹574 as a potential entry narrative, not a verdict. The stock is 8% below its listing-day high and just about at or slightly above its issue price, depending on the tick. This suggests a price discovery process is underway and the near-term direction could be influenced by broader market sentiment, mutual fund cash flows, and any regulatory updates affecting fee structures or product mix. Investors should consider cash-on-hand, risk tolerance, and time horizon when deciding on exposure to SBI Funds Management Private Limited Share Price dynamics, because the asset manager’s long-term trajectory will be shaped by fund performance, distribution reach, and the ability to monetize a diversified product suite across the Indian market.
Second, watch the AQAAUM trajectories and the mix of assets under management. The brokerage outlook points to a growth pathway shaped by equity markets and mutual fund demand. The 16% CAGR in overall mutual fund AQAAUM projected by Equirus and the 17% equity AQAAUM CAGR imply a strong fundamental growth story, but market volatility, regulatory shifts, and scheme-level performance could temper the near-term potential. For investors with a longer time horizon, a measured approach – perhaps staggering entry points or scaling exposure with price-based risk controls – might align better with the potential upside from a leading asset manager backed by SBI and Amundi’s joint strengths.
Finally, always anchor your actions in a clear mental model rather than reacting to every tick. A practical framework is to separate price action from value; monitor whether the price stabilizes near a level where earnings growth, asset growth, and fee structure become sustainable. For retail investors who want ongoing updates and AI-powered research, consider using Swastika's Sarthi AI stock assistant to stay ahead of the curve.
Frequently Asked Questions
What is the current SBI Funds Management price movement after IPO?
As of 10:18 AM IST on Friday, the sbi funds management ipo price movement shows the stock at ₹574.05, down 0.62% from the prior tick; intraday trades had earlier slipped to ₹572.15, and the stock is trading below the issue price of ₹574 while being about 8% below the listing-day high of ₹625.
What were the SBI Funds Management IPO subscription metrics on the final day?
The IPO was subscribed 41.6 times on the last day; QIBs bid 140.11 times; NIIs subscribed 22.51 times; retail investors 3.59 times; shareholders 9.51 times; and employees 4.65 times.
Which anchor investors participated in SBI Funds Management IPO anchor allotment?
Anchor investors included BlackRock, Goldman Sachs, HDFC Mutual Fund, ICICI Prudential, Life Insurance Corporation (LIC) of India, Nomura India, and the Abu Dhabi Investment Authority.
What do brokerages say about SBI Funds Management's growth prospects and risks?
Equirus Securities expects a 16% CAGR in overall mutual fund AQAAUM FY26-FY29E, with 17% for equity AQAAUM and a March 2027 target price of ₹627; Systematix highlights SBI Funds Management’s dominant position and strong distribution network, backed by SBI and Amundi; ICICI Securities flags earnings sensitivity to equity markets and potential regulatory risk on mutual fund fees.
What should a retail investor do next with SBI Funds Management private limited share price?
Retail investors should monitor the price action, consider risk controls, and evaluate AQAAUM growth potential in the context of their time horizon. A disciplined approach—potentially using scenario analyses and tools like Swastika's Sarthi AI stock assistant—can help translate market signals into actionable decisions.
Conclusion
The current post-IPO trajectory of the SBI Funds Management private limited share price reflects both the strength of the business franchise and the volatility that accompanies new listings in a market where capital is dynamic and expectations are high. Retail investors should take a disciplined approach: acknowledge the anchor-backed growth narrative, study the IPO and subscription metrics, and monitor how AQAAUM growth translates into revenue momentum in a changing regulatory environment. The takeaway is not just about a price point; it is about understanding how a leading asset manager can compound value over time through scale, product diversity, and prudent capital allocation.
Open your trading and demat account here
Reference :

IndiGo Share Price Landscape After Q1FY27: What Retail Investors Should Know
Key Takeaways
- Q1FY27: Interglobe Aviation reports Rs 238 crore net loss as fuel costs spike by 86% YoY to Rs 10,833 crore.
- Revenue from operations rose 20% YoY to Rs 24,584 crore; total expenses up 34% to Rs 25,853 crore.
- CASK rose to Rs 5.71; CASK Ex-Fuel at Rs 3.22; Yield and RASK rose to Rs 6.04 and Rs 5.66 respectively.
- Brokerages raise price targets in the Rs 5,500–5,800 range; the stock closed around Rs 5,023.50 and remains volatile amid fuel cost volatility and yields.
An 86% surge in aircraft fuel expenses drove interglobe aviation results for Q1 FY27 into a net loss of Rs 238 crore, triggering volatility in the IndiGo share price as investors recalibrated risk and opportunity in India's premier domestic carrier. Revenue from operations rose 20% YoY to Rs 24,584 crore, while total expenses climbed 34% YoY to Rs 25,853 crore. The margin pinch is most visible in fuel costs, which jumped 86% YoY to Rs 10,833 crore, underscoring fuel as a dominant margin risk in a growth-driven sector. Against this backdrop, yield rose to Rs 6.04 and RASK to Rs 5.66, signaling pricing resilience even as the top line expands toward normalization. Given these dynamics, the question for the retail investor is not whether IndiGo can grow, but how it translates growth into sustainable profitability amid fuel-cost volatility.
IndiGo Share Price Landscape After Q1FY27: What Investors Should Watch
The Q1 FY27 results set a nuanced stage for the IndiGo share price. While revenue grew 20% YoY to Rs 24,584 crore, the net loss of Rs 238 crore shows how cost inflation dents profitability even in a growth environment. The 86% YoY jump in aircraft fuel expenses to Rs 10,833 crore underscores fuel as the dominant margin risk. The company's cost per available seat kilometre (CASK) rose to Rs 5.71, while CASK excluding fuel rose to Rs 3.22. Yield improved to Rs 6.04 and revenue per available seat kilometer (RASK) climbed to Rs 5.66, signaling pricing strength that could anchor a rebound if fuel costs ease.
Market observers will watch how the management's focus on yields, fleet efficiency, route rationalization and cost control translates into a more favorable earnings trajectory in the coming quarters. The stock price of interglobe aviation has reflected volatility as investors weigh the potential for higher passenger revenue per available seat kilometer (PRASK) against sustained fuel-price pressure and ex-fuel costs.
| Metric | Q1 FY27 | Q1 FY26 | YoY Change |
|---|---|---|---|
| Revenue From Operations | Rs 24,584 crore | Rs 20,496 crore | ↑ 20% |
| Total Expenses | Rs 25,853 crore | To be announced | ↑ 34% |
| Aircraft Fuel Expenses | Rs 10,833 crore | To be announced | ↑ 86% |
| CASK | Rs 5.71 | To be announced | To be announced |
| CASK Ex-Fuel | Rs 3.22 | To be announced | To be announced |
| Yield | Rs 6.04 | To be announced | To be announced |
| RASK | Rs 5.66 | To be announced | To be announced |
| Stock Price Close | Rs 5,023.50 | To be announced | To be announced |
interglobe aviation results show the same: Revenue from operations at Rs 24,584 crore for Q1 FY27, up 20% YoY to Rs 24,584 crore from Rs 20,496 crore in the corresponding quarter of the previous year. Total expenses rose to Rs 25,853 crore, up 34% YoY, reflecting a sharp 86% YoY rise in aircraft fuel expenses to Rs 10,833 crore. As a result, the carrier posted a net loss of Rs 238 crore for the quarter.
Operational metrics point to pricing resilience offset by fuel volatility. CASK rose to Rs 5.71, while CASK excluding fuel stood at Rs 3.22. Yield improved to Rs 6.04, and revenue per available seat kilometer (RASK) climbed to Rs 5.66. The stock price close on Thursday at Rs 5,023.50 sits against a backdrop of volatility, with the stock down around 2% so far in 2026 and softness in the past week and month, reflecting risk from fuel volatility and geopolitical uncertainties.
Fuel Cost Inflation: The Key Risk For Margins
Fuel price volatility remains the single biggest near-term risk to IndiGo's earnings trajectory. The 86% YoY rise in ATF expenses to Rs 10,833 crore demonstrates how quickly fuel costs can erode profit when yields cannot keep pace. Analysts have flagged energy price inflation as a major risk to the quarter's numbers, even as yields hold up. The management's guidance highlights a path to improved profitability through pricing, fleet efficiency, route rationalisation and disciplined cost control; fuel price volatility remains a key risk to near-term earnings.
For a deeper, institutional-grade view, Swastika's Sarthi AI stock assistant offers ongoing stock research across IndiGo and the broader market. Swastika's Sarthi AI stock assistant can help you compare scenarios, including fuel-cost sensitivity and price elasticity, as you calibrate your investment thesis.
Pricing Strategy, Yields And Capacity Discipline: The Path Forward
The management's stance on prioritising yields over growth – supported by fleet efficiency gains, route rationalisation and disciplined capacity management – continues to shape a cautious but constructive growth story. Management indicated more than 25% YoY growth in passenger revenue per available seat kilometer (PRASK) in Q2 FY27, with capacity growth remaining modest to single-digit for FY27. The recovery in regional operations, aided by Middle East normalization, supports a gradual earnings rebound as fuel price pressures ease. Yet, external headwinds such as geopolitical uncertainty and high ex-fuel CASK could weigh on the near-term earnings trajectory. Investors should watch how the yields trend interacts with fuel-cost dynamics as the company tests pricing power in a more constrained capacity environment.
Brokerage Views And Price Targets After Q1FY27
The broker community continues to view IndiGo as a high-quality aviation franchise with international expansion opportunities. Citi maintains a Buy rating with a target price of Rs 5,800, up from Rs 5,100. Nuvama also remains constructive with a Buy rating and a target price of Rs 5,583, up from Rs 5,335. JM Financial keeps an Add rating with a target price of Rs 5,630, indicating an upside of roughly 12% from the prior close. Taken together, these targets imply a price range in the mid-Rs 5,500s to high-Rs 5,800s, reflecting optimism on yields and disciplined capacity, even as fuel volatility remains a risk.
Frequently Asked Questions
What were IndiGo's Q1FY27 results?
Interglobe Aviation reported a net loss of Rs 238 crore for Q1 FY27; Revenue from operations was Rs 24,584 crore; Total expenses Rs 25,853 crore; Aircraft fuel expenses Rs 10,833 crore; CASK Rs 5.71; CASK Ex-Fuel Rs 3.22; Yield Rs 6.04; RASK Rs 5.66; The closing stock price was Rs 5,023.50.
Why did IndiGo incur a loss despite revenue growth?
Fuel cost inflation rose sharply, with aircraft fuel expenses up 86% YoY to Rs 10,833 crore, which weighed on profitability even as revenue grew.
What is the outlook for yields and capacity in Q2 FY27?
Management indicated more than 25% YoY growth in PRASK in Q2 FY27, with capacity growth expected to be in the single digits for FY27, signaling continued yields focus with modest capacity expansion.
What are the brokerages' price targets for IndiGo after Q1FY27?
Citi: Rs 5,800; Nuvama: Rs 5,583; JM Financial: Rs 5,630.
How did IndiGo's stock perform around the Q1FY27 results?
The stock closed at Rs 5,023.50; it was down around 2% year-to-date in 2026 and had fallen more than 4% over the prior week and more than 3% over the prior month.
Conclusion
This article was published without a generated conclusion. Please review and add a conclusion before publishing.
Big Budget






.avif)



START YOUR INVESTMENT JOURNEY
Get personalized advice from our experts
- Dedicated RM Support
- Smooth and Fast Trading App
