
Nifty Share Price And Market Pulse: Key Movers, IPO Watch, And Real Estate Leads


Key Takeaways
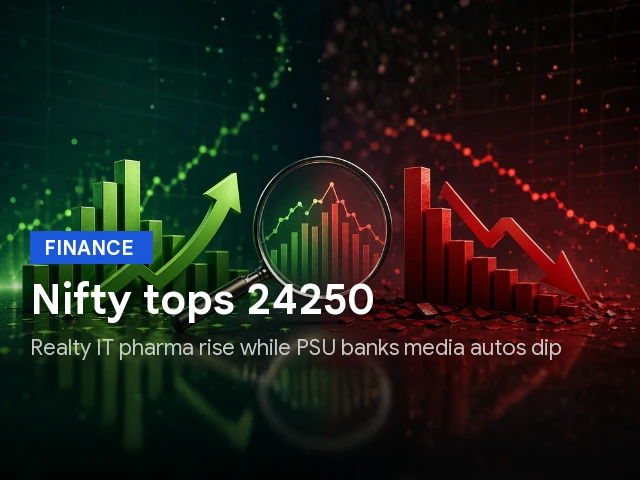
- Nifty share price closed at 24,270.85, up 95.15 points (0.39%).
- Sensex rose to 77,763.91, up 261.79 points (0.34%), with breadth positive across large caps.
- Nifty Realty index jumped 2.19% to 890.80, led by Lodha Developers up 5.08% among realty movers.
- Knack Packaging IPO subscribed 57.46x with price band 161-170 and a minimum lot of 88 shares.
nifty share price momentum continued as barometers extended their winning streak to a third session. The nifty share price at the close was 24,270.85 for the Nifty 50, up 95.15 points or 0.39%, while the Sensex rose 261.79 points to 77,763.91, a gain of 0.34%. Over three sessions, the Sensex has gained 1.68% and the Nifty 1.69%, signaling improving risk appetite despite intraday volatility. The India VIX slid 3.98% to 11.80, signaling a softer near-term volatility environment. In the broader market, the BSE 150 MidCap Index fell 0.25% while the BSE 250 SmallCap Index rose 0.09%, painting a nuanced view of market breadth.
Nifty Share Price Movements: Above 24,250 As Three-Session Rally Continues
Realty, IT, and pharma stocks led the advance as the Nifty Realty index climbed 2.19% to 890.80, continuing a four-session run with an 8.78% gain across the period. Real estate movers included lodging a broad rally: Lodha Developers up 5.08%, Oberoi Realty up 3.45%, Anant Raj up 3.37%, Brigade Enterprises up 3.32%, DLF up 2.73%, Phoenix Mills up 1.95%, Godrej Properties up 1.24%, and Sobha up 0.72%. On the downside, Aditya Birla Real Estate fell 1.06% and Prestige Estates Projects fell 0.27%. These moves underscore a bias toward real estate plays on improving sentiment and funding activity.
Knack Packaging IPO Watch: Subscription Rate And Price Band
The Knack Packaging IPO opened on 01 July 2026 and closed on 03 July 2026. The issue was priced in a band of Rs 161-170 per share and allowed bids for a minimum of 88 equity shares and multiples thereof. Bids received stood at 1,08,97,61,376 against 1,89,64,018 on offer, resulting in a subscription of 57.46 times. This level of oversubscription indicates strong investor interest in the packaging niche and reflects anticipation of solid growth in end-use industries.
Lodha Developers Stock And Real Estate Movers: A Day Of Gains
The real estate space consolidated gains with Lodha Developers stock up 5.08%, contributing to the sector's broader strength. Oberoi Realty rose 3.45%, Anant Raj 3.37%, Brigade Enterprises 3.32%, DLF 2.73%, Phoenix Mills 1.95%, Godrej Properties 1.24%, and Sobha 0.72%–all adding to a positive tone for realty leadership. Meanwhile, Aditya Birla Real Estate declined by 1.06% and Prestige Estates Projects by 0.27%, underscoring that sector rotation included both winners and laggards in a high-beta space.
HCL Technologies Stock Price Action And AI Transformation Deal
The hcl technologies stock surged 5.80% after the company announced an agreement with a Europe-headquartered Fortune Global 50 Firm to transform their global digital workplace and enterprise networks using Artificial Intelligence. This move signals a widening adoption of AI-led modernization in enterprise IT infrastructure, potentially creating spillover benefits across tech services and related software ecosystems. The broader tech space remained responsive to AI-related news as large-cap software names displayed strength in today’s session.
Global Cues And Market Signals: US Jobs Data, PMI Readings, And Brent Crude
Global markets reflected a mixed but cautiously optimistic mood: most European indices traded lower, while Asian markets closed higher as weaker-than-expected US jobs data stoked expectations of a future Federal Reserve rate cut. Japan's services PMI rose to 52.2 in June from 50.0 in May, indicating renewed expansion, while China's services activity remained above the 50-mark with a PMI of 54.1. In the US, the Dow Jones Industrial Average climbed to a record close of 52,900.07 as 57,000 jobs were added in June, below May’s revised 129,000 and below expectations of 110,000; the S&P 500 rose slightly to 7,483.24 and the Nasdaq fell 0.8% to 25,832.67. The Independence Day holiday kept major exchanges closed in the US on this Friday, resuming normal trade on Monday.
Rupee And Commodities Snapshot: USDINR, Brent Crude
The partially convertible rupee hovered around 95.2100 per dollar, versus 95.3550 in the previous session, while Brent crude for Sep 2026 settlement gained 0.24% to $71.97 a barrel, contributing to the energy complex’s mixed but bounded volatility as global demand signals evolved.
Corporate And Market Depth: Key Corporate Moves And Broad Indicators
On the corporate front, Maharashtra Seamless rose 0.77%, and Zydus Lifesciences gained 3.63% after signing a MoU with Apollo Hospitals to introduce Shield, a Multi-Cancer Detection test available in India. Central Bank of India rose 0.68% after reporting YoY growth in global gross advances to Rs 3,54,895 crore as of 30 June 2026, up from Rs 2,75,595 crore as of 30 June 2025. PC Jeweller rallied 3.74% following a ~21% YoY revenue uptick for the quarter ended 30 June 2026. Mahindra & Mahindra Financial Services slipped 1.21% as disbursements were guided to about Rs 15,560 crore with YoY growth around 21% (excluding finance lease). Bajaj Finance gained 1.30% after new loans booked rose 20% YoY to 1.61 crore in Q1 FY27, compared with 1.35 crore in the corresponding quarter last year.
In the broader market, the Dow’s performance was notable with a 594.83-point rise to 52,900.07, a record, while the S&P 500 traded near 7,483 and the Nasdaq hovered around 25,833. The day’s market breadth showed a positive tilt as 2,264 shares rose and 1,975 fell on the BSE, with 206 unchanged, underscoring selective leadership amid broader consolidation. First Published: Jul 03 2026 | 4:16 PM IST.
Frequently Asked Questions
What was the Nifty share price close today and the Sensex level?
The Nifty 50 closed at 24,270.85, up 95.15 points (0.39%), while the Sensex settled at 77,763.91, up 261.79 points (0.34%).
Which sectors led the market today and what was the Nifty Realty index movement?
Realty, IT and pharma shares advanced, with the Nifty Realty index climbing 2.19% to 890.80, contributing to a four-session gain of 8.78%.
How did Knack Packaging perform as an IPO, including subscription rate and price band?
Knack Packaging IPO opened on 01 July 2026 and closed on 03 July 2026, with a price band of Rs 161-170. It was subscribed 57.46 times, with bids of 1,08,97,61,376 against 1,89,64,018 on offer; minimum lot is 88 shares.
What moved HCL Technologies stock today and what deal influenced it?
HCL Technologies stock rose 5.80% after announcing an AI-driven transformation deal with a Europe-headquartered Fortune Global 50 Firm to upgrade their digital workplace and enterprise networks.
What were the key US and global cues affecting markets today?
US job data showed 57,000 jobs added in June, with May revised to 129,000 and expectations around 110,000. The Dow rose to a record close of 52,900.07, while the S&P 500 and Nasdaq were around 7,483 and 25,833 respectively; markets also noted softer near-term volatility as India VIX fell 3.98% to 11.80.
Conclusion
For the retail investor, today’s session reinforces that resilient breadth and sector leadership can coexist with modest volatility, especially as realty, IT, and select pharma names outperformed. The next step is to build a framework that combines price action with fundamental signals from corporate news and macro data: use trend-following rules for broad exposures and selective, risk-managed bets on realty names or tech leaders showing AI-driven order books. To dive deeper into stock-level analysis and tailor ideas to your portfolio, consider Swastika’s Sarthi AI stock assistant, which can help translate today’s price moves into actionable ideas and risk controls: Swastika's Sarthi AI stock assistant.
As you digest these moves, keep a ready watchlist on the nifty share price level around 24,250 to 24,500 and monitor the Nifty Realty, IT, and pharma segments for continued leadership. Use the current data as a baseline to assess how fresh IPO activity, like Knack Packaging’s robust subscription, and AI-driven corporate strategies might shape risk and return in the weeks ahead. The interplay between domestic strength and global cues will likely keep the market range-bound with selective bursts of upside, making disciplined position sizing and scenario planning essential for retail investors.
Latest Articles

Income Tax Return Extended: July 2026 Tax Dates Every Indian Investor Should Track


Key Takeaways
- July 2026 brings six essential tax dates that retail investors must track for refunds, penalties, and cash flow.
- July 7 is the due date for depositing TDS for the April–June quarter under the quarterly payment scheme.
- July 31 is the core income tax return extended deadline for FY 2025-26 and includes quarterly TDS/TCS returns and several forms.
- Missed deadlines can lead to belated returns, interest on unpaid tax, and adjustments to loss carry-forwards.
July 2026 isn't just about monsoons and vacations – it's a stress test for your tax calendar and your cash flow. The income tax return extended window for FY 2025-26 begins now, and six deadlines this month will shape refunds, penalties, and the viability of your investment plan. For retail investors, aligning your trades and holdings with these dates can prevent avoidable interest charges and ensure you preserve losses for future years. This is not just about ticking boxes; it's about keeping liquidity intact for opportunities in equities, mutual funds, and fixed income as you navigate the monsoon season.
From the Finance Ministry's latest update, advanced technologies such as artificial intelligence, machine learning, and data analytics are being used to monitor tax compliance more precisely. The result is a stronger chance that slipping deadlines will trigger scrutiny or penalties. The good news is that you can navigate this with a structured plan and some practical steps. Note: All stock exchange data is delayed up to 3 minutes.
To help you orient, here are six July deadlines with practical implications for your filing strategy and investment decisions. Use this as a working calendar rather than a memory prompt – and consider tying reminders to your investment review cadence. If you want to explore stock-specific implications around these dates, Swastika's Sarthi AI stock assistant can help you model potential outcomes for your holdings. Swastika's Sarthi AI stock assistant
Income Tax Return Extended: Key July 2026 Dates For Indian Taxpayers
July 2026 brings six essential dates that every taxpayer must keep on their radar. The central theme is simple: for FY 2025-26, taxpayers must submit their income tax returns on or before July 31, 2026. This window is the heart of the month’s compliance activity and a critical driver for your year-end financial planning. Even if you are a stock market investor with a diversified portfolio, the ITR deadline interacts with how you report investment gains, carry-forwards, and deductions that can influence your tax outgo and net returns.
To help you plan, here is a compact view of the July calendar, with the six dates that set the pace for compliance and reporting. July 01 marks the start of the focus period; by July 7, the TDS flow for the April–June quarter becomes due for those under the quarterly payment approval scheme; by July 15, several mid-month reporting deadlines affect government offices, authorised dealers, stock exchanges, IFSC entities and intermediaries dealing with overseas investors; July 30 is the deadline for tax deductors to submit the challan-cum-statement relating to June deductions; and July 31 caps the month with the most important compliance date–ITR filing for FY 2025-26, along with quarterly TDS and TCS returns. Additionally, forms 10BA, 10E, 10H, 10CCE, and 10CCD are due by this same date.
Income Tax Return Filing Deadline: July 31 ITR Due Date For FY 2025-26
The July 31 deadline is the pivotal moment for individual taxpayers filing ITR-1 and ITR-2 for FY 2025-26. Missing this date triggers belated filing, which comes with additional charges. The intent behind this hard deadline is to spur timely reporting and to ensure that tax collections and refunds are processed within the same assessment year. If you anticipate a delay, you should understand the belated return process and its consequences, including possible restrictions on loss carry-forwards. The rule is strict but there are loop-holes and alternatives that your advisor can explain depending on your situation.
In practical terms for retail investors, this means ensuring that any capital gains, dividend income, rental income (if applicable) and other deductions are captured accurately in the ITR. It also underscores the importance of keeping a clean ledger of purchases, sales, and associated costs that affect your cost basis and subsequent tax treatment. If you have multiple income streams or complex investments, consider pre-filing a draft ITR to verify the data before the final submission.
Income Tax Itr Filing: Belated Returns And Carry Forward Losses
If you miss the July 31 deadline, a belated return can still be submitted before December 31 of the assessment year. Alternatively, you can file an updated return (ITR-U) within 24 months, subject to an additional payment. It is important to note that certain business or investment losses may no longer be eligible for carry forward if you do not file on time, which adds another layer of diligence for investors who are using loss harvesting to optimize future tax outcomes. In other words, timely reporting is not just about avoiding penalties; it directly affects the viability of future tax planning strategies tied to your investment results.
Income Tax Calendar: July 7 TDS Deadline For The April–June Quarter
The July 7 TDS deadline applies to deductors operating under the quarterly payment approval scheme. Delays beyond this date may invite interest and other statutory penalties. If you are an investor who employs funds managed through a family office, a private wealth service, or a portfolio management account, you will likely see TDS treated on your income in a structured way that interacts with your annual tax return. To keep this simple: timely TDS deposits prevent interest accruals and simplify year-end tax reporting for salaried and non-salaried income alike.
In practical planning terms for a retail investor, the July 7 deadline is not a stand-alone event. It ties into cash flow planning for Q1-Q2 of the financial year, the ability to adjust withholdings, and the overall tax efficiency of your portfolio. As you review your July finance calendar, ensure you align any equity or debt rebalancing with your expected TDS impact to optimize post-tax returns.
Income Tax TDS Return: July 31 TDS/TCS Returns And Related Forms
July 31 also governs quarterly TDS and TCS returns for the April–June period. This matters for salaries and payments made to non-resident taxpayers. In addition to the TDS/TCS returns, several prescribed forms must be submitted by the same deadline. Specifically, Form 10BA relates to rent-related deductions under Section 80GG, Form 10E covers relief on salary received in arrears or in advance, and Forms 10H, 10CCE, and 10CCD connect to foreign income and royalty-related tax benefits. For investors, keeping these forms in check helps ensure you are not missing deductions or facing mismatches that could trigger adjustments later in the process.
Challan-Cum-Statement And June Deductions: July 30 Deadline
July 30 is the key date for tax deductors to submit the challan-cum-statement relating to specified taxes deducted during June. This is not a date to overlook, especially for those with high-frequency trading, substantial salary income, or venture-related payouts that may trigger TDS. If you or your employer is under a scheme that requires quarterly filings, mark this date clearly in your tax calendar and ensure your records reflect the amounts deducted and the payments made to the tax authorities.
What Happens If I Miss The July 31 Deadline? Penalties, Interest, And Practical Tips
There are real consequences to missing the ITR deadline. In addition to late filing penalties, interest on unpaid tax may apply. Worse, certain business or investment losses may no longer be eligible for carry forward. If you miss the deadline, you still have options: a belated return (deadline December 31 of the assessment year) or filing an updated return (ITR-U) within 24 months, subject to an additional payment. The exact penalties and interest rates depend on the amount of tax due and the timing of the payment, so you should act quickly if you anticipate a delay. For investors, the key takeaway is to avoid let-it-slide scenarios that could affect your future tax planning and the post-tax performance of your portfolio.
June 30 Tax Deadline You Might Not Know About: Check Triggers, Timeline, Response Process
Beyond the July deadlines, there are other triggers to watch. The article notes a June 30 tax deadline that many taxpayers overlook. Being aware of such triggers helps you maintain a proactive stance on your tax year. The timeline and response process are designed to streamline compliance, but they also expose gaps if documentation and reporting are not thorough. A practical approach is to run a quick internal audit of your investment income, capital gains, and deductions every quarter to prevent a last-minute scramble in July.
How The Finance Ministry Sees Tax Compliance In The Digital Era
The stance from the government is clear: advanced technologies – including AI, ML, and data analytics – are being deployed to monitor tax compliance more precisely. The aim is to identify potential evasion early by analyzing data patterns and risk indicators. As an investor, this signals that your reported income and deductions should be accurate and well-documented. The best path is to adopt robust record-keeping practices, ensure reconciliation between your trading statements and tax filings, and be prepared to explain any discrepancies if questioned.
Frequently Asked Questions
What is the July 2026 deadline for income tax returns?
For FY 2025-26, taxpayers must submit their income tax returns on or before July 31, 2026.
When is the due date for the April–June TDS payment?
July 7, 2026, for deductors under the quarterly payment scheme.
Which forms must be filed by July 31, 2026?
By July 31, the challan-cum-statement for June deductions is due (deadline July 30 for the challan itself), and Form 10BA, Form 10E, Form 10H, Form 10CCE, and Form 10CCD must also be submitted by this date.
What happens if I miss the July 31 deadline?
You can file a belated return before December 31 of the assessment year or an updated return (ITR-U) within 24 months, subject to additional payment. Interest on unpaid tax may apply and some losses may not be eligible for carry forward.
What does the Finance Ministry say about tax compliance monitoring?
The Finance Ministry says AI, ML, and data analytics are being used to monitor tax compliance more precisely and to identify possible tax evasion by analyzing data patterns and risk indicators.
Conclusion
The July 2026 tax calendar is not merely a collection of dates; it is a framework that shapes your liquidity, your investment strategy, and your tax efficiency for the year ahead. For a retail investor, the core lesson is simple: align your investment decisions with the ITR filing window, monitor TDS obligations, and keep essential forms in order so you don’t lose opportunities to carry forward losses or claim deductions. Start by mapping these dates to your personal calendar and setting automatic reminders for July 7, July 15, July 30, and July 31. This is a practical, action-oriented approach that reduces stress and improves post-tax outcomes.

Kotak Bank Share Price And Deutsche Bank India Deal: A Retail Investor's Guide
Key Takeaways
- Kotak Bank Share Price moves as Kotak Mahindra Bank signs a strategic deal with Deutsche Bank India's private banking and wealth platform.
- Deal snapshot shows Rs 281.7 crore cash, ~Rs 29,000 crore loans, Rs 16,000 crore deposits, and Rs 10,500 crore AUM being transferred.
- About 150,000 customers and ~1,000 employees will transition, with closing expected by September 2027.
- Rationale centers on inorganic growth to strengthen Kotak's affluent and SME franchise while Deutsche Bank focuses on global private banking outside India.
kotak bank share price moves are in focus as Kotak Mahindra Bank signs a pivotal deal with Deutsche Bank India's private banking, affluent private banking and wealth management business. The cash consideration is Rs 281.7 crore, with loans being acquired totaling approximately Rs 29,000 crore (Euro 2.7 billion), deposits being acquired of Rs 16,000 crore (Euro 1.5 billion), and assets under management being acquired at Rs 10,500 crore (Euro 1.0 billion). The transaction will serve around 150,000 customers and transfer approximately 1,000 employees. The closing timeline is by September 2027, subject to regulatory approvals including from the Competition Commission of India. This move aligns with Kotak's inorganic growth strategy to strengthen its core franchise in the affluent and SME segments.
In this context, the strategic logic is clear: Kotak aims to broaden its footprint in the affluent private banking and wealth management space, aligning with Deutsche Bank India's onshore private banking and wealth management franchise that has supported Deutsche Bank's global Hausbank strategy. The combination enhances Kotak's distribution and advisory capabilities while enabling Deutsche Bank to focus on its global UHNW clients outside India as part of its portfolio simplification. Deutsche Bank notes its India operations remain a core market within its global network, which helps ensure continuity for Indian clients during the transition. The two banks project that continuity for Deutsche Bank India's onshore private banking and wealth clients will be preserved through the transition as integration progresses.
According to Ashok Vaswani of Kotak Mahindra Bank, This transaction aligns well with our focus on the affluent and SME segments. It is a strong strategic fit and makes sound commercial sense. It also brings a high-quality customer franchise and experienced teams and adds incremental scale and adjacency opportunities. We look forward to warmly welcoming these customers and colleagues to the Kotak family, and our priority will be on disciplined integration and ensuring continuity, while building further depth and capability in this business.
According to Kaushik Shaparia of Deutsche Bank Group India and Emerging Asia, This transaction marks an important step in sharpening Deutsche Bank's portfolio and focusing on areas where we have scale, strength, and the ability to deliver sustained returns. India's growing integration into the global economy reinforces its position as a core market for Deutsche Bank. As the leading European bank in the country, we are closely aligned with India's economic priorities, underpinned by our strong Corporate Bank and Investment Bank and the continued growth of our businesses, including DWS. We believe Kotak Mahindra Bank provides a strong domestic platform to ensure long-term continuity for our onshore private banking and wealth clients, while creating meaningful growth opportunities for our employees.
Deal Snapshot: Numbers Behind The Kotak Deutsche Bank Transaction
Here is the high-level numerical snapshot of the deal as disclosed by the primary source behind the announcement:
| Item | Value |
|---|---|
| Cash Consideration | Rs 281.7 crore |
| Loans Being Acquired | Approximately Rs 29,000 crore (Euro 2.7 billion) |
| Deposits Being Acquired | Rs 16,000 crore (Euro 1.5 billion) |
| AUM Being Acquired | Rs 10,500 crore (Euro 1.0 billion) |
| Customers Served | Around 150,000 |
| Employees To Transfer | Approximately 1,000 |
| Closing Timeline | Closing, including onboarding of customer relationships, employees and associated products, is expected by September 2027 |
| Regulatory Approvals | Subject to applicable regulatory approvals (including from the Competition Commission of India) |
From Kotak’s perspective, the deal is a targeted inorganic growth move designed to strengthen its core franchise in the affluent and SME segments. Deutsche Bank frames the transaction as part of its Global Hausbank strategy, focusing on core strengths while ensuring continuity for onshore clients in India. Deutsche Bank India’s onshore private banking and wealth clients are expected to receive continuity through the transition, with the broader on-ground operations seen as a core market within its global network.
The transaction is described as ROE accretive for Kotak Bank and CET1 accretive for Deutsche Bank. In practical terms, this means Kotak is expected to realize enhanced return on equity as it integrates the acquired portfolio, while Deutsche Bank anticipates a capital-strengthening effect on its CET1 ratio from the onshore asset transfer. The exact financial impact will depend on integration efficacy, cross-selling potential, and the pace at which the combined platform can scale within Kotak’s broader franchise.
On The Ground: What This Means For Kotak Private Banking And Kotak Wealth Management
The onshore private banking and wealth clients from Deutsche Bank India are expected to experience continuity during the transition. For Kotak, this creates a significant platform to bolster its kotak private banking and kotak wealth management capabilities, enabling deeper client relationships and more integrated wealth solutions. The combined platform could unlock cross-selling opportunities across Kotak’s deposit, loan, asset management, and advisory services, thereby strengthening client lifetime value and overall franchise profitability. Kotak’s management has framed this as a strategic opportunity to broaden its footprint in private banking and wealth management by leveraging the acquired client base, personnel and product capabilities.
From a client experience perspective, the integration will require careful alignment of advisory teams, product access, risk management, and technology platforms. Kotak has highlighted disciplined integration and continuity as a priority to avoid disrupting client relationships during onboarding. The success of the integration will likely hinge on effective client communication, retention of key relationship managers, and a smooth migration of product access including mutual funds, private wealth products, and advisory services.
In terms of market positioning, this deal reinforces Kotak’s strategy to pursue inorganic growth opportunities that strengthen its core franchise in high-value segments. The Deutsche Bank synergy adds scale and diversification to Kotak’s asset and wealth management capabilities. At the same time, Deutsche Bank’s rationale emphasizes rationalization of its global activities by focusing on core areas of strength, while retaining a strong India presence that supports its global network. The combined franchise thus has the potential to deliver enhanced client service capability and cross-border product access, supporting sustainable growth over the medium term.
Investors should monitor the progression of the integration plan and the timetable for onboarding customers and staff. The September 2027 closing target sets a multi-year horizon for realizing the anticipated synergies. The market will likely weigh the near-term integration risk against the longer-term potential for revenue and deposit growth from a richer, more diversified affluent client base. For more granular, stock-specific research during this transition, you can tap Swastika's Sarthi AI stock assistant here: Swastika's Sarthi AI stock assistant.
Frequently Asked Questions
What is the Kotak Deutsche Bank deal in India?
Kotak Mahindra Bank Limited will acquire Deutsche Bank India's retail banking, affluent private banking and wealth management business for Rs 281.7 crore in cash, along with transferring loans of about Rs 29,000 crore, deposits of Rs 16,000 crore and AUM of Rs 10,500 crore, serving around 150,000 customers and transferring approximately 1,000 employees. The closing is expected by September 2027, subject to regulatory approvals including from the Competition Commission of India.
What are the key financial terms of the deal?
Cash consideration is Rs 281.7 crore; Loans being acquired total approximately Rs 29,000 crore; Deposits being acquired total Rs 16,000 crore; AUM being acquired is Rs 10,500 crore.
How many customers and employees are involved in the transition?
Around 150,000 customers and approximately 1,000 employees will transfer to Kotak.
What approvals are required for the deal to close?
The deal is subject to regulatory approvals, including from the Competition Commission of India.
What is the strategic rationale behind the deal for Kotak and Deutsche Bank?
Kotak describes the acquisition as inorganic growth that strengthens its core franchise in the affluent and SME segments; Deutsche Bank views it as part of its Global Hausbank strategy, focusing on core strengths while ensuring continuity for onshore private banking and wealth clients in India.
Conclusion
As you evaluate the implications of this transaction, remember that the most important mental model is to think in terms of franchise strength, cross-selling potential, and the durability of the client relationship post-integration. The combination of Kotak's core strengths with Deutsche Bank India's onshore private banking and wealth platform could yield meaningful long-term value, provided the integration is executed with care and the client experience remains seamless.

Ola Electric Share Price Momentum: ola electric share price Signals Across Four Nifty500 Stocks
Key Takeaways
- Four Nifty500 stocks showed bullish RSI uptrends on June 30, 2026, with gains over 4%.
- Balrampur chini mills stock posted the highest RSI at 57.42 and CMP Rs 554.95.
- ola electric share price momentum: ola electric stock RSI 56.63; coromandel international stock price RSI 56.48; stock price of cochin shipyard RSI 53.67 with CMPs Rs 43.76, Rs 2,005, and Rs 1,507.9 respectively.
- RSI trending up signals momentum; use it with price action and risk controls.
On June 30, 2026, four stocks from the Nifty500 segment gained over 4% in an RSI Trending Up scan, based on data from StockEdge.com. The RSI trend-up occurs when the Relative Strength Index crosses above 50 from below, a classic signal that momentum is strengthening in price action. In this cluster, the ola electric share price momentum sits alongside peers in a broader rally. The four stocks highlighted were balrampur chini mills stock, ola electric stock, coromandel international stock price, and stock price of cochin shipyard. Retail investors across India are watching these momentum signals as a possible filter for further upside, while also considering risk controls and market context.
The figures below originate from StockEdge.com’s RSI Trending Up data. A cross above 50 from below signals that buyers have regained control after a period of consolidation. In this set, the RSI values moved higher from their prior readings, suggesting strengthening upward momentum in trading sessions around June 30, 2026. The following values summarize the momentum snapshot for each stock:
| Stock | RSI | Prev RSI | CMP (Rs) |
|---|---|---|---|
| balrampur chini mills stock | 57.42 | 45.76 | Rs 554.95 |
| ola electric stock | 56.63 | 45.47 | Rs 43.76 |
| coromandel international stock price | 56.48 | 48.07 | Rs 2,005 |
| stock price of cochin shipyard | 53.67 | 42.8 | Rs 1,507.9 |
Interpreting these numbers, balrampur chini mills stock posts the highest RSI among the quartet at 57.42, followed closely by ola electric stock at 56.63 and coromandel international stock price at 56.48. The stock price of cochin shipyard sits a bit lower at 53.67. The current market prices (CMP) reflect a diverse set of market caps within the Nifty500; balrampur chini mills stock trades around Rs 554.95, ola electric stock around Rs 43.76, coromandel international stock price around Rs 2,005, and stock price of cochin shipyard around Rs 1,507.9. This distribution suggests momentum was broadly positive on that date, with strength concentrated in mid-cap to large-cap sectors represented in the quartet.
For investors tracking momentum signals, this RSI uptrend snapshot highlights a pattern: when RSI crosses above 50 from below, additional upside is not guaranteed, but momentum tends to be more favorable in the near term. The four stocks listed here demonstrate how a momentum-based screen can surface opportunities across diverse sectors like sugar, mobility, agri-chemicals, and shipbuilding. If you want deeper, institution-level research on ola electric share price and peers, Swastika’s Sarthi AI stock assistant can help you evaluate scenarios and valuations in real time.
Ola Electric Share Price: ola electric share price RSI Uptrend Across Four Nifty500 Stocks
This section focuses on the primary momentum signal and how it manifests in the four stocks. The RSI Trending Up signal is triggered when RSI crosses above the 50 threshold from a lower level, indicating rising buying pressure and a potential up-move in price. In the June 30 data, the ola electric share price is part of a cluster with robust momentum indicators: the stock recorded RSI 56.63, up from Prev RSI 45.47, with a current price around Rs 43.76. The other three stocks show similar momentum strength, reinforcing the idea that a broad sector recovery or rotation could be contributing to sustained demand in this segment. When assessing the uptrend, it’s essential to consider price action, liquidity, and macro factors that influence Indian markets as retail participation widens.
In practical terms, RSI values in the mid-50s to high-50s range (as seen with ola electric stock and its peers) suggest traders are warming to the idea of higher prices, especially when the price action confirms the cross above 50. Traders often combine RSI with moving averages, volume patterns, and fundamental context to avoid over-reliance on a single indicator. For the current moment, the four stocks that flashed the RSI Trending Up signal present a useful watchlist for momentum-focused investors to compare relative strength and potential entry points.
Stock-level Momentum Snapshot: Balrampur chini mills stock, ola electric stock, coromandel international stock price, stock price of cochin shipyard
From a stock-level perspective, the highest RSI belongs to balrampur chini mills stock at 57.42, signalling the strongest near-term momentum among the four. ola electric stock sits close behind with 56.63, while coromandel international stock price registers 56.48. The stock price of cochin shipyard is at 53.67 RSI, indicating solid momentum yet relatively softer than the other three. The corresponding CMP readings–Rs 554.95 for balrampur chini mills stock, Rs 43.76 for ola electric stock, Rs 2,005 for coromandel international stock price, and Rs 1,507.9 for stock price of cochin shipyard–provide a quick reference on where the market currently prices these momentum signals. Traders should monitor how RSI holds above 50 as the next price action unfolds, and whether price patterns corroborate the momentum in subsequent sessions.
How Retail Investors Can Use RSI Uptrend Signals With Risk Management
RSI Uptrend signals, defined by crossing above 50, are most meaningful when paired with confirmation from price action and volume. In this instance, the four stocks showed momentum uplift on a single day; sustained rallies typically require follow-through days and supportive macro conditions. Retail investors should consider setting clear entry and exit rules, such as using a moving-average cross or a stop-loss based on recent swing lows, to avoid being swept into fleeting moves. With ola electric share price and the other three stocks, you could watch for consolidation beneath nearby resistance levels and rising accumulation signals before initiating a position. Remember that the momentum signal alone is not a guarantee; a disciplined risk framework remains essential for long-term capital protection.
Frequently Asked Questions
What does RSI Trending Up indicate for momentum in these four stocks?
RSI Trending Up indicates RSI values rising above 50 from below, suggesting strengthening momentum in price action. On June 30, 2026, four Nifty500 stocks showed this pattern according to StockEdge.com data.
Which four stocks were flagged in the RSI Trending Up scan on June 30, 2026?
balrampur chini mills stock, ola electric stock, coromandel international stock price, and stock price of cochin shipyard were flagged.
What were the RSI values for each stock in the scan?
balrampur chini mills stock 57.42; ola electric stock 56.63; coromandel international stock price 56.48; stock price of cochin shipyard 53.67.
What are the current market prices (CMP) for these four stocks?
balrampur chini mills stock Rs 554.95; ola electric stock Rs 43.76; coromandel international stock price Rs 2,005; stock price of cochin shipyard Rs 1,507.9.
Where did these RSI numbers come from?
The RSI values come from StockEdge.com data as cited in the RSI Trending Up scan.
How should a retail investor use RSI Uptrend signals in practice?
RSI Uptrend signals should be used in conjunction with price action, risk management, and other indicators to build a robust entry/exit plan.
Conclusion
The momentum seen on June 30, 2026, in the RSI Trending Up cluster is a snapshot of relative strength that may indicate continued upside for a short-to-medium horizon. For retail investors, the key takeaway is not to chase momentum blindly, but to monitor which names sustain RSI above 50 and how price action confirms the move. The four stocks–balrampur chini mills stock, ola electric stock, coromandel international stock price, and stock price of cochin shipyard–showcase varied but synchronized momentum patterns, offering a practical watchlist for momentum-aware traders across India. One actionable next step is to build a watchlist, track RSI for these names, and apply a risk-managed entry plan when RSI remains above the 50 level and price action confirms a breakout from consolidation.

Kpit Technologies Share Price: 15% Circuit Shock and The Long-Term Growth Tale for kpit technologies share price
Key Takeaways
- kpit technologies share price plunged 15% on July 1, 2026 as the Q1 FY27 outlook triggered a risk-off reaction.
- Q1FY27 revenue is expected to decline around 1% YoY versus Q1FY26, with margins dipping more than revenue.
- Growth hinges on outsourcing, AI-led productivity, and client wins in the US, Korea, and India, supported by a growing pipeline.
- The order book is described as resilient and the pipeline is expanding, signaling a rebound in H2 FY27 and into FY28.
On July 1, 2026, KPIT Technologies shares faced a 15% lower circuit, a move that jolted retail investors and raised questions about the near-term risk-reward. The day’s low on the BSE was Rs 559.10 as investors digested a Q1 FY27 revenue outlook that pointed to a YoY decline of around 1% versus Q1 FY26, with margin pressure that could outpace revenue losses. For context, the kpit technologies share price swung on the announcement, highlighting the split between short-term pain and long-term opportunity. The company says fundamentals remain strong, with AI-led productivity initiatives and a growing pipeline setting the stage for FY28 and beyond.
What caused the 15% lower circuit and how it affects the kpit technologies share price
The 15% circuit reflects a reaction to the short-term revenue outlook for Q1 FY27. The outlook indicates a decline of around 1% year-on-year versus Q1 FY26, with EBITDA margin and net profit margin expected to decline sequentially by a proportionally larger extent than the drop in revenue. In practical terms, near-term price action is weak, but the core business remains structurally sound, backed by a resilient order book and a growing pipeline that supports long-term opportunities even as markets adjust to the latest fundamentals.
kpit technologies share price forecast: What the outlook implies for Q1 FY27 revenues and margins
The company reiterates a long-term growth story driven by outsourcing and automation, even as the near-term numbers look soft. The Q1 FY27 revenue outlook of a ~1% YoY decline comes with a more pronounced margin compression, setting up a scenario where investors should separate cyclic price action from chronic earnings power. Management emphasizes ongoing investments in AI-led products and solutions to capitalize on future opportunities, suggesting that the kpit technologies share price forecast may improve as efficiency gains materialize and new client relationships mature, particularly in the U.S., Korea, and India.
Understanding the kpit technologies order book and its implications for FY28
Described as resilient, the order book and the growing pipeline imply that demand remains intact despite near-term headwinds. This resilience supports the argument that the long-term framework–focused on sustainable and profitable growth for FY28 and beyond–is intact. The company points to growth in the Trucks and Off-Highway sub-vertical and expanding client acquisitions in the passenger vehicle segment as major catalysts, while the US, Korea, and India markets continue to contribute meaningfully to revenue and backlog momentum. In short, the kpit technologies order book remains a key pillar underpinning the optimistic view for the medium-to-long term.
Growth drivers, regional bets, and AI-led efficiency: The longer-term case for KPIT Technologies
Beyond the Q1 FY27 headline, analysts and investors should watch how growth drivers translate into margins over the next 6–12 months. The firm highlights Products and Solutions, and a focused push into AI-led productivity improvements as core strategic levers. Cost containment initiatives are also described as a structural tool to support margin resilience, especially in the face of near-term revenue volatility. The growth plan places a clear emphasis on outsourcing and automation to unlock efficiency gains in the U.S., Korea, and India, with renewed client acquisitions in the passenger vehicle segment signaling potential upside on a rebound in technology demand. The Covid-period trend is noted as a precedent for client behavior during times of macro stress, suggesting the current period could precede a similar rebound when conditions improve.
For retail investors, the near-term action should be weighed against the long-term trajectory. The stock price may remain volatile, but the underlying fundamentals–resilient order book, a growing pipeline, and AI-enabled productivity focus–align with a multi-year growth story. Investors who want deeper, data-driven insights can leverage Swastika’s Sarthi AI stock assistant to parse the company’s AI-driven initiatives, product lines, and client dynamics for a more nuanced view of future earnings potential.
What the near-term price action means for retail investors
While the 15% lower circuit signals caution, it also creates a potential entry point for investors who believe in the company’s long-term drive toward outsourcing efficiency and AI-enabled solutions. The price action reflects a market that is adjusting to a revenue outlook that is modestly negative in the near term but supported by a robust product portfolio and a pipeline that remains healthy. The low price point on the day–Rs 559.10–offers a reference for the range within which patient investors might evaluate a risk-balanced position, especially if the long-term growth drivers begin to translate into margin expansion in FY28 and beyond.
Frequently Asked Questions
What caused the 15% lower circuit in KPIT Technologies shares on July 1, 2026?
The lower circuit occurred as investors digested a Q1 FY27 revenue outlook showing a ~1% YoY decline versus Q1 FY26, with margins expected to decline more than revenue. The move reflected short-term price action amid concerns about margins, while the fundamentals of the business remained described as strong by the company.
What is the Q1 FY27 revenue outlook for KPIT Technologies?
Q1 FY27 revenue is expected to decline around 1% year-on-year compared with Q1 FY26. The EBITDA margin and net profit margin are expected to decline sequentially by a proportionately larger extent than the fall in revenue.
What are the growth drivers for KPIT Technologies in FY27 and beyond?
Growth is anchored in Products and Solutions, the Trucks and Off-Highway sub-vertical, and markets in the U.S., Korea, and India. Growth in the passenger vehicle segment with new client acquisitions is highlighted as a driver, supported by AI-led productivity and cost containment initiatives to improve margins.
What does the KPIT Technologies order book look like and why is it important?
The order book is described as resilient with a growing pipeline, forming the foundation for FY28 and beyond. This indicates sustained demand and supports the long-term outlook, even as near-term revenue and margins face headwinds.
What should a retail investor consider now regarding KPIT Technologies share price and long-term potential?
Investors should weigh near-term volatility against the company’s long-term growth story driven by outsourcing, AI-enabled productivity, and expanding client relationships. The company plans to continue investing in AI-led products and solutions, which could translate into margin improvements and growth in FY28. Monitoring the order book and pipeline will be key indicators of durable demand.
Conclusion
The near-term weakness in KPIT Tech’s stock price is a function of a temporary revenue headwind rather than a deterioration in the business model. While Q1 FY27 may show a ~1% YoY revenue decline with proportionally larger pressure on margins, the long-term story rooted in outsourcing, AI-led productivity, and strategic client expansion remains intact. Retail investors can take a two-step approach: first, assess the resilience of the order book and the pipeline as a leading indicator for FY28; second, watch for margin stabilization and incremental growth in the high-probability US, Korea, and India markets. By adopting a long-horizon perspective, investors can align with the company’s plan to sustain profitable growth and capitalize on an AI-enabled efficiency cycle that could unlock upside beyond FY27.

Sanctum Wealth Portfolio: NRIs’ Three-Wallet Strategy for India Growth
Key Takeaways
- The sanctum wealth portfolio allocates 45% to equities and 28–30% to cash/debt/arbitrage for NRIs.
- A three-wallet approach–global, residence-market, and India wallets–limits currency risk and aligns with goals.
- Gold at 10–12%, private-market alternatives at 10%, and REITs/InvITs at 5% build diversification.
- Long-run earnings growth matters more than short-term currency moves; SIP flows and mutual funds are rising in India.
In a rapidly transforming India, long-run wealth creation for NRIs hinges on a disciplined, currency-smart approach that accommodates multiple needs. The sanctum wealth portfolio framework–articulated by Shiv Gupta of Sanctum Wealth–advocates a 45% allocation to equities, complemented by a 28–30% slice for cash, debt and arbitrage, 10–12% in gold, 10% in private-market alternatives, and 5% in REITs and InvITs. This multi-asset mix is designed to capture India's structural growth while managing currency risk and liquidity across time horizons.
Beyond asset allocation, the model introduces the three-wallet concept: global wallet, residence-market wallet, and India wallet. The India wallet serves a distinct purpose and should complement, not duplicate, the others. The right size for each wallet depends on goals, liabilities and long-term plans. Currency matters, but long-run earnings growth matters more when measuring returns in the investor's reference currency.
What Is The Sanctum Wealth Portfolio Allocation For NRIs?
The recommended mix includes 45% in equities, 28–30% in cash, debt and arbitrage, 10–12% in gold, 10% in private-market alternatives, and 5% in REITs and InvITs. This allocation is designed to balance growth with liquidity and risk, while letting the India wallet capture domestic opportunities without duplicating global exposure.
| Asset Class | Allocation | Notes |
|---|---|---|
| Equities | 45% | Domestic exposure with a focus on manufacturing and digitalisation themes |
| Cash, Debt & Arbitrage | 28-30% | Liquidity + hedging and risk management |
| Gold | 10-12% | Diversification & inflation hedge |
| Private-Market Alternatives | 10% | Private credit, private equity, venture capital |
| REITs & InvITs | 5% | Real estate exposure with liquidity |
If an NRI were building a fresh ₹50 crore India portfolio today, allocation would be broadly as follows: 45% in equities, 28–30% in cash, debt and arbitrage, 10–12% gold, 10% private-market alternatives, and 5% in REITs and InvITs. The same framework applies, with customization based on liabilities, time horizon and risk tolerance.
Three Wallet Strategy: Global Wallet, Residence-Market Wallet, And India Wallet
The three-wallet concept helps segregate exposures by currency and jurisdiction. The global wallet captures opportunities outside India, the residence-market wallet aligns with where you live and manage daily finance, and the India wallet targets domestic growth and savings channels. Importantly, the India wallet should complement, not duplicate, the other two wallets, and the right size for each depends on goals, liabilities and long-term plans.
Why Currency Movements Matter Less Than Long-Term Earnings Growth
While currency movements affect final returns, the long-run earnings growth of Indian assets matters more when measured in the investor's reference currency. The rupee depreciation has genuinely reduced final returns, having weakened historically in stages, averaging roughly 3–4% a year over the long run. Short-term exchange rates matter far less than the sustained earnings trajectory of Indian equities and financial assets.
India's Growth Themes And The Sanctum Wealth Portfolio
Five structural themes are central to the sanctum wealth portfolio: manufacturing, digitalisation, financialization, infrastructure and consumption. Of these, financialization and manufacturing stand out as key drivers of long-term value creation for Indian markets. Domestic consumption, household savings and local capital markets do far more of the work than they did in the past, underscoring the importance of exposure to domestic growth alongside global opportunities.
Practical Implications For A Fresh ₹50 Crore India Portfolio
Applying the same allocation is a practical approach for a fresh ₹50 crore India portfolio today. The split would be 45% in equities, 28–30% in cash, debt and arbitrage, 10–12% in gold, 10% in private-market alternatives, and 5% in REITs and InvITs. The India wallet should be sized to capture domestic opportunities without duplicating global or residence-market exposures, and currency considerations should guide how you measure returns.
Common NRI Mistakes And How To Avoid Them
Some frequent missteps include comparing returns over short periods and extrapolating currency movements, failing to update residential status with banks and intermediaries after becoming an NRI, using the wrong account (NRE vs NRO) leading to repatriation and tax frictions, and neglecting foreign tax credits which can lead to double taxation. For larger estates, succession planning across multiple jurisdictions is often omitted. Addressing these issues early can save costs and preserve wealth over generations.
Within this framework, you can bridge opportunities across wallets and currencies, ensuring a disciplined, purpose-built approach to investing in India. Swastika offers Sarthi – an AI stock assistant that gives institutional-level research on any stock or index to retail investors – to help you analyze potential ideas within the sanctum wealth portfolio framework. This can be a natural bridge between what you learned and what you might do next.
Frequently Asked Questions
What is the Sanctum Wealth Portfolio allocation for NRIs?
The suggested mix includes 45% in equities, 28-30% in cash, debt and arbitrage, 10-12% in gold, 10% in private-market alternatives, and 5% in REITs and InvITs. The India wallet should complement other wallets and the exact weights depend on goals and liabilities.
How does the three-wallet strategy work for NRIs?
It uses a global wallet for exposures outside India, a residence-market wallet for the country of residence, and an India wallet for domestic opportunities. Each wallet serves a distinct purpose and should not duplicate the others; the size of each wallet depends on goals, liabilities, and long-term plans.
Why do currency movements matter in the sanctum wealth portfolio?
Currency movements affect final returns, but long-run earnings growth matters more when measured in the investor's reference currency. The rupee depreciation has historically weakened about 3-4% a year over the long run.
What are the growth themes behind the sanctum wealth portfolio?
Five structural themes—manufacturing, digitalisation, financialization, infrastructure and consumption—are important; financialization and manufacturing stand out as particularly influential.
What common mistakes should NRIs avoid when building this portfolio?
Don’t chase short-term returns or extrapolate currency moves; ensure residential status is updated with banks, use the correct NRE vs NRO account, claim foreign tax credits, and plan cross-jurisdiction succession for larger estates.
Conclusion
The sanctum wealth portfolio approach for NRIs is built to balance growth with liquidity, by design. By separating capital into three wallets and sticking to a disciplined allocation, you can capture India’s structural drivers–while protecting against currency volatility–and align investments with long-term goals.

Cupid share price Momentum: FY27 Growth Outlook From a Diversified Healthcare Play (cupid share price)
Key Takeaways
- cupid share price rose nearly 2% to Rs 193 as the FY27 guidance was lifted.
- Q1 FY27 revenue is on track to exceed Rs 150 crore, signaling an upbeat start to FY27.
- FY27 revenue guidance was raised to more than Rs 660 crore from Rs 600 crore, a 10% uplift.
- The growth outlook rests on a diversified business model, expanding international opportunities, and progress in MC/FC and IVD and tenders.
Cupid share price momentum is back in focus as the firm lifts its FY27 guidance and signals a multi-engine growth trajectory. Q1 FY27 revenue is on track to exceed Rs 150 crore, while the full-year target is now more than Rs 660 crore, up from Rs 600 crore. The cupid share price continues to trade around Rs 193, signaling investor appetite even as the numbers support a broader story. Cupid shares rose nearly 2% to Rs 193 in the latest session, underscoring improved visibility across domestic and international markets. The breadth of Cupid's business model, expanding global opportunities and a rising operating scale across multiple verticals, is the core narrative here.
The buoyancy drivers behind this upgrade include a diversified business model, expanding opportunities in international B2B healthcare markets, and momentum in private sector procurement and government tenders across the world. A key milestone is the commencement of a long-term supply agreement with Partnership for Supply Chain Management PFSCM, Netherlands, which strengthens Cupid's position in global healthcare procurement and adds visibility to the procurement pipeline.
The company's order visibility remains robust across private markets, institutional business, and international tenders spanning multiple geographies, providing a sounding board for sustainable revenue growth. Growth areas include continued expansion in male condoms MC and female condoms FC, supported by expanded manufacturing capacity, customer additions, and a wider market reach built over the past 12 months. The IVD business is progressing; near-term growth estimates remain conservative, but there is potential to become a meaningful contributor in coming years. Tenders for IVD kits and menstrual cups across multiple states add to the longer horizon.
Aditya Kumar Halwasiya, Chairman and Managing Director, said the strong start to FY27 reflects the company's transformation over the past few years and the emergence of multiple growth engines. Cupid is witnessing strong momentum in its international B2B business, supported by expanding opportunities in private markets, institutional procurement and government tenders across the world.
The international expansion trajectory is complemented by a broadening footprint in private and government procurement across multiple geographies, which should translate into higher order visibility. This external demand synergy pairs with Cupid's internal efforts to scale manufacturing capacity and widen the distribution network, creating a multi-year growth runway rather than a single-quarter spike. Investors should watch the pace of order wins and contract signings as the primary indicators of sustained growth, while the company continues to emphasize its diversified revenue streams across MC, FC, IVD and procurement services.
For retail investors, the core takeaway remains straightforward: this is a multi-engine growth story that could extend beyond FY27. The involvement of international buyers, government procurement programs, and institutional customers strengthens the revenue visibility and reduces reliance on any single geography or vertical. A practical way to evaluate Cupid's progress is to set up a quarterly review that matches realized revenue to the updated guidance and track the expansion of its international footprint and tender pipeline. In this context, Swastika Investments' Sarthi AI stock assistant can help you interpret these dynamics with institutional-grade insights and scenario analysis.
Cupid share price momentum: Driving factors in FY27 growth
The most important drivers behind Cupid's FY27 uplift include the diversified business model across condoms MC and FC, IVD, and procurement-related services. Domestic demand remains robust, with ongoing product adoption in condom segments. International markets show momentum with B2B healthcare providers and government programs turning to Cupid for procurement advantages. The PFSCM supply agreement with the Netherlands is expected to amplify procurement scale and reliability. The multi-geography tender pipeline adds long-tail visibility, supporting sustained revenue growth beyond a single quarter.
Q1 FY27 Revenue Forecast And Its Implications
With Q1 FY27 revenue expected to top Rs 150 crore, Cupid signals that the FY27 revenue trajectory could surpass the earlier base case. Enhanced visibility across international tenders and private markets suggests faster growth as manufacturing capacity expands and the customer base broadens. This early momentum could mark an inflection point for investors following Cupid's expansion into global healthcare procurement.
FY27 Revenue Guidance Upgrade: More Than Rs 660 Crore
The revised FY27 guidance to more than Rs 660 crore represents an upgrade of at least 10% from the prior Rs 600 crore target. The increased forecast aligns with a diversified business model, an expanding global opportunity pipeline, and increasing operating scale across multiple verticals, including MC, FC, IVD and tenders. This upgrade underscores disciplined execution and a favorable demand environment across both domestic and international markets.
Global Expansion And PFSCM: A New Growth Engine
The long-term PFSCM supply agreement with Netherlands is a strategic milestone that strengthens Cupid's position in global healthcare procurement. It provides a stable procurement channel and broader access to institutional buyers and government procurement programs in multiple geographies, which should improve order visibility and revenue predictability over time.
Growth In MC, FC And IVD: Where The Revenue Might Come From
Growth in male condoms MC and female condoms FC remains a core driver of Cupid's growth story. The company has expanded manufacturing capacity and added customers, which supports higher volumes and better margins. The IVD business is progressing; near-term growth estimates remain conservative but potential exists to become a meaningful contributor in coming years. Tenders for IVD kits and menstrual cups across multiple states add to the multi-year pipeline.
Investing In Cupid: Risks, Valuation, And A Practical Approach
As with any growth play, there are risks to assess. Investors should monitor execution across manufacturing expansion, supply chain reliability, regulatory changes, and the pace of international expansion. Valuation multiples will reflect the pace and quality of execution, and investors should consider a two-to-three year horizon to capture the growth engines at work. A practical approach is to combine fundamental analysis with a watchlist that tracks quarterly performance versus the updated FY27 targets, and to avoid over-extrapolating from one quarter.
Frequently Asked Questions
What is Cupid's Q1 FY27 revenue forecast?
Q1 FY27 revenue is on track to report revenue exceeding Rs 150 crore.
What is Cupid's FY27 revenue guidance?
The FY27 revenue guidance is more than Rs 660 crore, up from Rs 600 crore.
What caused the upward revision of Cupid's revenue guidance?
A diversified business model, expanding global opportunities, and increasing operating scale across multiple verticals, including MC, FC, IVD and tenders.
What is the current cupid share price movement?
Cupid shares rose nearly 2% to Rs 193, with the cupid stock price around Rs 193 in the latest session.
What strategic partnership supports Cupid's international growth?
The long-term supply agreement with Partnership for Supply Chain Management PFSCM, Netherlands, strengthens its global healthcare procurement and order visibility.
Conclusion
Cupid's FY27 upgrade underscores a transformation across multiple growth engines, with momentum in international B2B, government tenders, and MC/FC expansion, supported by PFSCM procurement and IVD potential. Retail investors should watch for sustained revenue growth in Q1 and the trajectory toward the > Rs 660 crore FY27 target, recognizing that a diversified, capital-efficient model can produce persistent upside beyond a single quarter.
Big Budget


Popular Articles


.avif)
.avif)

.avif)


START YOUR INVESTMENT JOURNEY
Get personalized advice from our experts
- Dedicated RM Support
- Smooth and Fast Trading App
