


Bandhan Bank Results: Q1 FY26 Profit Jumps 34.9% On Lower Provisions



Key Takeaways
- Bandhan Bank results for Q1 show net profit up 34.9% YoY to Rs 502 crore.
- Net interest income rose 6% YoY to Rs 2,921 crore, with NIM at 6.2%.
- Asset quality improved: GNPA 3.15% and NNPA 0.93%.
- Provisioning declined to Rs 683 crore, enabling stable profitability.
Bandhan Bank results for the June quarter show a sharp profit expansion to Rs 502 crore, up 34.9% YoY from Rs 372 crore a year earlier, according to its regulatory filing. The bandhan bank results reflect cost discipline and improved asset quality. Net interest income (NII) rose 6% YoY to Rs 2,921 crore, while net interest margin (NIM) remained at 6.2% on a sequential basis, underscoring stable core profitability amid tightening credit conditions. Asset quality also improved as GNPA declined to 3.15% from 3.27% in the March quarter, and NNPA eased to 0.93% from 0.97%.
Bandhan Bank Results: Q1 FY26 Profit Jumps 34.9% On Lower Provisions
According to the bank's regulatory filing, the 34.9% YoY rise in profit was driven by lower credit costs. The bank set aside Rs 683 crore in the quarter, significantly lower than Rs 1,147 crore in the year-ago period, though broadly unchanged from Rs 677 crore in the preceding quarter.
| Metric | Value | Comment |
|---|---|---|
| Net Profit (YoY) | Rs 502 crore | Up 34.9% YoY |
| NII | Rs 2,921 crore | Up 6% YoY |
| NIM | 6.2% | Unchanged sequentially |
| GNPA | 3.15% | Down from 3.27% |
| NNPA | 0.93% | Down from 0.97% |
| Provisions | Rs 683 crore | Lower vs Rs 1,147 crore YoY; Rs 677 crore prior quarter |
| Interim CFO | Vinay Jain | Effective Sept 26 |
Analysts note that Bandhan Bank's earnings trajectory remains sensitive to credit costs, even as core profitability holds steady. The improved asset quality reduces the risk of future credit losses and supports sustainable earnings in the near term. Investors should monitor how loan growth, funding costs, and recoveries evolve in the coming quarters to gauge the durability of these gains.
For deeper stock insights, you can explore Swastika's Sarthi AI stock assistant, which offers institutional-grade research on stocks and indices to retail investors.
Frequently Asked Questions
What was Bandhan Bank's standalone net profit in Q1?
Bandhan Bank's standalone net profit rose to Rs 502 crore in the June quarter, up 34.9% from Rs 372 crore a year earlier, per its regulatory filing.
What were Bandhan Bank's net interest income and net interest margin in Q1?
Net interest income stood at Rs 2,921 crore, up 6% YoY, with net interest margin remaining at 6.2% on a sequential basis.
How did Bandhan Bank's asset quality change in Q1?
GNPA eased to 3.15% from 3.27% in the March quarter, and NNPA eased to 0.93% from 0.97%.
What was the provisioning level in Q1, and how does it compare to prior periods?
Provisioning was Rs 683 crore in the quarter, significantly lower than Rs 1,147 crore in the year-ago period and broadly in line with Rs 677 crore in the preceding quarter.
Who was appointed interim CFO at Bandhan Bank?
Vinay Jain was appointed as interim Chief Financial Officer, effective September 26.
Conclusion
Bandhan Bank results point to a healthier credit cost structure and improving asset quality, translating into a steadier earnings base for the quarter. For retail investors, the key takeaway is to watch the trajectory of provisioning and NII in upcoming quarters, as these drivers will determine whether Bandhan Bank can sustain its earnings momentum amid macro headwinds.
Next-step mental model: focus on the quality of growth versus the price of growth. Track NII growth, NIM stability, and any shifts in GNPA/NNPA trends in subsequent quarters, and consider using Swastika's Sarthi AI stock assistant to compare Bandhan Bank with peers and indices as new data arrives.
Open your trading and demat account here
Reference :
1 : Ndtvprofit
Latest Articles
Usdinr Rate Outlook: Rupee Edges Higher Amid Oil Pressure


Key Takeaways
- The rupee opened at 96.41 per USD, up 4 paise from the previous close.
- Crude prices stay elevated, keeping the currency near its record low around 96.97.
- RBI intervention and sustained dollar demand influence levels around 96.50 as Finrex projects a closer range.
- Exporters are advised to sell dollars near intraday highs while importers hedge on temporary dips.
In the current usdinr rate snapshot, the rupee opened at 96.41 per U.S. dollar on July 21, gaining 4 paise from the previous close of 96.45. The move marks a tentative step back from the broader struggle near a record low as elevated crude oil and durable dollar demand continue to cast a shadow over the currency. The Finrex projection places the rupee around the 96.50 level, indicating it could stay close to the record low of 96.97.
RBI intervention remains in focus as authorities reportedly sell dollars at higher levels to curb volatility and support FCNR deposit inflows. The Finrex notes specifically point to sustained dollar purchases by oil marketing companies as a pressure point, even as the central bank seeks to smoothen moves with its own dollar sales. Exporters, in this environment, are advised to consider selling dollars near intraday highs, while importers may use temporary declines to hedge near-term payments. The interplay of policy and energy costs creates a tough but navigable landscape for usdinr rate traders.
The currency pairs of the region show mixed behaviour: the Malaysian ringgit rose 0.108%, the Chinese renminbi 0.087%, the Singapore dollar 0.023%, and the Philippine peso 0.006% higher, while the Japanese yen remained flat. The South Korean won fell 0.264%, the Indonesian rupiah declined 0.15%, the Taiwan dollar slipped 0.081%, and the Thai baht fell 0.056%. The dollar index traded near 100.96, with USD/JPY at 162.50, EUR near 1.1415 and GBP around 1.3434. Such cross-currency shifts feed into the local rupee story as risk sentiment and energy-linked flows fluctuate.
Beyond the numbers, the macro narrative centers on energy costs and policy signals. The X-factor in the global backdrop is Britain’s new Prime Minister Andy Burnham, who reaffirmed commitment to existing fiscal rules, a development that adds a political dimension to global risk appetite. In this environment, the rupee volatility remains a gating factor for traders–any sudden energy price development or policy cue could widen the range, testing the ability of RBI policy to maintain smooth liquidity. RBI intervention and policy cues will likely determine whether the rupee holds near 96.50 or tests the record low.
For traders tracking the rupee to dollar rate today live, the near-term messaging is clear: expect a band around the 96.50 area with 96.97 as the key high-water mark on pullbacks and energy spikes. The day’s direction will hinge on crude oil moves and the RBI's actions to manage volatility and FCNR flows. Keep eyes on the rbi monetary policy repo rate and any hints from central-bank communications that could shift expectations. For exporters, selling near intraday highs may offer a favorable risk-reward; for importers, temporary declines might provide hedging opportunities for imminent payments.
If you want institutional-grade stock and index research to complement your macro view, consider Swastika's Sarthi AI stock assistant.
Frequently Asked Questions
What was the rupee's opening level against the U.S. dollar on July 21, and what was the day’s change?
The rupee opened at 96.41 per U.S. dollar, up 4 paise from the previous close of 96.45.
What does Finrex project for the usdinr rate and how close is it to the record low?
Finrex projects the rupee to trade around the 96.50 level, staying near the record low of 96.97.
What actions is the RBI taking to manage rupee volatility and FCNR inflows?
The RBI is reportedly selling dollars at higher levels to reduce volatility and support FCNR deposit inflows, with policy cues and liquidity management influencing the rbi rupee rate context.
What are the current hedging recommendations for exporters and importers?
Exporters are advised to sell dollars near intraday highs, while importers may use temporary declines to hedge near-term payments.
What macro cues were noted alongside the rupee move, including the dollar index and major currency levels?
The dollar index stood at 100.96, USD/JPY at 162.50, EUR near 1.1415, and GBP around 1.3434, with mixed regional currency movements.
Conclusion
This article was published without a generated conclusion. Please review and add a conclusion before publishing.
SBI Funds Management Private Limited Share Price And IPO Listing: A Retail Investor's Guide
Key Takeaways
- 613.30 NSE listing price, 6.85% premium to ₹574 issue price; BSE listing price ₹610; intraday high ₹623.85.
- OFS: 17,09,56,631 equity shares by promoters; no fresh funds for SBI Funds Management; listing benefits only.
- Public issue subscription: 41.66x overall; QIB 140.11x; NII 22.51x; Retail 3.60x; Anchor investors ₹2,662.96 crore; Pre-IPO ₹1,880 crore.
- Valuation around ₹1.16–₹1.20 lakh crore; P/E ~38x; FY26 revenue ₹4,976.11 crore; net profit ₹3,067.38 crore; Growth driven by market leadership and diversified AUM.
On listing day, sbi funds management private limited share price saw a robust start on the public board. The NSE listing price was ₹613.30, with a premium of 6.85% to the ₹574 issue price. On BSE, the listing price stood at ₹610, and the intraday high reached ₹623.85. The IPO size totaled ₹9,795.32 crore, and the OFS comprised 17,09,56,631 equity shares by promoters State Bank of India and Amundi India Holding, with no fresh issue component. Eligible employees received a discount of ₹54 per share. Anchor investors raised ₹2,662.96 crore on July 13, 2026, and there was a pre-IPO placement of approximately ₹1,880 crore ahead of the offer.
The promoters are SBI and Amundi India Holding, and the public issue was subscribed 41.66 times overall, with category-wise subscriptions of QIB at 140.11x, NII at 22.51x, and Retail at 3.60x. The upper price band valued SBI Funds Management at roughly ₹1.16–₹1.20 lakh crore, translating to a P/E of about 38x. SBI Funds Management posted FY26 revenue of ₹4,976.11 crore and net profit of ₹3,067.38 crore, up from FY25 figures of ₹4,236.15 crore revenue and ₹2,540.15 crore net profit. Incorporated in 1992, it is India's oldest asset management company and has served as the investment manager to SBI Mutual Fund since 1993.
Growth drivers include Market Leadership–India's largest AMC by mutual fund QAAUM of ₹12.51 lakh crore with a 15.3% market share as of March 31, 2026–and a Diversified AUM base totaling ₹29.46 lakh crore across PMS, AIFs, advisory mandates, and offshore assets. Passive & PMS dominance stands at 27.9% in passive funds/ETFs and 39.7% in PMS, reinforced by a broad Distribution muscle of 132,000+ mutual fund distributors, 95 banking partners, and digital platforms like InvesTap and SBI YONO, serving about 18 million unique investors. A global expertise edge comes from a joint venture with Amundi, providing access to an international investor network and offshore mandates.
However, the business is not risk-free. Market-linked revenue and the potential for yield compression under intense pricing pressure, as well as evolving SEBI norms, pose challenges to profitability. The OFS structure means the listing did not bring fresh capital for growth investments, and all proceeds from the OFS accrue to selling shareholders, namely SBI and Amundi India Holding, with SBI Funds Management itself not receiving new funds from the offering. The listing debut occurred in green, but the move was modest relative to some grey-market expectations around 17%.
Retail investors should weigh the strength of this market leader against the cyclicality of asset-management fees. A long-term view anchored in AUM growth, product diversification (ETFs, PMS, and offshore mandates), and global partnerships may help navigate an uncertain rate environment and competitive pricing. For deeper stock-level insights and to tailor your research strategy, consider Swastika's Sarthi AI stock assistant.
SBI Funds Management Private Limited Share Price: Listing Day Metrics And Implications
Here is a concise snapshot of the key numbers that defined the listing day narrative. The NSE listed price was ₹613.30, with the issue price of ₹574 delivering a 6.85% premium. The BSE listing price was ₹610.00, signaling a similar valuation discipline across exchanges. The intraday high of ₹623.85 indicated robust intraday momentum even as the initial post-listing move settled. The overall IPO size stood at ₹9,795.32 crore, and the Offering For Sale encompassed 17,09,56,631 equity shares by promoters. The employee discount of ₹54 per share amplified retail interest, while anchor investors helped anchor early demand with ₹2,662.96 crore raised on July 13, 2026. Public subscription was exceptionally strong at 41.66x overall; category breakdown showed QIB at 140.11x, NII at 22.51x, and Retail at 3.60x. The upper band valuation landed near ₹1.16–₹1.20 lakh crore, implying a P/E multiple around 38x. Revenue for FY26 reached ₹4,976.11 crore with net profit of ₹3,067.38 crore, marking a significant uptick from FY25 and cementing SBI Funds Management’s position as a leading asset manager in India.
| Metric | Value |
|---|---|
| NSE Listing Price | ₹613.30 |
| Premium vs Issue Price | 6.85% |
| Issue Price | ₹574.00 |
| BSE Listing Price | ₹610.00 |
| Intraday High | ₹623.85 |
| IPO Size | ₹9,795.32 crore |
| OFS Shares | 17,09,56,631 |
| Employee Discount | ₹54 per share |
| Anchor Investor Proceeds | ₹2,662.96 crore |
| Pre-IPO Placement | ₹1,880 crore |
| Subscription (Overall) | 41.66x |
| QIB | 140.11x |
| NII | 22.51x |
| Retail | 3.60x |
| Upper Band Valuation | ₹1.16–₹1.20 lakh crore |
| P/E | ≈38x |
| FY26 Revenue | ₹4,976.11 crore |
| FY26 Net Profit | ₹3,067.38 crore |
Promoters State Bank of India and Amundi India Holding led the OFS, with no fresh capital being raised by SBI Funds Management itself. The presentation of these numbers underscores the scale of SBI Funds Management’s assets under management (AUM) and the market’s appetite for a seasoned asset manager with a deep distribution network and a global tie-up with Amundi.
As investors digest these numbers, a few questions remain: Will the stock’s valuation hold in a volatile market? How will rising competition in passive funds and pricing pressure on management fees affect long-term revenue yields? These are the kinds of questions that the Sarthi AI stock assistant can help address by combining fundamental data with market sentiment across multiple time horizons.
SBI Funds Management IPO: Size, Subscriptions, And Use Of Proceeds
The SBI Funds Management IPO was an Offer For Sale, with no fresh issue capital for growth. The placement and anchor strategy helped anchor demand, with a notable pre-IPO placement of ₹1,880 crore and anchor investors raising ₹2,662.96 crore. The OFS shares were allocated by promoters, namely the State Bank of India and Amundi India Holding. The overall subscription rate of 41.66x reflects strong investor interest, particularly from domestic institutions, while the retail portion also substantiated robust demand at 3.60x. The size of ₹9,795.32 crore is a significant milestone for a company that manages the nation’s largest mutual fund and has a diversified asset base spanning PMS, AIFs, advisory mandates, and offshore assets.
For retail investors, the important takeaway is that there were no fresh funds created by SBI Funds Management for growth through this offering. Instead, the listing achieved benefits such as enhanced brand visibility and partial monetisation for promoters. This is a dynamic reminder that not all listings are capital-raising exercises; some are strategic moves to unlock value for current shareholders and to broaden the investor base. The OFS structure means that the proceeds did not go into a treasury for expansion, but the company’s public market presence helps support future credential-building and distribution expansion across India.
Growth drivers extend beyond the IPO mechanics. SBI Funds Management’s leadership position rests on its QAAUM of ₹12.51 lakh crore in mutual funds as of March 31, 2026, with a 15.3% market share. The diversified QAAUM of ₹29.46 lakh crore across PMS, AIFs, advisory mandates and offshore assets demonstrates a broad-based client base and multiple revenue streams. The firm commands a 27.9% share in passive funds/ETFs and a 39.7% share in PMS, underscoring the modal shift toward passive products and managed portfolios. Distribution strength–132,000+ mutual fund distributors, 95 banking partners, and digital platforms like InvesTap and SBI YONO–helps reach roughly 18 million unique investors. A joint venture with Amundi extends the global footprint and offshore mandates across Japan, Australia, Korea, Europe and the Middle East, broadening client access and product mandates.
Nevertheless, regulatory risk remains a factor as TER norms and disclosure standards evolve in the Indian market. Additionally, yield compression risk looms as competition intensifies in the passive-fund space, potentially compressing management fees. An OFS-only structure also means the growth capital was not raised through the public route, which could influence the pace of product expansion or new investment strategies. For readers seeking deeper, stock-specific research into SBI Funds Management and similar stocks, Swastika offers a robust AI-driven analysis through Swastika's Sarthi AI stock assistant.
SBI Funds Management Listing Day Performance: Price Discovery, Premium, And First Day Trade
The listing performance of SBI Funds Management was positive but nuanced. On the NSE, the listing price was ₹613.30, reflecting a premium to the issue price of ₹574. The listing also traded at a premium of around 6.85% to the issue price. The BSE listing price stood at ₹610, marking a strong cross-exchange price discovery. The intraday high of ₹623.85 signaled decently strong market participation. This data confirms that the market welcomed a long-standing asset manager with a diversified AUM base, even as the listing did not explode with a 17% grey-market-style surge. The IPO's size, OFS structure, and anchor investment backdrop contributed to a controlled, orderly listing day that established a credible baseline for subsequent aftermarket performance.
The listing day context helps investors calibrate expectations about how SBI Funds Management will perform in the post-listing phase. With an upper-band valuation around ₹1.16–₹1.20 lakh crore and a P/E of approximately 38x, the stock reflects a premium for leadership in mutual funds and diversified asset management. Among the subscription data, the overall 41.66x rate and QIB’s 140.11x denote robust demand from institutional players, while the retail segment’s 3.60x confirms meaningful but more measured appetite from individual investors. This dynamic can influence how retail investors approach allocation–balancing the appeal of a high-quality asset manager against the reality of price discipline and market volatility.
Retail investors should watch for how the post-listing price evolves in response to quarterly updates, AUM growth, and market conditions. The company’s growth drivers are anchored in scale, distribution breadth, and product mix, including ETFs and PMS. The global Amundi link also suggests potential offshore mandates. In the near term, the stock may demonstrate volatility around macro shifts or fund flows; in the longer term, its performance will hinge on AUM growth and fee structure stability.
SBI Funds Management Revenue, AUM, And Growth Drivers For Retail Investors
The growth narrative for SBI Funds Management rests on its massive AUM footprint and diversified revenue streams. The QAAUM stands at ₹12.51 lakh crore for mutual funds, delivering leadership in market share at 15.3% as of March 31, 2026. Including PMS, AIFs, advisory mandates and offshore assets, the total QAAUM climbs to ₹29.46 lakh crore, underscoring resilience across market cycles. The company enjoys a dominant 27.9% share in passive funds and ETFs and a 39.7% share in PMS, which suggests margin resilience amid competition and pricing pressures across categories. The distribution network–132,000+ mutual fund distributors, 95 banking partners, and digital platforms InvesTap and SBI YONO–enables a broad reach to roughly 18 million unique investors, putting SBI Funds Management in a privileged position to capture rising flows into mutual funds and passive vehicles.
The growth narrative is reinforced by a global dimension through its Amundi joint venture, which provides access to international investor networks and offshore mandates across major markets. From a product perspective, continued expansion in passive funds, active strategies, and PMS mandates supports revenue diversification beyond traditional management fees. However, the flip side is the sensitivity of management-fee income to equity-market cycles and asset churn; higher market volatility can compress yields, and regulatory changes around TER and disclosure norms can influence profitability. Nevertheless, with a broad asset base and a dominant distribution footprint, SBI Funds Management remains well positioned to capture retail and institutional flows over time.
For investors seeking actionable insights on portfolio-aligned exposure to SBI Funds Management, the Sarthi AI stock assistant can help you model scenarios across different market environments. Learn more here: Swastika's Sarthi AI stock assistant.
Frequently Asked Questions
What was the NSE listing price for SBI Funds Management Private Limited Share Price on the IPO day?
The NSE listing price was ₹613.30. The issue price was ₹574, implying a premium of 6.85%.
Who are the promoters behind SBI Funds Management IPO and what was the OFS structure?
Promoters State Bank of India and Amundi India Holding led the Offer For Sale. The OFS comprised 17,09,56,631 equity shares with no fresh issue component.
What was the overall subscription level for SBI Funds Management IPO and the category-wise breakdown?
Overall subscription was 41.66x. QIB subscriptions were 140.11x, NII 22.51x, and Retail 3.60x.
What is the valuation and key financials of SBI Funds Management after FY26?
Upper band valuation was approximately ₹1.16–₹1.20 lakh crore with a P/E of about 38x. FY26 revenue was ₹4,976.11 crore and net profit ₹3,067.38 crore, up from FY25 revenue ₹4,236.15 crore and net profit ₹2,540.15 crore.
What growth drivers and risks should a retail investor consider with SBI Funds Management?
Growth drivers include India's largest mutual fund QAAUM, diversified QAAUM including PMS and offshore assets, a strong distribution network, and a joint venture with Amundi. Risks include market-linked revenue, yield compression due to competition, regulatory changes, and an OFS structure that did not provide fresh capital for growth.
Conclusion
This article was published without a generated conclusion. Please review and add a conclusion before publishing.

Ioc Share Price Insights: Fuel Price Stability Across Indian Cities
Key Takeaways
- Petrol and diesel prices remained unchanged across major Indian cities on July 21, 2026.
- Brent crude price slipped below $89 per barrel after a sharp two-session rise.
- The last major price revision was on May 25, 2026, with oil marketing companies keeping rates steady.
- Retail investors should monitor iocl stock price, bpcl share price, and hpcl stock price alongside crude and policy moves.
Can a day when petrol and diesel rates stay flat across India's major cities hide a bigger signal for investors? On July 21, 2026, retail investors face a puzzle: does a stable pump price regime obscure what’s happening in oil equities such as the ioc share price? The answer lies at the intersection of crude dynamics, policy decisions, and stock-market sentiment, and it is essential for anyone building a portfolio around energy and infrastructure exposures.
As crude markets moved–Brent was trading below $89 per barrel after a near 6% rise in the previous two sessions–factors beyond local fuel pricing began to drive risk and opportunity in India’s energy sector. Here’s a data-driven look at today’s price snapshot, what it means for iocl stock price, and how retail investors can frame their next steps.
Ioc Share Price Trends And The Petrol Price Landscape In India
Today’s petrol and diesel prices across major Indian cities remained unchanged from the May 25, 2026 revision. The data shows no movement in pump prices across Delhi, Kolkata, Mumbai, Chennai, and other major hubs, even as crude moves and geopolitical developments unfold. This stability in pump pricing does not imply a lack of activity in energy markets; instead, it signals a separation between consumer-facing rates and the dynamics that drive oil equities such as the iocl stock price, bpcl share price, and hpcl stock price.
| City | Petrol (₹) | Diesel (₹) |
|---|---|---|
| New Delhi | ₹102.12 | ₹95.20 |
| Kolkata | ₹113.51 | ₹99.82 |
| Mumbai | ₹111.21 | ₹97.83 |
| Chennai | ₹107.76 | ₹99.55 |
| Gurugram | ₹102.97 | ₹95.64 |
| Noida | ₹101.96 | ₹95.44 |
| Bengaluru | ₹110.82 | ₹98.77 |
| Bhubaneswar | ₹110.49 | ₹102.15 |
| Chandigarh | ₹101.54 | ₹89.47 |
| Hyderabad | ₹115.69 | ₹103.82 |
| Jaipur | ₹112.66 | ₹97.78 |
| Lucknow | ₹101.86 | ₹95.36 |
| Patna | ₹113.53 | ₹99.54 |
| Thiruvananthapuram | ₹115.49 | ₹104.40 |
The table above shows a broad alignment with the May 25 price revision across most cities. The current stability in pump prices, despite crude fluctuations, is a backdrop for investors who track energy equities. For those tracking iocl stock price or bpcl share price, the price action in these names often reflects macro forces and policy signals rather than the daily pump price alone.
Looking beyond numbers, every investor should consider the macro- and micro-level drivers that influence oil stocks. The government’s stance on 20% ethanol blending and the open-ended procurement framework under the price support system help maintain supply and price discipline for consumers, while also shaping the valuation framework for OMCs as listed entities.
For deeper stock-level insights on energy sector opportunities, you can explore Swastika's Sarthi AI stock assistant: Swastika's Sarthi AI stock assistant.
Petrol And Diesel Rate Dynamics: The July 21 Snapshot
The July 21 data confirms that retail pump prices have remained steady since the last major revision on May 25, 2026. Across the 14 cities tracked, petrol and diesel prices did not change, underscoring a price-stability regime from the state-run oil marketing companies. The stability is particularly relevant for household budgets and for investors who use price anchors to calibrate risk in energy equities. The city-wise numbers reiterate the overall picture: a broad plateau rather than a wave of price movement.
This environment can influence trading patterns in energy stocks, particularly IOC, BPCL, and HPCL, as investors adjust expectations around crude, policy, and refinery margins. While pump rates stay put, the stock prices of the oil marketing companies can still experience volatility driven by external factors such as crude price moves, currency trends, and regulatory updates.
Brent Crude Movements And The Indian Fuel Price Path
The global crude backdrop continues to shape the trajectory of Indian fuel prices and stock performance. Brent crude traded below $89 per barrel on July 21, after an earlier ~6% rise over the preceding two sessions. This pattern creates a nuanced environment: even when domestic pump prices hold steady, Brent's movement can ripple through energy equities as traders price in future supply expectations, refinery utilization, and demand signals from major economies. For investors, the key question becomes: how will the ioc stock price and other OMCs respond to shifts in Brent, rupee-dollar dynamics, and policy cues in the months ahead?
Crude is not the only driver; geopolitical tensions and potential ceasefire proposals add an extra layer of risk premium that can flow into energy names. As a retail investor, monitoring the interplay between Brent movements and the price behavior of state-run oil majors can provide a more resilient approach to stock selection and risk management.
Policy Backdrop And Ethanol Blending And Procurement Practices
Beyond the pump, policy decisions are a meaningful driver of energy equities. The centre dismissed concerns that the 20% ethanol blending target could affect food security, while a Rajya Sabha written reply explained that the government follows an open-ended procurement system at the Minimum Support Price, with priority procurement for the Public Distribution System, the National Food Security Act, other welfare schemes, and prescribed buffer stocks. For investors, this policy landscape translates into a relatively predictable supply chain for ethanol-blended fuels and a measured risk environment for the major oil marketing companies, which often move in step with policy signals rather than the daily volatility of crude alone.
As the regulatory framework evolves, the stock market often prices in long-run implications for the energy and agri-fuel mix that underpins the broader economy. Watching updates in policy and procurement practices can help refine entry points and risk controls for iocl stock price, bpcl share price, or hpcl stock price within a diversified portfolio.
Investment Takeaways: A Practical Mental Model For Retail Investors
When price data show a flat pump, the prudent approach is to focus on how energy equities are positioned to absorb macro shifts. A practical mental model for retail investors is to treat crude, policy, and pump price as separate, but interlinked, layers. The crude backdrop and government policy form the macro anchors; the stock prices of IOC, BPCL, and HPCL–along with their relative valuations, dividends, and refinery margins–are the micro indicators that reveal how well the energy sector translates macro signals into price performance.
Frequently Asked Questions
What were petrol and diesel prices on July 21, 2026 across major Indian cities?
Prices remained unchanged from the last revision on May 25, 2026. New Delhi petrol ₹102.12; diesel ₹95.20; Kolkata petrol ₹113.51; diesel ₹99.82; Mumbai petrol ₹111.21; diesel ₹97.83; Chennai petrol ₹107.76; diesel ₹99.55; Gurugram petrol ₹102.97; diesel ₹95.64; Noida petrol ₹101.96; diesel ₹95.44; Bengaluru petrol ₹110.82; diesel ₹98.77; Bhubaneswar petrol ₹110.49; diesel ₹102.15; Chandigarh petrol ₹101.54; diesel ₹89.47; Hyderabad petrol ₹115.69; diesel ₹103.82; Jaipur petrol ₹112.66; diesel ₹97.78; Lucknow petrol ₹101.86; diesel ₹95.36; Patna petrol ₹113.53; diesel ₹99.54; Thiruvananthapuram petrol ₹115.49; diesel ₹104.40.
When was the last major price revision before July 21, 2026?
The last major revision occurred on May 25, 2026.
What was the Brent crude price situation on July 21, 2026?
Brent crude price was below $89 per barrel, and it fell 0.4% on July 21 after a sharp rise in the prior two sessions.
What policy notes did the article mention regarding ethanol and procurement?
The Centre dismissed concerns that the 20% ethanol blending target could affect food security. A Rajya Sabha written reply noted an open-ended procurement system at the Minimum Support Price, with priority procurement for PDS, NFSA, and buffer stocks.
Why should investors watch IOC share price, BPCL share price, and HPCL share price in relation to fuel prices?
Even when pump prices are stable, stock prices of oil marketing companies can reflect macro and policy signals, refinery margins, and crude price expectations, helping investors gauge energy-sector health and valuation.
Conclusion
The takeaway for the retail investor is clear: when pump prices are stable, the real information is in how energy equities respond to broader crude and policy dynamics. The iocl stock price, bpcl stock price, and hpcl stock price can reflect sentiment about the energy sector, refinery margins, and future fuel demand, even as petrol and diesel rates stay unchanged in major cities. Use this framework: monitor macro signals (Brent, currency moves, geopolitical risks) and compare them with micro signals from OMCs’ stock prices to identify points of entry or risk mitigation.

Google News Not Loading: A Retail Investor's Guide To Staying Informed
Key Takeaways
- google news not loading can derail your morning market briefing, so have quick fixes ready.
- Use google news rss feed and other trusted sources to refresh essential updates.
- If it persists, check your network, blockers, and regional access while you consult alternate sources.
- Swastika's Sarthi AI stock assistant can provide timely insights when feeds are down.
Imagine waking up to a market that moves while you wait for your daily briefing. google news not loading becomes a real risk for traders who rely on real-time updates to set entry points and risk controls. For retail investors across India, this problem can cascade into delays, misread signals, and missed opportunities. In this guide, we unpack why this happens, how to troubleshoot quickly, and what a smart news plan looks like when feeds stall. We will also show you how to stay informed through Swastika's Sarthi AI stock assistant.
Part of being a patient, data-driven investor in a fast-moving market is knowing you have robust fallbacks. If google news not loading, you should not rely on a single feed. Instead, assemble a short list of trusted sources and a quick troubleshooting routine so you can act on fresh signals rather than delayed headlines. For deeper, research-driven insights, consult Swastika's Sarthi AI stock assistant.
Google News Not Loading And Its Impact On Retail Investors In India
Real-time news shapes how retail investors react to market moves in India. When google news not loading prevents you from seeing current headlines and explanations behind price moves, you lose crucial context that can turn a 1% intraday swing into a meaningful change in risk posture. That gap can lead to delayed exits, missed opportunities, or overreactions to stale information. A healthy news routine for an Indian investor includes multiple sources–official exchange alerts, company press releases, and independent research–so you are not left staring at a spinning loader while prices move.
What Common Causes Trigger Google News Not Loading On Mobile And Desktop Devices
Several recurring causes explain why google news not loading can appear, and they are often fixable with a quick checklist. First, check if you are facing a google news redirect that lands you on an intermediary page instead of the original article. This can happen due to temporary routing issues or ad-serving blockers. You may also see google news issues arising from server side outages at the source, or from regional blocks that limit access. Finally, client-side problems such as browser cache, outdated apps, or aggressive privacy extensions can break the feed. If you encounter these, attempt to access a google news rss feed or google news rss link in a new tab to verify whether the problem is local or global.
Step By Step Troubleshooting To Fix Google News Not Loading
Start with the simplest checks and escalate as needed. Step 1: Verify your internet connection and try a different network (mobile data vs Wi-Fi) to see if the problem persists. Step 2: Clear cache and cookies in your browser or update the Google News app to the latest version. Step 3: Disable ad blockers or privacy extensions that could be filtering content from news.google.com or your preferred feeds. Step 4: If you rely on the google news rss feed, try opening google news rss link in a separate tab or using an alternative feed aggregator to confirm whether the issue is feed-specific. Step 5: Check if your device language or regional settings influence the feed's availability. Step 6: Reboot your device and reload the page. If the problem persists, switch to secondary sources temporarily and use Swastika's Sarthi AI stock assistant to surface timely signals while the main feed recovers.
Alternative News Sources And How To Verify Market Data When Google News Not Loading
Even when the primary feed stalls, you can keep a reliable view of market momentum by relying on official channels: stock exchange announcements, company press releases, and credible financial portals known for real-time updates. You can also leverage the google news rss feed's alternatives–industry newsletters, regional business dailies, and broker-provided dashboards–to cross-check headlines and ensure consistency. When google news not loading, a corroboration approach matters: compare price moves with what the company says, and watch for a change in volumes as confirmation of a fresh signal. This multi-source approach protects you from acting on misleading or out-of-context headlines.
Frequently Asked Questions
What should I do when Google News Not Loading on my device?
Start with a quick diagnostic: verify your internet connection, try a different network, and clear cache and cookies. If the problem persists, check for ad blockers or privacy extensions that might be filtering content, and try the google news rss feed in a separate tab to see if the issue is feed-specific.
How can I access timely market news if Google News Not Loading?
Use alternative sources such as stock exchange announcements, official press releases, broker dashboards, and credible financial portals. You can also try google news rss and google news rss link to verify whether the feed is accessible from another route.
What are common causes behind Google News Not Loading?
Common causes include network issues, browser cache problems, outdated apps, ad blockers or privacy tools, and occasional google news redirect or google news issues related to server downtime or regional access limitations.
How can Swastika Investmart help when Google News Not Loading?
Swastika Investmart offers research and a stock assistant, including the Swastika's Sarthi AI stock assistant, to surface timely signals and centralized updates even when feeds stall. You can access Sarthi here:Swastika's Sarthi AI stock assistant.
What is Google News RSS and Google News RSS Feed?
Google News RSS and google news rss feed are alternative ways to pull headline updates through RSS aggregators. If Google News not loading, you can try the google news rss feed and compare results with other sources to stay informed.
Conclusion
This article was published without a generated conclusion. Please review and add a conclusion before publishing.
Open your trading and demat account here
Reference :
1 : Google
Arvind Fashions Share Price: Q1 FY27 Revenue Growth And Margin Trends
Key Takeaways
- Arvind Fashions Q1 FY27 revenue rose 15.5% to Rs 1,279 crore, while net profit fell to Rs 9.6 crore.
- EBITDA jumped 19.9% to Rs 160 crore, with margin improving to 12.5% from 12%.
- Last year's Q1 numbers were Rs 1,107 crore revenue and Rs 12.6 crore net profit; EBITDA Rs 133 crore and 12% margin.
- The topline growth and margin improvements contrast with weaker quarterly profit, affecting the near-term Arvind Fashions share price outlook.
Arvind Fashions' Q1 FY27 numbers throw a wrench into the usual growth narrative: topline momentum comes with profit compression. For arvind fashions share price watchers, the quarter ended June 30, 2026 reveals a nuanced story: revenue rising to Rs 1,279 crore, while net profit slips to Rs 9.6 crore year-on-year.
Arvind Fashions Share Price Q1 FY27 Revenue Growth And Margin Trends
Arvind Fashions posted revenue of Rs 1,279 crore in Q1 FY27, up 15.5% from Rs 1,107 crore in the year-ago period, signaling topline momentum. EBITDA rose to Rs 160 crore, up 19.9% from Rs 133 crore in Q1 FY26, with EBITDA margin improving to 12.5% from 12% in the same quarter last year.
Q1 FY27 Revenue Growth: Rs 1,279 Crore Vs Rs 1,107 Crore Last Year
The 15.5% revenue growth to Rs 1,279 crore compares with Rs 1,107 crore last year for the quarter ended June 30. This shows the company carried forward its revenue momentum into Q1 FY27, a sign of ongoing demand across its product mix and distribution network.
Net Profit Decline In Q1 FY27: Rs 9.6 Crore Versus Rs 12.6 Crore A Year Ago
Net profit for Q1 FY27 was Rs 9.6 crore, down 23.8% year-on-year from Rs 12.6 crore. The drop occurs even as revenue grows, implying cost pressures or mix effects on profitability during the quarter.
EBITDA And Margin Trends In Q1 FY27
EBITDA is Rs 160 crore, up 19.9% from Rs 133 crore in Q1 FY26, with EBITDA margin at 12.5% vs 12% in the prior-year quarter. This indicates operating leverage is improving, even as net profit declines, perhaps due to higher depreciation or interest costs, or extraordinary items not captured in EBITDA.
What This Means For Investors And The Arvind Fashions Share Price Outlook
Investors should note that topline momentum is intact, but profitability in the near term has faced pressure. The better EBITDA margin suggests some operating efficiency gains, yet the overall net profit decline will influence the immediate stock price reaction to this quarterly print. For retail investors evaluating arvind fashions share price, the key question is whether subsequent quarters convert revenue strength into stronger earnings growth.
To dig deeper into stock-specific insights and scenario planning for Arvind Fashions and other fashion peers, explore Swastika's Sarthi AI stock assistant.
Arvind Fashions Share Price: A Quick Numbers Snapshot
| Metric | Q1 FY27 | Q1 FY26 |
|---|---|---|
| Revenue | Rs 1,279 crore | Rs 1,107 crore |
| Net Profit | Rs 9.6 crore | Rs 12.6 crore |
| EBITDA | Rs 160 crore | Rs 133 crore |
| EBITDA Margin | 12.5% | 12% |
Frequently Asked Questions
What was Arvind Fashions Q1 FY27 revenue?
Rs 1,279 crore, up 15.5% YoY from Rs 1,107 crore.
What was Arvind Fashions Q1 FY27 net profit?
Rs 9.6 crore, down 23.8% year-on-year from Rs 12.6 crore.
What were the EBITDA and EBITDA margin in Q1 FY27?
EBITDA was Rs 160 crore, up 19.9% from Rs 133 crore; EBITDA margin was 12.5% versus 12% in the prior-year quarter.
When were the Q1 FY27 results announced?
The results were announced on July 21, 2026.
What do these numbers imply for the Arvind Fashions share price outlook?
Revenue grew 15.5% to Rs 1,279 crore, while net profit declined to Rs 9.6 crore; the stock's near-term reaction will hinge on how earnings quality sustains and margins trend.
Conclusion
Arvind Fashions’ Q1 FY27 performance underscores a nuanced reality for Indian fashion retailers: topline expansion can coexist with near-term profit pressure, even as operating leverage improves. Retail investors tracking arvind fashions share price should monitor how revenue growth translates into sustainable earnings, cost discipline, and continued margin momentum in the quarters ahead.
Next steps: assess margin drivers, brand performance, and cost structure as you form your investment thesis. Use a mental model that weighs topline momentum against earnings quality, and consider how a durable margin trajectory could lift the stock over the medium term.
Open your trading and demat account here
Reference :
1 : Ndtvprofit
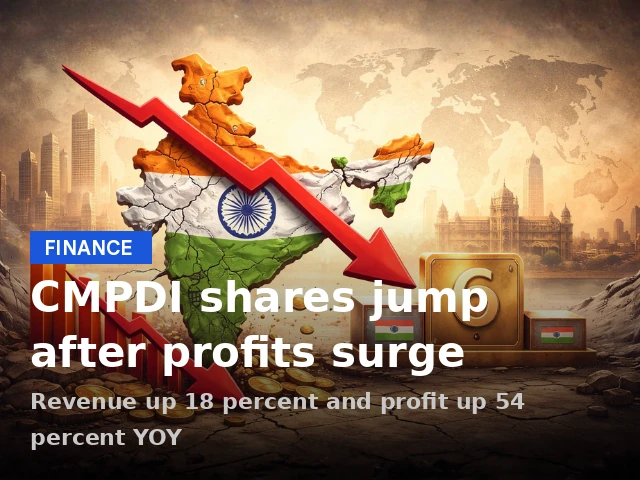
Cmpdi Dividend Momentum After Q1FY27 Profit Surge: A Retail Investor's Guide
Key Takeaways
- CMPDI's Q1FY27 numbers show revenue up 18% YoY to Rs 481.4 crore and net profit up 54% to Rs 116.3 crore.
- The Board approved an interim dividend of Rs 1.05 per share with record date on July 24, 2026 and payout by August 19, 2026.
- CMPDI stock climbed 6.90% to Rs 270.96, contributing to a roughly 45% gain over the last three months.
- Valuation multiples show P/E 28.55, P/S 4.75, P/B 7.97, with a 52-week range of Rs 150.10–Rs 283.69.
The cmpdi dividend story for Q1FY27 isn't just about numbers–it's a signal that a rising revenue trajectory, robust profitability, and an explicit payout policy could shift how retail investors evaluate CMPDI. As a subsidiary of Coal India, CMPDI's first quarter results reflect both operational leverage and the potential for shareholder returns. Beyond the numbers, the key question for investors is: will this momentum translate into sustainable payouts and a higher stock multiple?
CMPDI Dividend And Q1FY27 Profit Surprise: What It Means For Retail Investors
In Q1 FY27, CMPDI's revenue from operations stood at Rs 481.4 crore, up from Rs 409.3 crore in the same quarter last year, an 18% YoY gain.
Net profit rose to Rs 116.3 crore, up 54% YoY from Rs 75.5 crore.
Other income rose to Rs 22.7 crore from Rs 14.06 crore, a 62% YoY rise, while EBITDA climbed to Rs 168 crore from Rs 103.85 crore, up about 61.87% YoY.
These numbers indicate stronger cash generation that underpins the cmpdi dividend policy and can support a higher payout if the earnings trajectory sustains.
Cmpdi Quarterly Results: Revenue Rises 18% YoY And Profit Improves
The cmpdi quarterly results reflect a robust quarter where revenue growth outpaced the broader cycle and profitability expanded across the board. The 18% YoY revenue uplift and a 54% YoY rise in net profit highlight improving operating leverage and cost control.
The improvement in EBITDA, from Rs 103.85 crore to Rs 168 crore, mirrors stronger earnings before interest, taxes, depreciation, and amortisation, supporting a more robust dividend outlook.
| Metric | Q1 FY27 | Q1 FY26 | YoY Change |
|---|---|---|---|
| Revenue From Operations | Rs 481.4 crore | Rs 409.3 crore | +18% |
| Net Profit | Rs 116.3 crore | Rs 75.5 crore | +54% |
| Other Income | Rs 22.7 crore | Rs 14.06 crore | +62% |
| EBITDA | Rs 168 crore | Rs 103.85 crore | +61.87% |
The numbers align with a credible capability to sustain a cmpdi dividend and a disciplined payout approach in the coming quarters.
Interim Dividend And Final Dividend: Payout Details And Dates
The Board of Directors approved the first interim dividend for FY27 at Rs 1.05 per equity share (face value Rs 2 per share), with the Audit Committee recommending the payout. The record date to determine shareholder eligibility for the interim dividend is Friday, 24 July 2026, and the payment is expected to be completed on or before 19 August 2026.
Separately, the final dividend for FY26 was set at Rs 1.06 per share, with a record date of Friday, 10 August 2026. The existence of an interim dividend alongside a final dividend signals a cash-return focus while maintaining a growth trajectory in the underlying business.
Price Action And Valuation Context: Rs 270.96, 6.9% Rise, And Multiples
CMPDI shares surged 6.90% to Rs 270.96 during Tuesday’s trading session, contributing to a roughly 45% gain over the past three months. The market capitalisation stands around Rs 18,097 crore. The 52-week high is Rs 283.69 and the 52-week low is Rs 150.10. The stock trades at P/E 28.55, P/S 4.75, and P/B 7.97. The 14-day RSI sits at 49.0, suggesting balanced near-term momentum rather than an overbought condition.
For context, CMPDI is a Coal India subsidiary, and investors often watch the coal india stock price for sector-level cues alongside CMPDI-specific news. The evolving cmpdi quarterly results narrative could influence both the stock's multiple and the dividend policy over the coming quarters.
In addition to the fundamentals, investors can use Swastika's Sarthi AI stock assistant to model how the cmpdi dividend policy interacts with multiple scenarios and to compare CMPDI's dividend track record with peers. Swastika's Sarthi AI stock assistant provides institutional-grade research on any stock or index to retail investors.
Investment Takeaways For Retail Investors: How To Use This Information
Key takeaways for a retail investor are to watch whether the revenue growth and profit expansion persist into the next quarters and whether the interim dividend policy remains stable. A sustained 18% revenue uplift and a 54% rise in net profit signal earnings credibility that can back a reliable cmpdi dividend stream, but investors should also compare CMPDI's multiples with peers and the overall sector dynamic. The stock's recent price action, a 6.9% one-day gain and a 45% three-month rally, underscores that valuation risk remains a consideration even as cash returns improve.
Frequently Asked Questions
What is the interim dividend announced by CMPDI for FY27?
The Board approved the first interim dividend for FY27 at Rs 1.05 per equity share, with a record date of July 24, 2026, and payment to be completed on or before August 19, 2026.
What are CMPDI's Q1 FY27 revenue and net profit figures?
Revenue From Operations was Rs 481.4 crore in Q1 FY27, up from Rs 409.3 crore a year earlier (18% YoY). Net profit stood at Rs 116.3 crore, up from Rs 75.5 crore (54% YoY).
What are CMPDI's current valuation metrics as of Q1 FY27?
CMPDI's P/E ratio is 28.55, price-to-sales 4.75, and price-to-book 7.97.
What is CMPDI's price action over the last 3 months and the 52-week high/low?
CMPDI shares gained around 45% in the last three months and recently rose 6.90% to Rs 270.96. The 52-week high is Rs 283.69 and the 52-week low is Rs 150.10.
When are the record dates for the interim dividend and the final dividend?
Interim dividend: record date July 24, 2026; payout by August 19, 2026. Final dividend for FY26: record date August 10, 2026.
Conclusion
For the retail investor, the CMPDI dividend story hinges on sustained earnings momentum and a track record of cash returns that can complement price appreciation. The Q1 FY27 results show meaningful revenue and profit expansion that supports an active payout policy, with an interim dividend of Rs 1.05 per share and a final dividend of Rs 1.06 per share for FY26, to be paid or recognized by the specified dates. Use a tight mental model: watch the earnings trend and the payout cadence, and triangulate with sector cues such as the coal india stock price to gauge whether CMPDI's dividend path can sustain a higher multiple over time.
Open your trading and demat account here
Reference :
1 : Economictimes
Big Budget


Popular Articles




.avif)
.avif)

.avif)



START YOUR INVESTMENT JOURNEY
Get personalized advice from our experts
- Dedicated RM Support
- Smooth and Fast Trading App
