


Zen Technologies Share Price Momentum: Monday Gains And Key Moving Averages




Key Takeaways
- zen technologies share price led Monday's momentum with a 4.20% rise to ₹1,838.50 as SMAs held.
- diamond power share price jumped 8.66% to ₹218.53, trading above its 30-, 50-, 150- and 200-day SMAs.
- Precot rose 4.92% to ₹775.75, remaining above all four major SMAs (30-, 50-, 150-, 200-day).
- Kotyark Industries, Lexus Granito India and Suraj showed weakness, signaling mixed sentiment.
On Monday, momentum ruled the street as select stocks sparked buying interest, with zen technologies share price moving higher as a leader in the rally. The day’s action included the diamond power share price rising and Precot continuing an uptrend, while a few counters faced selling pressure. Retail investors watched SMA signals across multiple time frames.
Zen Technologies Share Price Momentum: Monday Gains And SMA Signals
zen technologies share price advanced 4.20% to ₹1,838.50. It traded above its 30-day SMA of ₹1,764.46, 50-day SMA of ₹1,707.38, 150-day SMA of ₹1,488.22 and 200-day SMA of ₹1,474.63, signaling a positive technical setup across short-, medium- and long-term trends.
Diamond Power Share Price Movement: The Monday Rally
diamond power share price rose 8.66% to ₹218.53, with the diamond power infrastructure stock trading above its 30-day SMA ₹201.11, 50-day SMA ₹190.00, 150-day SMA ₹153.46 and 200-day SMA ₹152.54. This combination indicates rising momentum and broad-based strength across time horizons.
The data show a clear pattern: stocks that maintain price above moving averages tend to attract sustained buying interest, and this was visible in the Diamond Power-Precot-Zen cluster on Monday.
Investors should also note that the diamond power share price showed genuine strength by clearing these SMAs, suggesting the potential for continued upside if the price holds above the averages.
Precot Price Action: Uptrend Maintains Momentum
Precot share price gained 4.92% to ₹775.75, and the stock remained above its 30-day SMA of ₹739.37, 50-day SMA ₹685.50, 150-day SMA ₹525.17 and 200-day SMA ₹504.66. The sustained movement above these levels supports the case for a continued uptrend and buying interest.
In this momentum cluster, the zen technologies share price has also been part of momentum as it holds above the key SMA lines.
| Stock | Price | 30-day SMA | 50-day SMA | 150-day SMA | 200-day SMA |
|---|---|---|---|---|---|
| diamond power infrastructure stock | ₹218.53 | ₹201.11 | ₹190.00 | ₹153.46 | ₹152.54 |
| Precot | ₹775.75 | ₹739.37 | ₹685.50 | ₹525.17 | ₹504.66 |
| zen technologies share price | ₹1,838.50 | ₹1,764.46 | ₹1,707.38 | ₹1,488.22 | ₹1,474.63 |
The combination of price action and SMA alignment reinforces the momentum narrative for this cluster, particularly for Precot and Zen as they hold above critical averages.
Market Leaders And Laggards: Weakness In A Few Counters
Kotyark Industries share price declined 4.82% to ₹36.94. While the stock stayed above its 150-day and 200-day moving averages, it slipped below its 30-day SMA of ₹38.81 and 50-day SMA ₹38.56, indicating near-term weakness. Lexus Granito India share price fell 3.26% to ₹15.73, trading below all its key moving averages, signaling ongoing bearish momentum. Suraj share price dropped 3.19% to ₹222.20 and remained below its SMAs, suggesting persistent selling pressure across that counter.
In a broader sense, these moves show that while some stocks in the same market space are showing momentum, others are experiencing pullbacks. Retail traders should watch how these crossovers behave in the days ahead, as they can provide important clues about the strength of the broader uptrend.
Upper Circuits Indicate Demand In Several Stocks
In addition, Amir Chand Jagdish Kumar Exports, Gradiente Infotainment and Precot were locked in their upper circuits, indicating strong demand with limited selling availability. Such list of upper circuit locks points to selective demand across the market landscape on Monday.
How Retail Investors Can Interpret These Signals
From a practical standpoint, retail investors should combine price action with SMA context and check the breadth of the move, volume and liquidity. If the price stays above the 30-day/50-day SMAs for several sessions, it may indicate a more robust uptrend, whereas a break below these moving averages can be a warning sign to tighten risk controls. Diversification and position sizing are essential when participating in momentum plays; use stop-losses and define your risk tolerance to avoid large drawdowns.
For deeper stock-level insights and real-time updates you can rely on Swastika's research resources and tools, including the Swastika's Sarthi AI stock assistant.
Frequently Asked Questions
What happened to zen technologies share price on Monday?
Zen Technologies share price advanced 4.20% to ₹1,838.50, trading above its 30-day SMA of ₹1,764.46, 50-day SMA ₹1,707.38, 150-day SMA ₹1,488.22 and 200-day SMA ₹1,474.63.
Which stocks led the gains on Monday besides Zen Technologies?
Diamond Power Infrastructure stock rose 8.66% to ₹218.53 while Precot gained 4.92% to ₹775.75, with both trading above their moving averages.
What do the SMA levels indicate about Monday's rally?
All three leading counters traded above their 30-day, 50-day, 150-day and 200-day SMAs, indicating buying momentum across short-, medium- and long-term trends.
Which counters showed weakness on Monday?
Kotyark Industries declined 4.82% to ₹36.94, Lexus Granito India fell 3.26% to ₹15.73 and Suraj dropped 3.19% to ₹222.20, signaling mixed sentiment.
How can investors gain deeper stock insights from Swastika?
Investors can use Swastika's research resources and tools, including Swastika's Sarthi AI stock assistant, for deeper analysis and real-time signals.
Conclusion
Retail investors should approach momentum with a disciplined mindset, balancing upside potential with defined risk controls. The Monday rally across zen technologies share price alongside diamond power infrastructure stock and Precot offers a practical reminder that price action above key moving averages often correlates with continued buying interest. Use a structured mental model: trend-following at the overlay of SMA levels and prudent risk management to participate in momentum without getting carried away.
Latest Articles
.avif)
Types of Orders


What Is an Order?
An order is an instruction given to a broker or brokerage firm to buy or sell a security for an investor. It's the basic way to trade in the stock market. Orders can be placed by phone, online, or through automated systems and algorithms. Once an order is placed, it goes through a process to be completed.
There are different types of orders, allowing investors to set conditions like the price at which they want the trade to happen or how long the order should stay active. These conditions can also determine whether an order is triggered or cancelled based on another order.
Types of Orders
Market Order
A market order is an instruction to buy or sell a stock at the current price available in the market. With a market order, the investor doesn't control the exact price they pay or receive—the market decides the price. In a fast-moving market, the price can change quickly, so you might end up paying more or receiving less than expected.
For example, if an investor wants to buy 100 shares of a stock, they will get those 100 shares at whatever the current asking price is at that moment. If the price is ₹500 per share, they’ll buy 100 shares for ₹500 each. However, if the price changes before the order is executed, they might pay a different amount.
Limit Order
A limit order is an instruction to buy or sell a stock at a specific price or better. This allows investors to avoid buying or selling at a price they don't want. If the market price doesn't match the price set in the limit order, the trade won't happen. There are two types of limit orders: a buy limit order and a sell limit order.
Buy Limit Order:
A buy limit order is placed by a buyer, specifying the maximum price they are willing to pay. For example, if a stock is currently priced at ₹900, and an investor sets a buy limit order for ₹850, the order will only go through if the stock price drops to ₹850 or low
Sell Limit Order:
A sell limit order is placed by a seller, specifying the minimum price they are willing to accept. For example, if a stock is currently priced at ₹900, and an investor sets a sell limit order for ₹950, the order will only go through if the stock price rises to ₹950 or higher.
Stop Order
A stop order, also known as a stop-loss order, is a trade order that helps protect an investor from losing too much money on a stock. It automatically sells the stock when its price drops to a certain level. While stop orders are commonly used to protect a long position (where the investor owns the stock), they can also be used with a short position (where the investor has sold a stock they don't own yet). In that case, the stock would be bought if its price rises above a certain level.
Example for a Long Position:
Imagine an investor owns a stock currently priced at ₹1,000. They're worried the price might drop, so they place a stop order at ₹800. If the stock price falls to ₹800, the stop order will trigger, and the stock will be sold. However, the stock might not sell exactly at ₹800—it could be sold for less if the price is dropping quickly.
Example for a Short Position:
If an investor has shorted a stock at ₹1,000 and doesn't want to lose too much if the price rises, they might set a stop order at ₹1,200. If the price goes up to ₹1,200, the stop order will trigger, and the investor will buy the stock at that price (or higher if the price is rising quickly) to cover their short position.
To avoid selling at a much lower price than expected, investors can use a stop-limit order, which sets both a stop price and a minimum price at which the order can be executed.
Stop-limit order
A stop-limit order is a trade order that combines features of both a stop order and a limit order. It involves setting two prices: the stop price and the limit price. When the stock reaches the stop price, the order becomes a limit order. This means the stock will only be sold if it can meet or exceed the limit price, giving the investor more control over the selling price.
Example:
Let's say an investor owns a stock currently priced at ₹2,500. They want to sell the stock if the price drops below ₹2,000, but they don't want to sell it for less than ₹1,900. To do this, the investor sets a stop-limit order with a stop price of ₹2,000 and a limit price of ₹1,900.
If the stock price falls to ₹2,000, the stop order triggers, but the stock will only be sold if it can get at least ₹1,900 per share. If the price drops too quickly and falls below ₹1,900 before the order can be executed, the stock won’t be sold until it reaches ₹1,900 or higher.
In contrast, a regular stop order would sell the stock as soon as it hits ₹2,000, even if the price continues to fall rapidly and ends up selling for less. The stop-limit order gives the investor more control over the price, but there’s a chance the stock won’t sell if the limit price isn’t met.
Trailing stop order
A trailing stop order is a type of stop order that adjusts automatically based on the stock's price movement. Instead of setting a specific price, the trailing stop is based on a percentage change from the stock's highest price. This helps protect profits while allowing the stock to rise in value. If the stock's price falls by the set percentage, the order is triggered and the stock is sold.
Example for a Long Position:
Imagine an investor buys a stock at ₹1,000 and sets a trailing stop order with a 20% trail. If the stock price goes up to ₹1,200, the trailing stop will automatically move up to ₹960 (20% below ₹1,200). If the stock price then drops to ₹960 or lower, the trailing stop order will trigger, and the stock will be sold.
Example for a Short Position:
If an investor has shorted a stock at ₹1,000 and sets a trailing stop of 10%, the stop price would move down as the stock price falls. If the stock price rises by 10% from its lowest point, the trailing stop order will trigger, and the stock will be bought to cover the short position.
The trailing stop order allows the investor to lock in gains as the stock price moves favorably, while still providing protection if the market turns.
Immediate or Cancel (IOC) order
An Immediate or Cancel (IOC) order is a type of stock order that must be executed immediately. If the full order cannot be filled right away, whatever portion can be filled will be completed, and the rest will be canceled. If no part of the order can be executed immediately, the entire order is canceled.
Example:
Suppose an investor places an IOC order to buy 500 shares of a stock at ₹1,000 per share. If only 300 shares are available at ₹1,000 right away, the IOC order will purchase those 300 shares, and the remaining 200 shares will be canceled. If no shares are available at ₹1,000 immediately, the entire order will be canceled.
Good Till Cancelled (GTC) order
A Good Till Cancelled (GTC) order is a type of stock order that stays active until you choose to cancel it. Unlike other orders that expire at the end of the trading day, a GTC order remains open until you either cancel it or it gets executed. However, most brokerages set a limit on how long you can keep a GTC order open, usually up to 90 days.
Example:
Let's say an investor wants to buy a stock at ₹500, but the current price is ₹600. They place a GTC order to buy 100 shares at ₹500. This order will stay active until the stock price drops to ₹500 and the order is filled, or until the investor cancels the order. If the price never drops to ₹500 and the investor doesn't cancel the order, it will automatically expire after 90 days (or whatever time limit the brokerage sets).
Good 'Till Triggered (GTT) order
A Good 'Till Triggered (GTT) order is similar to a Good 'Til Canceled (GTC) order but with a key difference: a GTT order only becomes active when a specified trigger condition is met. Once the trigger price is reached, the order is placed in the market. If the trigger price is not reached, the order stays inactive.
Example:
Imagine an investor wants to buy a stock currently priced at ₹600, but only if it drops to ₹550. They set a GTT order with a trigger price of ₹550. If the stock price falls to ₹550, the order is activated and placed in the market. If the price never drops to ₹550, the order remains inactive until it reaches the trigger price or the investor cancels it.
GTT orders can also have a time limit, so if the trigger price isn’t reached within a certain period, the order will expire.
Conclusion
In the stock market, an order is a fundamental instruction to buy or sell a security, tailored to an investor's strategy and market conditions. The various types of orders—such as market, limit, stop, stop-limit, trailing stop, IOC, GTC, and GTT—offer flexibility to manage price, timing, and risk. Understanding these order types empowers investors to execute trades more effectively, ensuring alignment with their financial goals and risk tolerance.
Learn how to optimize your trades and manage risk with Swastika!

Understanding Long Strangles
The stock market can be unpredictable, and sometimes you might have a feeling that a stock's price will move significantly, but you're unsure if it will go up or down. This is where the long strangle strategy comes in.
The long strangle can be a valuable strategy for options traders who anticipate high volatility but are unsure of the price direction. However, it's important to understand the risks involved, including limited profit potential and the possibility of losing your entire investment.
What is a Long Strangle?
A long strangle is an options trading strategy that helps investors make money when they expect a big price move in a stock but aren't sure which direction it will go. This strategy involves buying two options: a call option and a put option with different strike prices. Both options are out-of-the-money, meaning they are not yet profitable at the current stock price.
Both call and put options are out-of-the-money (OTM), meaning their strike prices are above (for calls) or below (for puts) the current market price of the underlying asset.
Why Use a Long Strangle?
- Profit from Volatility: This strategy aims to benefit from a large price movement in the underlying asset, regardless of the direction (up or down).
- Lower Cost: Compared to a straddle, long strangles are generally less expensive because OTM options cost less than at-the-money (ATM) options used in straddles.
Example (using INR):
Imagine Nifty is at 10,400 and you expect an important price swing but are unsure of the direction. You can create a long strangle by:
- Buying a Nifty call option with a strike price of ₹10,600 (OTM call).
- Buying a Nifty put option with a strike price of ₹10,200 (OTM put).
Key Points:
- The net cost you pay for both options is your maximum loss.
- You'll potentially make a profit if the Nifty price moves above ₹10,600 (call strike + premium) or below ₹10,200 (put strike - premium).
Here's a table summarizing the profit and loss potential:

Break-even Points:
A long strangle has two break-even points:
- Lower Break-even Point: Strike price of Put - Net Premium
- Upper Break-even Point: Strike price of Call + Net Premium
The stock price needs to move beyond these break-even points for you to start making a profit.
Risks to Consider:
- Limited Profit Potential: a long strangle has a limited profit potential capped by the strike prices and volatility.
- Losing Your Investment: If the stock price ends up between the strike prices at expiration, you lose your entire investment (net debit).
When to Use a Long Strangle:
- High Volatility Expected: This strategy is suitable when you predict significant price changes in the underlying asset due to events like elections, policy changes, or earnings announcements.
Steps to Execute a Long Strangle:
- Choose the Underlying Asset: Select a stock or index where you expect an important price movements but are unsure of the direction.
- Pick OTM Strike Prices: Choose strike prices for both call and put options that are OTM but allow for enough price movement in either direction.
- Calculate Total Cost: Determine the combined cost of buying both options, including fees and commissions.
- Place Your Orders: Place buy orders for the chosen call and put options with specific expiration dates and strike prices. Make sure that you have sufficient funds in your brokerage account.
Conclusion:
The long strangle can be a valuable strategy for options traders who predict high volatility but are unsure of the price direction. However, it's crucial to understand the risks involved, including limited profit potential and the possibility of losing your entire investment.
Learn more about financial terminologies with Swastika!

What is a Bear Put Spread?
Options trading offers various strategies to maximize returns and minimize risks. One common strategy is the bear put spread, which helps investors profit from a gradual decline in a stock’s price. This blog will explain the bear put spread in simple terms with easy examples.
Goal of the Bear Put Spread
The primary goal of a bear put spread is to profit from a gradual decrease in the price of the underlying stock.
Understanding the Bear Put Spread
A bear put spread involves two steps:
- Buy a Put Option (Long Put): This gives you the right to sell a stock at a higher price.
- Sell a Put Option (Short Put): This obligates you to buy the same stock at a lower price if exercised.
Both options have the same stock and expiration date. You set up this strategy for a net cost (or net debit) and profit when the stock's price falls.
How to Set Up a Bear Put Spread
- Buy an ATM Put Option: An at-the-money (ATM) put option has a strike price close to the current market price.
- Sell an OTM Put Option: An out-of-the-money (OTM) put option has a strike price lower than the current market price.
- Ensure Both Options Have the Same Expiry Date
Example of a Bear Put Spread
Let's use stock XYZ as an example:
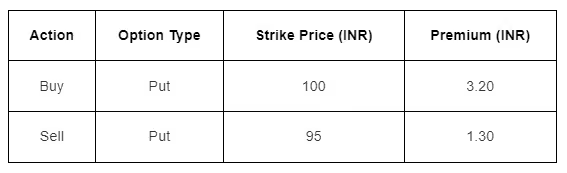
- Total Cost: 3.20 - 1.30 = 1.90 INR
How You Make Money
- Maximum Profit: The most you can earn is the difference between the two strike prices minus the net cost.
In this example:
- Difference between strike prices: 100 - 95 = 5.00 INR
- Net cost: 1.90 INR
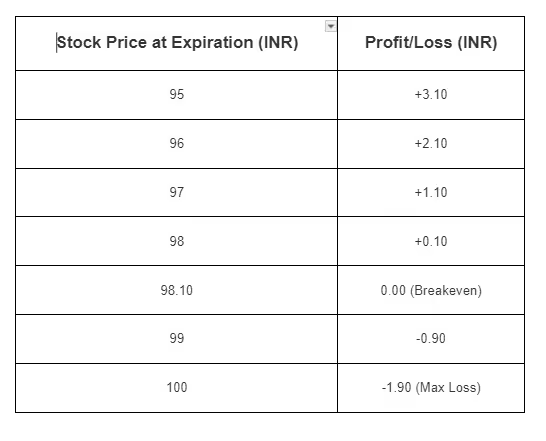
- Maximum profit: 5.00 - 1.90 = 3.10 INR
You achieve this maximum profit if the stock price is below the lower strike price (95 INR) at expiration.
- Maximum Loss: The most you can lose is the net cost you paid.
In this example:
- Maximum loss: 1.90 INR
This loss happens if the stock price is above the higher strike price (100 INR) at expiration.
- Breakeven Price: The stock price at which you neither make nor lose money.
In this example:
- Breakeven: 100 - 1.90 = 98.10 INR
Profit/Loss Table
Advantages and Disadvantages of a Bear Put Spread
Pros
- Less Risky than Short-Selling: Limits your losses to the net amount paid.
- Profitable in Modestly Declining Markets: Effective when expecting moderate price declines.
Cons
- Risk of Early Assignment: The buyer of your short put can exercise it early if the stock price falls sharply. This would force you to buy the stock at a potentially unfavorable price.
- Limited Profit: Profits are capped at the difference between strike prices minus the net cost.
- Risk if Stock Price Rises: If the stock price rises significantly, the strategy results in a loss.
When to Use the Bear Put Spread
This strategy is ideal when you expect a moderate decline in stock prices and want to limit your risk. It works best in low volatility markets, as increased volatility after you enter the trade can amplify profits.
What Does the Bear Put Spread Result In?
The bear put spread results in a net debit, calculated as the difference between the higher and lower strike prices. The maximum loss is the net debit paid.
Closing a Bear Put Spread
It's usually a good idea to close a bear put spread before it expires if it's profitable. This helps you capture the maximum gain and avoid the risk of early assignment on the short put. If the short put is exercised, it creates a long stock position, which can be closed by selling the stock or exercising the long put. These actions may incur additional fees, so closing a profitable position early is often wise.
Summary
The bear put spread is a useful strategy for options traders expecting a moderate decline in stock prices. It offers a balanced approach by limiting both potential profits and losses, making it a safer alternative to other bearish strategies.
Learn more about financial terminologies with Swastika!

The 12 Stock Market Movies You Must Watch
The stock market is a fascinating world filled with drama, mystery, and high stakes. It’s no wonder that Hollywood has produced some incredible movies centered around the financial world. Whether you're a seasoned investor or just curious about the stock market, these movies offer valuable insights and a dose of entertainment. Here are 12 must-watch stock market movies that provide a thrilling look into the highs and lows of trading, investing, and the world of finance.
1. Wall Street (1987)
- Director: Oliver Stone
- Synopsis: This classic movie follows the story of Bud Fox, a young and ambitious stockbroker, who becomes entangled with the ruthless corporate raider Gordon Gekko. Gekko's famous mantra, "Greed is good," captures the essence of the 1980s financial world.
- Why Watch: "Wall Street" is a compelling tale of ambition, greed, and the moral dilemmas faced by those in the high-stakes world of finance. Michael Douglas’s portrayal of Gordon Gekko won him an Academy Award.
2. The Wolf of Wall Street (2013)
- Director: Martin Scorsese
- Synopsis: Based on the true story of Jordan Belfort, this film narrates his rise and fall as a stockbroker who engages in corruption and fraud on Wall Street. It’s a wild ride through the excesses and indulgence of the financial world.
- Why Watch: With Leonardo DiCaprio’s electrifying performance and Scorsese’s masterful direction, this film offers an steadfast look at the darker side of Wall Street. It's both hilarious and horrifying.
3. Margin Call (2011)
- Director: J.C. Chandor
- Synopsis: Set during the early stages of the 2008 financial crisis, "Margin Call" follows key employees at an investment bank over a 24-hour period as they realize the impending disaster.
- Why Watch: This movie provides a gripping and realistic portrayal of the decisions and panic that led to the financial meltdown. The ensemble cast, including Kevin Spacey and Jeremy Irons, delivers powerful performances.
4. The Big Short (2015)
- Director: Adam McKay
- Synopsis: Based on Michael Lewis’s book, "The Big Short" tells the story of a group of investors who predicted the 2008 financial crisis and bet against the housing market, making a fortune in the process.
- Why Watch: This film explains complex financial concepts in an accessible and entertaining way. With a star-studded cast including Christian Bale, Steve Carell, and Ryan Gosling, it’s both educational and highly engaging.
5. Guru (2007)
- Director: Mani Ratnam
- Synopsis: Inspired by the life of businessman Dhirubhai Ambani, "Guru" follows the journey of Gurukant Desai, a village boy who rises to become a powerful tycoon. The film explores his ambition, ethics, and the challenges he faces in building his business empire.
- Why Watch: "Guru" offers a compelling narrative about entrepreneurship, ambition, and the complexities of business ethics. Abhishek Bachchan's portrayal of Gurukant Desai and Aishwarya Rai's performance as his supportive wife add depth to the story.
6. Scam 1992: The Harshad Mehta Story (2020, Web Series)
- Director: Hansal Mehta
- Synopsis: Based on the true story of Harshad Mehta, a stockbroker who was involved in India's largest financial scam in the 1990s. The series chronicles his rise and fall, exploring the complexities of the stock market and the allure of wealth.
- Why Watch: "Scam 1992" is a critically acclaimed series that provides a detailed and nuanced portrayal of the stock market boom and subsequent crash. Pratik Gandhi's performance as Harshad Mehta received widespread praise for its depth and authenticity.
7. The Big Bull (2021)
- Director: Kookie Gulati
- Synopsis: Loosely based on the life of Harshad Mehta, "The Big Bull" portrays the journey of a small-time stockbroker who becomes a financial wizard. The film explores his meteoric rise, manipulation of the stock market, and eventual downfall.
- Why Watch: "The Big Bull" offers a dramatized account of the events surrounding Harshad Mehta's life, providing insights into the stock market's workings and the ethical dilemmas faced by traders. Abhishek Bachchan's performance as the protagonist is captivating.
8. Trading Places (1983)
- Director: John Landis
- Synopsis: This comedy classic tells the story of a snobbish investor and a street hustler whose lives are swapped as part of a bet by two wealthy brothers. The film explores themes of social class and the mechanics of the commodities market.
- Why Watch: "Trading Places" is a hilarious yet insightful look at the financial world. Eddie Murphy and Dan Aykroyd deliver memorable performances in this timeless comedy.
9. Boiler Room (2000)
- Director: Ben Younger
- Synopsis: A college dropout gets a job at a suburban investment firm, where he discovers the firm’s questionable business practices. He quickly rises through the ranks, only to face moral and legal dilemmas.
- Why Watch: "Boiler Room" offers a look at the high-pressure world of stock brokerage firms and the ethical challenges faced by brokers. It’s a thrilling and thought-provoking film.
10. Glengarry Glen Ross (1992)
- Director: James Foley
- Synopsis: Based on David Mamet’s play, this film follows a group of real estate salesmen who are under intense pressure to close deals. The story delves into their desperation and unethical tactics.
- Why Watch: With a stellar cast including Al Pacino, Jack Lemmon, and Alec Baldwin, "Glengarry Glen Ross" is a powerful exploration of the cutthroat nature of sales and the impact of capitalism on individuals.
11. Rogue Trader (1999)
- Director: James Dearden
- Synopsis: This film is based on the true story of Nick Leeson, a derivatives broker who caused the collapse of Barings Bank through unauthorized and risky trades.
- Why Watch: "Rogue Trader" provides a real-world cautionary tale about the dangers of unchecked trading and the consequences of financial recklessness. Ewan McGregor’s portrayal of Leeson is compelling.
12. Equity (2016)
- Director: Meera Menon
- Synopsis: This film centers around a senior investment banker who is navigating the world of IPOs while facing pressures from both her personal and professional life.
- Why Watch: "Equity" is one of the few films that focus on women in finance. It offers a unique perspective on the challenges faced by women in a male-dominated industry and is a gripping drama.
Conclusion
These 12 movies provide a captivating glimpse into the world of finance, each from a unique angle. From comedies to intense dramas and real-life stories, they explore the motivations, challenges, and ethical dilemmas faced by those in the stock market. Whether you’re an aspiring trader, an experienced investor, or simply someone interested in the financial world, these films are both entertaining and educational. They highlight the high stakes, the allure of wealth, and the potential pitfalls of the financial industry. So, grab some popcorn and get ready to dive into the fascinating world of stock market cinema!

How Does Monsoon Impact the Economy and Stock Market?
Monsoon season, with its heavy rains and thunderstorms, is a crucial period for many countries, especially those heavily reliant on agriculture like India. This season significantly impacts the economy and stock market. Let's break down how this happens in simple terms.
1. Impact on Agriculture
a. Crop Production:
Monsoons are essential for watering crops. A good monsoon means enough water for rice, wheat, sugarcane, and other important crops.
When there is enough rain, crops grow well, leading to a good harvest. This means farmers have more produce to sell, which boosts their income.
Conversely, if the monsoon is weak (less rain) or too strong (flooding), crops can be damaged, leading to a poor harvest. This can reduce farmers' incomes and increase food prices.
b. Rural Economy:
A large portion of the population in countries like India lives in rural areas and depends on agriculture for their livelihood.
A good monsoon improves rural incomes, leading to higher spending on goods and services. This increased spending supports local businesses and stimulates economic growth.
2. Impact on Industry
a. Raw Material Supply:
Industries that rely on agricultural products, such as food processing, textiles, and beverages, are directly affected by monsoon performance.
A good harvest ensures a steady supply of raw materials at stable prices, which benefits these industries. Poor monsoons can disrupt supply chains and increase costs.
b. Consumer Goods:
Higher rural incomes from a good monsoon increase the demand for consumer goods, such as electronics, clothing, and household items.
Companies manufacturing these goods see higher sales and profits, positively affecting their stock prices.
3. Impact on Inflation
Inflation is the rate at which prices for goods and services rise. Food prices are a major component of inflation.
A good monsoon keeps food production high and prices low, controlling inflation.
Poor monsoon leads to lower food production, higher prices, and increased inflation, which can affect the entire economy.
4. Impact on Government Finances
The government often has to step in to support farmers during bad monsoon years through subsidies and relief packages.
This additional spending can strain the government's budget and increase public debt.
5. Impact on Stock Market
a. Agricultural Stocks:
Companies directly related to agriculture, like those producing fertilizers, pesticides, and tractors, benefit from a good monsoon. Their stock prices tend to rise as investors anticipate higher sales.
Conversely, a poor monsoon can lead to lower demand for these products, causing stock prices to fall.
b. Consumer Goods Companies:
Companies producing consumer goods see increased sales in rural areas during a good monsoon, leading to higher stock prices.
If the monsoon is poor, reduced rural spending can negatively impact their sales and stock prices.
c. Overall Market Sentiment:
The stock market is influenced by investor sentiment. A good monsoon boosts investor confidence, leading to higher stock prices across various sectors.
A poor monsoon can create uncertainty and lower investor confidence, leading to market volatility and lower stock prices.
6. Impact on Interest Rates
Central banks monitor inflation closely. A good monsoon can lead to lower inflation, allowing central banks to keep interest rates low.
Low-interest rates make borrowing cheaper for businesses and individuals, stimulating economic activity.
High inflation from a poor monsoon might force central banks to raise interest rates to control prices, making borrowing more expensive and potentially slowing down economic growth.
Conclusion
The monsoon season plays a pivotal role in shaping the economy and stock market, particularly in agrarian countries. Good monsoons lead to increased agricultural output, stable inflation, and positive investor sentiment, benefiting the overall economy and stock market. Conversely, poor monsoons can disrupt economic stability, increase inflation, and cause market volatility. Understanding these dynamics helps investors, policymakers, and businesses make smart decisions during the monsoon season.

How to Start Investing in Stock Market in 2024
Whether you’re new to the investing world or have some experience under your belt, understanding the stock market can be a difficult task. With so many options, strategies, and risks involved, it’s important to have a clear understanding of how to invest wisely. In this blog post, we’ll break down the basics of investing in the Indian stock market for beginners, providing you with the knowledge and tools you need to get started.
Understanding the Stock Market
Before diving into stock investing, it’s important to understand what the stock market is and how it works. Simply put, the stock market is a place where you can buy and sell shares of publicly traded companies. It plays a vital role in the global economy by allowing companies to raise capital and enabling investors to own a piece of these companies and potentially profit from their success.
In India, the major stock exchanges facilitating these transactions are the Bombay Stock Exchange (BSE) and the National Stock Exchange (NSE). These exchanges provide a platform for trading shares, making it easier for investors to participate and for companies to secure funding.

Why Invest in Stocks?
Step 1. Set Your Investment Goals
Before you start investing, it’s important to define your investment goals. Are you looking to build long-term wealth, save for retirement, or generate passive income? By setting clear goals, you can develop a strategy that aligns with your objectives and risk tolerance.
Step 2.Determine How Much You Can Afford to Invest in Stocks
Before you start investing in stocks, it's important to figure out how much money you can comfortably set aside. First, look at your monthly income and expenses to see how much you have left over. Then, decide on an amount that won’t affect your day-to-day finances or other financial goals. Only invest money you won't need soon, as the market can be unpredictable. This careful planning helps you invest without risking your financial stability.
Step 3. Determine Your Investing Style
Your investing style shapes how you approach the market. Consider your preference: do you enjoy researching stocks and market trends, or do you prefer a more hands-off strategy?
There are three main investing styles:
- Active Investing: You actively manage your portfolio, choosing and trading stocks, bonds, and other assets using advanced brokerage tools. Pros include potential for higher returns and full control, but it's time-consuming and requires extensive research.
- Passive Investing: You invest in index funds, ETFs, or mutual funds through low-cost brokerage accounts. Pros include less time commitment, lower fees, and diversification, though potential returns may be lower compared to active trading.
- Professional Guidance: Working with a financial advisor offers personalized advice and expert management of your investments. Pros include tailored guidance, but cons include advisory fees and less direct control over investment decisions. Choose the style that best fits your goals and comfort level with risk and involvement.
Step 4: Choose the Right Investment Accounts
Selecting the right type of investment account is crucial for maximizing your returns and achieving your financial goals.
Types of Investment Accounts
- Demat Account: A Demat account holds your shares electronically instead of physical certificates. It's necessary for trading in the Indian stock market, providing convenience and security. However, there may be maintenance charges associated with maintaining this account.
- Trading Account: A trading account is used specifically for buying and selling securities in the stock market. It's essential for executing trades and managing your investments effectively. However, brokerage charges may apply for each transaction made through this account.
These accounts serve different purposes and cater to varying financial goals. Choosing the right one depends on your investment horizon, risk tolerance, and financial objectives.
5: Choose Your Investments
- Stocks: Stocks are pieces of ownership in individual companies. They can give you high returns, but they come with higher risk and you need to do your homework to choose wisely.
- Bonds: Bonds are like loans you give to companies or the government. They are safer than stocks and give you steady income, but the returns are usually lower.
- Mutual Funds: Mutual funds collect money from many people to invest in a variety of stocks and bonds. They spread out the risk and are managed by professionals, making them easier for beginners. However, you have to pay management fees and have less say in what gets bought or sold.
- Exchange-Traded Funds (ETFs): ETFs are funds that you can buy and sell on the stock exchange, just like stocks. They offer a mix of investments, usually at lower fees. However, they can have trading costs and can be a bit tricky to understand at first.
6: Tax Implications on Different Account Types
Consider the Tax Implications: Different accounts have different tax rules:
- Taxable Accounts: You pay taxes on any profits you make from selling investments, but you can add or take out money whenever you want.
- Tax-Deferred Accounts: Contributions to traditional IRAs and 401(k) s lower your taxable income now. You pay taxes on the money later when you take it out.
- Tax-Free Accounts: Roth IRAs and Roth 401(k) s are funded with money you've already paid taxes on. Your money grows tax-free, and you won't owe taxes when you take it out in retirement.
Choosing the right investment account depends on your financial goals, how much risk you're comfortable with, and the tax implications you prefer. Each account type has its own benefits and considerations that can impact your investment strategy and long-term financial plans.
Open a Brokerage Account
To begin investing, opening a brokerage account is essential. A brokerage account allows you to buy and sell stocks, bonds, ETFs, and mutual funds through a platform provided by the brokerage firm.
Swastika Investmart offers a range of investment options and personalized services, making it suitable for investors seeking customized solutions and local market expertise. However, its platform may be perceived as less technologically advanced compared to other brokerages listed. Choosing the right brokerage account depends on your specific needs and preferences, whether you prioritize low fees, advanced tools, or specialized customer support.
7: Build a Diversified Portfolio
Diversification helps manage risk by spreading investments across various asset classes.
How to Diversify
- By Asset Class:
- Stocks: Invest in a mix of different sectors and industries.
- Bonds: Include a variety of corporate, government, and municipal bonds.
- Other Assets: Consider real estate, commodities, and alternative investments.
- By Geography:
- Domestic: Invest in companies within your own country.
- International: Include investments in foreign market.
8: Monitor and Rebalance Your Portfolio
Regularly monitoring and rebalancing your portfolio ensures it stays aligned with your goals.
- Monitoring Your Portfolio
- Performance Review: Check the performance of your investments periodically.
- News and Updates: Stay informed about market trends and news affecting your investments.
- Rebalancing
- Frequency: Review and rebalance your portfolio annually or semi-annually.
- Adjustments: Sell over performing assets and buy underperforming ones to maintain your target allocation.
9. Stay Updated &Educate Yourself
One of the most important steps in investing is educating yourself about the basics of investing, different investment options, and the risks involved. There are plenty of resources available online, such as blogs, books, and investment websites like Investopedia, where you can learn more about investing.
Finally, it’s important to stay informed about the stock market and economic trends that may impact your investments. Read financial news, follow market updates, and stay up-to-date on company earnings reports to make informed investment decisions. By staying informed, you can make smarter investment choices and take advantage of profitable opportunities.
Conclusion
Starting to invest in stocks in 2024 requires a clear understanding of the basics, a determination of how much you can afford to invest, an assessment of your risk tolerance, and a defined investing style. By choosing the right investment accounts, selecting diversified investments, and continuously educating yourself, you can build a robust investment portfolio that helps you achieve your financial goals. Remember to regularly monitor and rebalance your portfolio to ensure it stays aligned with your objectives.
Big Budget


Popular Articles




.avif)
.avif)

.avif)




START YOUR INVESTMENT JOURNEY
Get personalized advice from our experts
- Dedicated RM Support
- Smooth and Fast Trading App
