


ONGC Share Price: Live Update, Key Levels, And Retail Investor Takeaways




Key Takeaways
- The ognc share price hovered around Rs 248–252 in today's session, signaling cautious bullish momentum.
- Key resistance near Rs 251.45 (R2) and a current price around Rs 252 indicate a breakout attempt.
- P/E stood at 7.55 with EPS of 32.93, alongside a volume of 6,174,102 and a market cap of 312,657.68.
- Six-month beta of 1.0172 suggests price moves closely track market swings.
When energy demand drives policy and markets, a single stock ticker can reveal a larger story. The ognc share price has moved within a tight range as investors weigh supply dynamics, policy cues, and global energy volatility. For a retail investor, this isn't just a price tag–it's a signal about value, risk and timing. The monthly search volume for 'ongc share price' sits around 673,000, underscoring how many traders are chasing this data daily.
Ongc Share Price Live Update And What It Signals For Traders
The latest live data shows the ONGC share price around Rs 248.5 during the session, following a day where it settled at 244.96 in the previous close. As of 11:31:58 AM IST on 14 Jul 2026, the price was 248.5, with intraday moves mirroring a modest uptick for the day. Intraday data points like these help traders gauge momentum in a stock that has traded within a tight band recently.
Key intraday figures from the same feed include:
- Last traded price: 247.63
- Volume: 6,174,102
- Market capitalization: 312657.68
- P/E: 7.55
- EPS: 32.93
For readers seeking deeper context, consider the broader picture: a stock price hovering near resistance and above short-term averages can signal a potential breakout if sustained with volume. Swastika's Sarthi AI stock assistant can help you analyze the stock at a granular level and integrate it with your portfolio strategy.
Ongc Share Price Vs Fundamentals: P/E, EPS, And Market Cap Insights
Even as the price flickers in a narrow band, the fundamental picture remains relevant. The ONGC P/E ratio is 7.55 and earnings per share stands at 32.93, suggesting the stock trades at a modest multiple relative to earnings. With a volume of 6,174,102 shares, market cap sits at 312657.68, underscoring ONGC's standing as a large-cap energy player.
Three-month performance has shown a decline of -12.95%, while the monthly return is a positive 0.91% and the weekly return climbs 1.87%. The six-month beta is 1.0172, indicating that the stock tends to move with the broader market rather than in isolation. In this context, investors should weigh the stock's earnings power against its price multiple to gauge the marginal upside.
Ongc Historical Share Price Trends And Key Technical Levels
The ONGC historical share price shows resilience within a defined range. The stock closed the previous session at Rs 244.96, rising 1.42% the day before. Current technical overlays show the price trading at Rs 252.0 and sitting just above its second resistance level (R2) at Rs 251.45, which suggests a cautious breakout scenario if followed by sustained volume.
Short-term technicals include a 3-day simple moving average (SMA) of Rs 247.54 and a 5-day exponential moving average (EMA) of Rs 245.49, both providing context for near-term drift. The six-month beta of 1.0172 confirms a market-correlated path rather than heavy volatility. In the last four weeks, ONGC has seen a monthly return of 0.91% and a weekly return of 1.87%, reinforcing a slow but positive trend as the price tests resistance.
Ongc Dividend Outlook And The Role Of Its Share Price In A Diversified Portfolio
Dividend considerations (ongc dividend) are a common lens through which investors view value and cash return. The provided market data does not include explicit dividend figures, but investors typically factor dividend yields alongside the price-to-earnings picture. When bonds of energy policy and capital expenditure align, the stock's price action can reflect the potential for favorable distributions, though investors should confirm the latest dividend announcements from the company and exchange filings.
In a diversified portfolio, the ONGC share price can offer exposure to the energy sector's cycle, especially for investors seeking index-like exposure with a value tilt. The stock's price movements–coupled with its stable P/E and moderate EPS–can complement more cyclical bets in a broader asset mix.
Ongc Market Cap And Growth Potential: What Retail Investors Should Consider
From a market-cap perspective, ONGC shows a capitalization figure of 312657.68 in the data. The stock's six-month beta is 1.0172, consistent with a broader-market orientation rather than extreme volatility. The price movement over the last three months is -12.95%, but the month and weekly gains (0.91% and 1.87%, respectively) imply a potential stabilization or gradual recovery depending on oil and gas demand cycles and policy signals. With the price around Rs 252 and key resistance near Rs 251.45, traders should watch for a sustained move above R2 on higher volumes to confirm a breakout rather than a whipsaw pullback.
For retail investors, the takeaway is to balance value, growth prospects, and risk. If the stock clears Rs 252 with rising volume, it may indicate a shifting momentum; if it breaks below recent support near Rs 244 with increased volume, it could set the scene for a retracement toward the 3-day SMA and 5-day EMA. Always align entry and exit decisions with a well-defined risk plan and consider external catalysts such as policy shifts or energy demand trends. For deeper, stock-level insight, use Swastika's Sarthi AI stock assistant.
Ongc Stock Price And Sector Outlook: How Oil And Gas Trends Influence The Price
The ONGC stock price is not just a price; It sits inside the energy value chain. When crude oil trades higher, upstream players like ONGC often see strengthening sentiment, as evidenced by the price range around Rs 244–252 in recent sessions. The sector's growth is shaped by domestic demand, capex cycles in energy infrastructure, and global supply dynamics. For retail investors, tracking sector indices and oil price trends alongside ONGC share price can provide a composite view of risk and opportunity.
Given the price action and technical overlays (R2, SMA, EMA), a break above Rs 252 with volume could indicate momentum that extends beyond the stock's current range, while a move below Rs 244 could trigger consolidation. The stock's six-month beta of 1.0172 also implies that macro-market movements carry a meaningful influence on the price. Investors should maintain a diversified approach and use Sarthi to model sector-specific scenarios in their portfolios.
Related Reads
Frequently Asked Questions
What is the current ognc share price as observed in the latest update?
As of the latest feed, the ongc share price was around Rs 247.63 to Rs 248.5 intraday, with an 11:31:58 AM IST reading at 248.5 in one update. Intraday moves show modest upticks in the session.
What are ONGC's valuation and earnings metrics from the data?
The stock carries a P/E of 7.55 and an EPS of 32.93, with a reported volume of 6,174,102 shares and a market capitalization of 312657.68.
What are the key technical levels for ongc share price today?
The price is testing resistance around Rs 251.45 (R2) with the current price around Rs 252.0, while 3-day SMA sits at Rs 247.54 and 5-day EMA at Rs 245.49.
What does the six-month beta say about ONGC's risk relative to the market?
The six-month beta is 1.0172, indicating ONGC's price moves are roughly in line with the broader market rather than showing elevated idiosyncratic risk.
Where can I get deeper stock-level analysis for ONGC?
You can access in-depth, stock-level analysis with Swastika's Sarthi AI stock assistant:Swastika's Sarthi AI stock assistant.
Conclusion
For the retail investor, the current ONGC share price snapshot suggests a stock trading near a critical inflection point. The price is testing resistance around Rs 251.45 and could break higher if volume confirms the move; otherwise, a consolidation near 244–248 remains plausible. A practical mental model is to treat the stock like a ladder: look for the price to clear the resistance with rising volume, otherwise wait for a pullback to key moving averages around 245–248 before considering a position. Use the Sarthi AI stock assistant to run deeper stock-level scenarios and integrate ONGC into a broader energy exposure in your portfolio.
In practice, this means you could set defined rules: a breakout above Rs 252 on strong volume as a potential buy signal for a tactical trade, and a pullback toward the 3-day SMA around 247.54 or the 5-day EMA around 245.49 as a potential longer-term entry. Always pair price action with risk controls, such as stop-loss levels and position sizing, to ensure you remain aligned with your overall plan. Swastika's Sarthi AI stock assistant can help crystallize these rules into actionable steps for your portfolio.
Open your trading and demat account here
Reference :
1 : Economictimes
Latest Articles
%2520(1).avif)
Futures Contract: Understanding the Basics


Introduction to Futures
Futures contracts are standardized agreements to buy or sell a specific quantity of an asset at a predetermined price on a specified future date. They are traded on exchanges and can cover a wide range of underlying assets, including commodities, stocks, currencies, and indexes.
When Was the Futures Index Introduced?
The concept of futures trading dates back centuries, but modern index futures were introduced to address the need for hedging and speculation on the performance of stock markets as a whole. Key milestones include:
- 1970s: The idea of financial futures gained traction with the introduction of currency futures.
- 1982: The first stock index futures contract, based on the S&P 500, was introduced by the Chicago Mercantile Exchange (CME).
- 2000: In India, the introduction of index futures trading began on June 12, 2000, when the National Stock Exchange (NSE) launched trading in futures contracts on the S&P CNX Nifty (now known as Nifty 50).
How Futures Work
- Standardization: Each futures contract is standardized in terms of the quantity of the underlying asset, quality (if applicable), and delivery date.
- Margin Requirement: Traders must deposit an initial margin to open a futures position and a maintenance margin must be maintained. This acts as a performance bond.
- Mark-to-Market: Futures contracts are marked to market daily, meaning gains and losses are calculated at the end of each trading day based on the market price.
- Settlement: Futures can be settled either by physical delivery of the underlying asset or by cash settlement, depending on the contract specifications.
Types of Futures Contracts
Equity Futures
Equity futures are financial contracts where parties agree to buy or sell a specified quantity of shares of a company's stock at a predetermined price on a future date. These contracts are traded on exchanges and serve multiple purposes:
- Speculation: Traders speculate on the future price movements of stocks to profit from anticipated price changes.
- Hedging: Investors use futures contracts to hedge against potential losses in their equity portfolios. By locking in prices now, they protect themselves from adverse market movements in the future.
- Liquidity: Equity futures provide liquidity to the market by enabling efficient trading of large volumes of stocks without needing to own the underlying assets.
Currency Futures
Currency futures are standardized contracts that obligate parties to exchange a specified amount of one currency for another at a future date, at a predetermined exchange rate. Key features include:
- Risk Management: Businesses use currency futures to mitigate the risks associated with fluctuating exchange rates when engaging in international trade.
- Speculation: Investors and traders speculate on the future movements of currency pairs to profit from anticipated changes in exchange rates.
- Arbitrage: Currency futures allow for arbitrage opportunities, where traders exploit price differences between futures contracts and the spot market.
Commodity Futures
Commodity futures involve contracts for the purchase or sale of physical commodities at a future date and a predetermined price. This market includes:
- Agricultural Products: Futures contracts for agricultural commodities such as wheat, corn, soybeans, and sugar help farmers manage the risk of price fluctuations and ensure stable income.
- Metals: Futures contracts for metals like gold, silver, copper, and platinum are traded to hedge against volatility and as a store of value in uncertain economic times.
- Energy Products: Futures contracts for crude oil, natural gas, and other energy commodities allow producers, consumers, and investors to manage price risks associated with fluctuations in global energy markets.
The Auction Process in Futures Trading
The auction process in futures trading involves buyers and sellers placing bids and offers on the exchange. The process ensures transparency and fair price discovery. Key elements include:
- Open Outcry System: Historically, traders physically present on the exchange floor shouted bids and offers. Though less common now, it still exists in some markets.
- Electronic Trading: Most futures trading now occurs electronically, with bids and offers matched by computer systems.
Important Facts About Lot Changes
- Lot Size: The lot size is the standardized quantity of the underlying asset represented by one futures contract.
- Regulation Changes: Exchanges and regulatory bodies periodically review and adjust lot sizes to align with market conditions and trading volumes.
- Impact on Traders: Changes in lot size can affect margin requirements, liquidity, and overall trading strategy.
Advantages of Trading Futures
- Leverage: Futures require only a small margin relative to the value of the contract, offering high leverage.
- Liquidity: Many futures contracts are highly liquid, allowing traders to enter and exit positions easily.
- Price Discovery: Futures markets contribute to efficient price discovery for the underlying assets.
- Hedging: Futures provide a mechanism for hedging risk against price movements in underlying assets.
Risks in Futures Trading
- Leverage Risk: While leverage can amplify gains, it can also magnify losses.
- Market Risk: Prices can move unfavorably, resulting in significant losses.
- Liquidity Risk: In less liquid markets, it can be difficult to enter or exit positions without affecting the market price.
- Counterparty Risk: Although minimized by the clearinghouse, there is still some risk of counterparty defaulting.
Conclusion
Derivative trading, particularly futures, offers significant opportunities for hedging, speculation, and arbitrage. Understanding the mechanics, types, and risks associated with futures contracts is crucial for anyone looking to engage in this form of trading. As with any financial instrument, thorough research and risk management are essential to successful trading in derivatives markets.
Stay updated with Swastika and learn more about Futures & Options.
Introduction to derivatives trading
What is Derivative Trading?
Derivative trading involves financial instruments whose value is derived from the value of an underlying asset, index, or rate. These instruments can be contracts such as futures, options, forwards, and swaps. The underlying assets could range from stocks, bonds, commodities, currencies, interest rates, and market indexes. In India, the derivatives market is highly active, with the NSE being one of the largest derivatives exchanges globally in terms of contract volumes
Uses of Derivatives
- Risk Management: Derivatives are extensively used for hedging risks associated with price volatility in financial markets. For example, airlines use derivatives to hedge against fluctuations in fuel prices, while farmers hedge against commodity price changes.
- Speculation: Traders and investors use derivatives to speculate on price movements, aiming to profit from anticipated changes in asset prices without owning the underlying assets. Speculation adds liquidity and price discovery to markets.
- Portfolio Diversification: Institutional investors and fund managers use derivatives to diversify portfolios and enhance returns. Derivatives provide exposure to various asset classes and strategies that may not be accessible through direct investments.
Types of Derivatives
In the world of derivatives trading, financial instruments are often classified into linear and non-linear derivatives based on their payoff structures and how their values change to the underlying asset.
Linear Derivatives
Linear derivatives have a straightforward, direct relationship with the price movement of the underlying asset. This means that their value changes proportionally with changes in the underlying asset's price. Types of linear derivatives include:
- Futures Contract:
- Structure: Futures contracts are agreements to buy or sell an asset at a future date for a predetermined price. Their value moves linearly with the price of the underlying asset.
- Payoff: If the price of the underlying asset goes up, the value of a long futures contract increases, and vice versa for a short futures contract.
- Use Cases: Futures are often used for hedging price risk in commodities and financial markets, as well as for speculative purposes.
- Types of Futures Positions:
Long Futures
A long futures position refers to a scenario where an investor or trader buys futures contracts with the expectation that the price of the underlying asset will increase. Key characteristics include:
- Profit Motive: The holder of a long futures position aims to profit from an increase in the price of the asset underlying the futures contract.
- Obligations: The buyer of a futures contract commits to purchasing the underlying asset at the agreed-upon price (the futures price) upon expiration of the contract.
- Risk: The risk for a long futures position arises if the market price of the asset falls below the futures price, potentially resulting in losses.
Short Futures
A short futures position involves selling futures contracts with the anticipation that the price of the underlying asset will decline. Key aspects include:
- Profit Motive: The seller (short position holder) profits from a decrease in the price of the asset underlying the futures contract.
- Obligations: The seller commits to delivering the underlying asset at the agreed-upon price (futures price) upon contract expiration.
- Risk: The risk for a short futures position arises if the market price of the asset rises above the futures price, leading to potential losses for the seller.
Usage and Strategy
- Speculation: Traders often take long or short futures positions based on their market expectations. For example, a trader might take a long position if they believe the price of a commodity will rise due to supply shortages.
- Hedging: Investors use futures contracts to hedge against adverse price movements in their portfolios. For instance, a producer may take a short futures position to protect against falling prices of their output.
Understanding these positions is crucial for investors and traders to effectively manage risk and capitalize on market opportunities in futures trading.
Forwards Contracts
- Structure: Similar to futures, forwards are agreements to buy or sell an asset at a future date for a set price, but they are traded over-the-counter (OTC) and are customizable.
- Payoff: The payoff of a forward contract is linearly related to the price movement of the underlying asset.
- Use Cases: Forwards are frequently used in currency markets for hedging foreign exchange risk. In India, forward contracts are commonly used by businesses to hedge against currency fluctuations, especially given the volatility of the INR against major global currencies.
Non-Linear Derivatives
Non-linear derivatives have a more complex relationship with the underlying asset's price. Their value does not change proportionally with the underlying asset's price, leading to more intricate payoff structures. Types of non-linear derivatives include:
1. Options Contracts:
- Structure: Options give the holder the right, but not the obligation, to buy (call option) or sell (put option) an asset at a specified price before a certain date.
- Payoff: The payoff of an option is non-linear. For instance, a call option becomes more valuable as the underlying asset's price rises, but its rate of change is not constant and is affected by factors like volatility and time decay.
- Use Cases: Options are used for hedging, income generation (through selling options), and speculative strategies, offering more flexibility compared to linear derivatives.
The Indian options market has grown significantly, with the NSE's options segment seeing a surge in trading volumes, especially in index options like Nifty 50.
2. Types of Options & Positions:
Long Call Option: A long call position involves buying a call option, expecting the price of the underlying asset to rise. Characteristics include:
- Profit: Unlimited potential profit if the underlying asset's price rises significantly.
- Limited Risk: Losses are limited to the premium paid for the option.
Short Call Option (Call Writer): A short call position involves selling a call option, anticipating that the price of the underlying asset will either remain stagnant or decrease. Key features include:
- Profit: Limited to the premium received from selling the call option.
- Unlimited Risk: Losses can theoretically be unlimited if the price of the underlying asset rises significantly.
Long Put Option: A long put position entails buying a put option, expecting the price of the underlying asset to decrease. Characteristics include:
- Profit: Potential profit if the price of the underlying asset falls below the strike price.
- Limited Risk: Losses are limited to the premium paid for the option.
Short Put Option (Put Writer): A short put position involves selling a put option, anticipating that the price of the underlying asset will either remain stagnant or increase. Key aspects include:
- Profit: Limited to the premium received from selling the put option.
- Risk: Limited to potential losses if the price of the underlying asset decreases significantly, resulting in an obligation to buy the asset at a potentially higher price.
3. Swaps:
- Structure: Swaps involve the exchange of cash flows or other financial instruments between parties. Common types include interest rate swaps and currency swaps.
- Payoff: The value of swaps can be non-linear, especially in cases where the cash flows depend on variable interest rates or other changing conditions.
- Use Cases: Swaps are used for managing interest rate risk, currency risk, and other financial exposures. In the Indian market, interest rate swaps are commonly used by corporations and financial institutions to manage interest rate risk amidst fluctuating monetary policies.
Key Differences Between Linear and Non-Linear Derivatives
· Payoff Structure:
- Linear derivatives: Have a straightforward, direct relationship with the underlying asset’s price, resulting in a linear payoff structure.
- Non-linear derivatives: Have a more complex relationship, leading to a non-linear payoff structure that can involve factors like volatility, time decay, and strike prices.
· Risk and Reward: Linear Derivatives: Typically involve proportional risk and reward, making them easier to understand and predict.
- Non-Linear Derivatives: Offer potential for asymmetric risk and reward, which can be advantageous for hedging specific risks but also add complexity.
· Use Cases: Linear Derivatives: Commonly used for straight forward hedging and speculative purposes where direct exposure to the underlying asset’s price is desired.
- Non-Linear Derivatives: Used for more sophisticated strategies, including complex hedging, leveraging specific market views, and generating income through option selling strategies.
Conclusion
Understanding the distinction between linear and non-linear derivatives is crucial for effective derivatives trading. Linear derivatives, like futures and forwards, provide a direct and proportional exposure to the underlying asset's price movements, making them relatively straightforward to use. Non-linear derivatives, such as options and swaps, offer more complex payoff structures that can be leveraged for a variety of strategic purposes, although with increased complexity and risk.
By mastering both types of derivatives, traders and investors can create more versatile and effective strategies tailored to their specific risk management and speculative goals. The Indian derivatives market continues to expand, driven by increasing participation from retail and institutional investors, making it a key component of the overall financial ecosystem.

National Pension System (NPS): A Comprehensive Guide
The National Pension System (NPS) is a government-sponsored retirement savings scheme in India, introduced in 2004. It has gained popularity among investors seeking a low-cost, long-term savings option for their retirement. This blog post will discuss the basics of NPS, its features, tax benefits, rules, and the types of NPS accounts, along with the advantages and disadvantages of investing in it.
Basics of NPS
The National Pension System is a voluntary, defined-contribution retirement savings scheme that allows subscribers to accumulate savings for their retirement. Under this scheme, subscribers can regularly contribute to their NPS account, and the funds are invested in a mix of equity, debt, and government securities, based on their investment preferences. Upon retirement, subscribers can withdraw a portion of their savings as a lump sum, and the remaining amount is paid out as a monthly pension.
Types of NPS Accounts
1. Tier-I Account
- Purpose: This is the primary retirement account and is mandatory for all NPS subscribers.
- Withdrawals: Limited withdrawals allowed before retirement. Upon retirement, 60% of the corpus can be withdrawn tax-free, while the remaining 40% must be used to purchase an annuity.
- Tax Benefits: Contributions are eligible for tax deductions under Section 80C and Section 80CCD(1B).
2. Tier-II Account
- Purpose: This is a voluntary savings account, which provides liquidity and flexibility.
- Withdrawals: Unlimited withdrawals are allowed.
- Tax Benefits: No tax benefits are available for contributions to this account.
NPS Login
To open an NPS account, subscribers can visit the NPS Trust website and register by providing personal and bank details. They can also choose a fund manager and select their investment preferences. Subscribers are given a Permanent Retirement Account Number (PRAN) to manage their account and make contributions. Subscribers can log in to their NPS account to check their balance, view transactions, and make contributions.
Rules of NPS
The NPS has certain rules and regulations that subscribers must follow:
- Regular Contributions: Subscribers must contribute regularly to their NPS account to avoid penalties.
- Updated Information: Subscribers must keep their contact details and bank account information up to date to ensure timely pension payments.
Advantages of NPS
- Long-term Savings: The NPS encourages long-term savings for retirement, which is crucial for a secure financial future.
- Tax Benefits: Contributions to the NPS offer tax benefits, making it an attractive option for tax-efficient savings.
- Low Cost: The NPS has a low annual maintenance charge, ensuring more of the investor's money is invested in underlying assets.
- Flexibility: Subscribers can choose their fund manager, investment preferences, and contribution amounts to meet their unique requirements.
- Portability: NPS accounts are easily transferable between fund managers and sectors, providing flexibility in managing investments.
Disadvantages of NPS
- Compulsory Annuity: Subscribers must use at least 40% of the accumulated corpus to purchase an annuity upon retirement, limiting control over retirement income.
- Taxation of Withdrawals: While contributions are eligible for tax benefits, withdrawals from the NPS are taxable, reducing overall returns.
- Market Risk: NPS investments are subject to market risk, as funds are invested in a mix of equity, debt, and government securities.
- Limited Liquidity: The NPS is a long-term investment option, with limited withdrawal options before the age of 60, except in certain emergencies.
Conclusion
The National Pension System is a popular retirement savings option in India, offering a low-cost, flexible, and tax-efficient way to build a retirement fund. While there are certain disadvantages, such as compulsory annuity and market risk, the advantages of the scheme make it a good option for long-term retirement planning. As always, investors should carefully consider their investment goals and risk tolerance before investing in any financial instrument, including the National Pension System.
Learn more about financial insights with Swastika Investmart. JOIN NOW!

Why Swastika Investmart Could Be Your Perfect Stockbroker Partner
Are you ready to dive into the exciting world of stock market investing? According to SEBI requirements, all stock market trades must be placed through a Member of the Exchange - a stock brokerage company. A brokerage house, often known as a broker, is an institution that acts as an intermediary in transactions involving securities such as stocks, mutual funds, ETFs, and others. A top stockbroker will assist you with transactions, provide investment advice, tax-saving ideas, retirement planning guidance, and asset management services. They will walk you through all of the steps required to invest in the stock market.
About Our Share Broking Services
Swastika Investmart is one of India's major full-service stock brokerage firms, serving individual and institutional clients across all capital market categories. Swastika has a strong research staff, a powerful digital trading platform Justrade 2.0, and a vast branch network and franchisee base that helps it to conduct thousands of secondary market deals every day.
Swastika offers a wide range of services, including mutual funds, a wide range of choices for investing in stocks, and derivatives (stocks, commodities, and currencies). Additionally, it provides investment banking services, funding for margin trades, and third-party products like insurance.
Swastika has around 3 lakh accounts for customers and 80+ branches located all over India. It is a SEBI-registered entity that is registered with the Bombay Stock Exchange (BSE) and the National Stock Exchange (NSE). We are also a depository participant with National Securities Depository Limited (NSDL) and Central Depository Services Limited (CDSL).
Why Swastika?
1. Wide Variety of Investment Options
Swastika Investmart offers clients the choice to invest in a wide range of securities, including stocks, bonds, ETFs, futures, options, and real estate investment trusts. Even if you simply want to trade stocks for the time being, you should still think about the prospect of trading other assets in the future. Your brokerage business should be able to give you information on all of these options.
2. Portfolio Management Services
As a stock market beginner, it might be difficult for you to know which stocks to buy or sell. An online stockbroker that provides Portfolio Management Services with expert assistance is the perfect solution to your problems. Swastika Investmart offers comprehensive portfolio management to help you make investment decisions and achieve good returns in the stock market.
3. Research Advice
A top stockbroker in India should provide a wide range of recommendations, including investing and diversification suggestions, retirement plans, and tax-saving strategies. Swastika Investmart offers valuable research advice, making it easier for you to trade in the stock market with confidence. The more time you are ready to devote to research, the easier it will be for you to make decisions.
4. 24/7 Customer Support
Even experienced investors require assistance at times, so it is critical to select a stockbroker that provides excellent customer support. Swastika Investmart's support team is available 24/7, ensuring that you get help whenever you need it. The helpdesk picks your call in just three rings, making Swastika stand out among the best stockbrokers in India.
5. PAN India Presence
If you prefer physical locations for your trading activities, you should select a stockbroking firm with a large number of branches throughout India. Swastika Investmart has over 80 branches across India, making it one of the best stockbrokers with a strong physical presence.
6. Personalized Relationship Manager
Swastika Investmart provides you with a personalized relationship manager to guide you through your trades. This personal touch ensures that you have dedicated support for your investment needs.
7. Swastika App
Swastika Investmart offers the Swastika App , providing the best trading experience with cutting-edge technology. This Indian stock market trading app is suitable for both traders and newbies, and it is simple to use and free.
Making the Choice
Choosing a stockbroker is a big decision. With Swastika Investmart, you get a comprehensive package: a broad range of investment options, expert advice, exceptional customer service, and a user-friendly platform. If you're looking for a reliable partner to help you achieve your financial goals, Swastika Investmart is definitely worth considering.
Join us today for smarter investing!
Top 10 Companies in India by Market Capitalization
Market capitalization, or market cap, is a key indicator of a company's size and value in the stock market. It is calculated by multiplying the current share price by the total number of outstanding shares. In India, several companies stand out due to their substantial market caps, showing their significant influence and stability in the market. The Indian stock market is a powerhouse in Asia, and several domestic companies have grown into global giants.
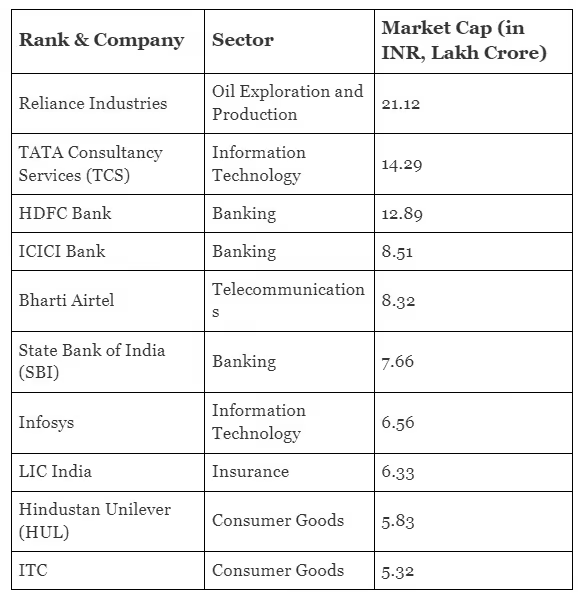
Here, we look at the top 10 companies in India by market capitalization as on 29 june 2024
1. Reliance Industries:
Leading the pack is Reliance Industries, a conglomerate with fingers in many pies Led by Mukesh Ambani, is the largest company in India by market capitalization. The conglomerate operates across various sectors including petrochemicals, refining, oil, and gas exploration. It has also made significant inroads into telecommunications and retail.
2. Tata Consultancy Services (TCS):
Ever wondered how businesses manage their IT needs? Tata Consultancy Services (TCS) is a leading IT services, business solutions, and consulting firm headquartered in Mumbai. It ranks among the global leaders in the IT services segment, providing a wide range of technology and digital transformation services. It provides solutions for businesses of all sizes, making it a valuable partner in today's digital age.
3. HDFC Bank:
HDFC Bank is a household name in India, known for its stability and reliability in the financial sector. They offer a wide range of banking products and services, making them a one-stop shop for all your financial needs. It is known for its strong customer base and a wide range of banking and financial services. It has consistently demonstrated stability and growth in the financial sector.
4. ICICI Bank:
Another major private bank in India, ICICI Bank caters to a wide range of customers, offering banking products and financial services. They're known for their innovative approach to banking. They have a significant presence in both retail and corporate banking.
5. Bharti Airtel
Bharti Airtel is a prominent telecommunications company in 18 countries across Asia and Africa. It offers mobile voice and data services, fixed lines, high-speed broadband, IPTV, DTH, and enterprise services. Bharti Airtel's market valuation indicates its strong network and wide customer base.
6. State Bank of India (SBI):
SBI, India's largest public sector bank, offers a comprehensive suite of banking products and services. They play a vital role in the financial landscape of the country. They have a vast network of branches and a strong presence across the country.
7. Infosys:
Another IT powerhouse, Infosys helps businesses navigate the ever-evolving digital landscape.They , offer consulting and next-generation digital services. The company aims to help clients navigate their digital transformation journeys. Infosys recently joined the $100 billion market cap club, reflecting its robust growth and market presence.
8. Life Insurance Corporation of India (LIC):
Life Insurance Corporation of India (LIC) is India's biggest public insurance company. Besides general insurance, LIC also deals in mutual funds, asset management, exchange trades, and index funds.
9. Hindustan Unilever (HUL)
Hindustan Unilever, an Indian consumer goods company, is a subsidiary of the British-Dutch company Unilever. Its diverse portfolio includes cleaning agents, water purifiers, and personal care products. The market valuation of Hindustan Unilever reflects its strong brand portfolio and wide consumer base.
10. ITC
ITC is a multi-business conglomerate with a diverse portfolio, including FMCG, hotels, paperboards and packaging, agri-business, and information technology. The market valuation of ITC is a reflection of its strong brand presence and diverse operations.
Source: https://www.forbesindia.com/article/explainers/top-10-companies-india-market-valuation/86307/1
Conclusion-
These top 10 companies by market capitalization in India showcase the strength and diversity of the Indian economy. From energy and banking to IT and consumer goods, they represent key sectors driving the country's growth. Their substantial market valuations highlight their stability, innovation, and influence in both domestic and global markets. As India continues its economic expansion, these companies are expected to play a crucial role in shaping the nation's financial and industrial future.
.avif)
Types of Derivatives
Introduction to Derivatives
Derivatives are financial instruments whose value is derived from the performance of an underlying asset, index, or rate. These instruments are essential in financial markets for purposes such as hedging risk, speculating on future price movements, and arbitraging price discrepancies. In India, the derivatives market has seen substantial growth, with the National Stock Exchange (NSE) reporting an average daily turnover of ₹52.8 trillion in FY2022-23. Derivatives can be broadly categorized into two types based on their payoff structure: linear and non-linear derivatives. Let's explore these in simple terms.
Linear Derivatives
Linear derivatives have a straightforward, direct relationship with the price of the underlying asset. Their value changes proportionally with the changes in the underlying asset's price. The two main types of linear derivatives are futures and forwards.
Forward Contracts
What Are Forward Contracts?
Forward contracts are customized agreements between two parties to buy or sell an asset at a specified future date for a price agreed upon today. These contracts are traded over-the-counter (OTC), meaning they are negotiated directly between the parties involved and not on an exchange.
Key Characteristics of Forward Contracts
- Customization: Forward contracts can be tailored to fit the specific needs of the parties involved, including the quantity of the asset, the price, and the delivery date.
- OTC Trading: These contracts are not standardized and are traded OTC, which can introduce counterparty risk.
- Settlement: Forward contracts can be settled either by physical delivery of the asset or by cash settlement.
How They Work: Imagine you and a farmer agree that you will buy 1,000 kg of wheat at ₹25 per kg in six months. This contract is tailor-made to your needs.
Example: If the market price of wheat rises to ₹28 per kg, your forward contract has increased in value because you can buy at the lower price of ₹25.
Use Cases: Forwards are used for the same reasons as futures but offer more flexibility in terms of contract size and settlement dates.
Benefits of Forward Contracts
- Customization: Forward contracts can be tailored to the exact specifications of the buyer and seller.
- Hedging: They are often used to hedge against the risk of price fluctuations in the underlying asset.
- Simplicity: Forward contracts are straightforward agreements without the need for an intermediary.
Risks of Forward Contracts
- Counterparty Risk: There is a risk that one party may default on the agreement.
- Liquidity Risk: Forward contracts are less liquid because they are not traded on an exchange.
- Market Risk: Changes in the market value of the underlying asset can lead to significant losses.
Futures Contracts
What Are Futures Contracts?
Futures contracts are standardized agreements to buy or sell a specific quantity of an asset at a predetermined price on a specified future date. Unlike forward contracts, futures are traded on organized exchanges.
Key Characteristics of Futures Contracts
- Standardization: Futures contracts are standardized in terms of quantity, quality (if applicable), and delivery date.
- Exchange-Traded: Futures are traded on exchanges, such as the National Stock Exchange (NSE) and the Bombay Stock Exchange (BSE), providing liquidity and transparency.
- Margin Requirements: Traders are required to post an initial margin to enter a futures contract and maintain a maintenance margin. If the account falls below this level, a margin call is issued.
- Mark-to-Market: Futures contracts are marked to market daily, meaning gains and losses are settled at the end of each trading day based on the current market price.
Types of Futures Contracts
Equity Futures
Equity futures involve buying or selling individual stocks at a future date and at a predetermined price. These contracts are used for speculation and hedging purposes. India's equity futures market is one of the largest in the world, with the NSE's Nifty 50 index futures being highly popular among traders.
- Example: If an investor expects the price of Infosys stock to increase, they might buy Infosys futures contracts. If the price rises as anticipated, they can profit by buying the stock at the lower futures price and selling it at the higher market price.
Currency Futures
Currency futures are contracts that involve the exchange rate of currency pairs such as USD/INR, EUR/INR, and GBP/INR. These contracts help manage currency risk for businesses and enable currency speculation. The USD/INR futures are among the most traded currency futures in the Indian market.
- Example: A company importing goods from the US might use USD/INR futures to lock in a favourable exchange rate, protecting against adverse currency movements.
Commodity Futures
Commodity futures involve contracts for physical goods such as agricultural products (wheat, sugar), metals (gold, silver), and energy products (crude oil, natural gas). India has a robust commodity futures market, with gold and crude oil futures being particularly active.
- Example: A farmer might use wheat futures to lock in a price for their upcoming harvest, ensuring stability amidst price fluctuations.
How They Work: Suppose you agree to buy 100 shares of Reliance Industries in three months at ₹2,000 per share. Regardless of the market price at that time, you will buy them at ₹2,000 per share.
- Example: If the price of Reliance Industries rises to ₹2,200 per share, your futures contract has increased in value because you can buy at the lower, agreed-upon price of ₹2,000.
- Use Cases: Futures are used by investors to lock in prices and avoid market volatility and by traders to speculate on the direction of market prices.
Benefits of Trading Futures
- Leverage: Futures contracts allow traders to control large positions with a relatively small amount of capital.
- Liquidity: Many futures markets are highly liquid, facilitating easy entry and exit from positions.
- Price Discovery: Futures markets contribute to the efficient determination of the price of the underlying asset.
- Hedging: Futures provide a mechanism for hedging risk against adverse price movements in the underlying asset.
Risks of Trading Futures
- Leverage Risk: While leverage can boost gains, it can also magnify losses.
- Market Risk: Unfavorable price movements can lead to significant losses.
- Margin Risk: If the market moves against a position, traders may be required to deposit additional margin.
- Liquidity Risk: In less liquid markets, it may be difficult to enter or exit positions without affecting the market price.
Options Contracts
What Are Options Contracts?
Options are contracts that provide the buyer the right, but not the obligation, to buy or sell an underlying asset at a predetermined price before or at the contract's expiration. There are two main types of options: call options and put options.
Key Characteristics of Options Contracts
- Premium: The price paid by the buyer to the seller for the option contract.
- Strike Price: The predetermined price at which the underlying asset can be bought (call) or sold (put).
- Expiration Date: The date by which the option must be exercised or it becomes worthless.
- Intrinsic Value: The difference between the underlying asset's price and the strike price, if favorable to the option holder.
Types of Options and Positions
Options are versatile financial instruments that give traders and investors the right, but not the obligation, to buy or sell an asset at a predetermined price (strike price) within a specified time frame (expiry date). They are widely used in the Indian stock market for various trading and hedging strategies. Let's explore the main types of options and positions available:
Types of Options
- Call Options
Call options give the holder the right to buy an underlying asset at a specified price (strike price) on or before the expiration date.
- Buyer's Position: The buyer of a call option pays a premium to acquire the right to buy the underlying asset. They profit if the price of the asset rises above the strike price plus the premium paid.
- Seller's Position (Writer): The seller (writer) of a call option receives the premium but takes on the obligation to sell the underlying asset if the buyer exercises the option. They profit if the asset price remains below the strike price.
2. Put Options
Put options give the holder the right to sell an underlying asset at a specified price (strike price) on or before the expiration date.
- Buyer's Position: The buyer of a put option pays a premium to acquire the right to sell the underlying asset. They profit if the price of the asset falls below the strike price minus the premium paid.
- Seller's Position (Writer): The seller (writer) of a put option receives the premium but takes on the obligation to buy the underlying asset if the buyer exercises the option. They profit if the asset price remains above the strike price.
Types of Positions
- Long Position
Traders hold a long position when they purchase a call or put option.
- Long Call: Profits if the price of the underlying asset rises above the strike price plus the premium paid.
- Long Put: Profits if the price of the underlying asset falls below the strike price minus the premium paid.
2. Short Position
A trader holds a short position when they sell (write) a call or put option.
- Short Call: Profits if the price of the underlying asset remains below the strike price, resulting in the option expiring worthless.
- Short Put: Profits if the price of the underlying asset remains above the strike price, resulting in the option expiring worthless.
Benefits of Trading Options
- Flexibility: Options can be used for various strategies, including hedging, speculation, and income generation.
- Limited Risk for Buyers: The maximum loss for an option buyer is limited to the premium paid.
- Leverage: Options allow traders to control a large position with a relatively small amount of capital.
Risks of Trading Options
- Complexity: Options trading requires a deep understanding of various strategies and their implications.
- Time Decay: The value of options erodes as they approach expiration, impacting long positions.
- Unlimited Risk for Sellers: Sellers (writers) of options face potentially unlimited losses, especially for uncovered (naked) positions.
Non-linear Derivatives
Non-linear derivatives refer to financial instruments whose value does not move in a straightforward linear manner with changes in the price of the underlying asset. Unlike linear derivatives such as forwards or futures, where the payoff is directly proportional to the price movement of the underlying asset, non-linear derivatives exhibit more complex payoffs that may include options, swaps, and more specialized structures. Here are some common types of non-linear derivatives:
Swap Contracts
What Are Swap Contracts?
Swaps are contracts in which two parties agree to exchange cash flows or other financial instruments over a specified period. The most common types of swaps are interest rate swaps, currency swaps, and commodity swaps. India's swap market, though not as large as its Western counterparts, has been growing steadily, with interest rate swaps being particularly prevalent among financial institutions.
Key Characteristics of Swap Contracts
- Customization: Swaps are usually customized contracts tailored to the specific needs of the parties involved.
- Over-the-Counter (OTC): Swaps are typically traded OTC, meaning they are negotiated directly between parties rather than on an exchange.
- Counterparty Risk: The risk that the other party in the swap agreement will default on their obligations.
Types of Swaps
- Interest Rate Swaps: This involves exchanging fixed interest rate payments for floating rate payments (or vice versa).
- Currency Swaps: Involves exchanging principal and interest payments in one currency for principal and interest payments in another currency.
- Commodity Swaps: Involves exchanging cash flows related to commodity prices, such as oil or gold.
Benefits of Trading Swaps
- Customization: Swaps can be tailored to meet the specific needs of the parties involved.
- Hedging: Swaps provide an effective way to hedge against interest rate risk, currency risk, and commodity price risk.
- Flexibility: Swaps offer a wide range of structures and terms to suit different financial strategies.
Risks of Trading Swaps
- Counterparty Risk: The risk that the other party will default on their obligations.
- Complexity: Swaps can be complex and require careful management and understanding.
- Market Risk: Changes in market conditions can impact the value of swap positions.
Conclusion
Derivatives, including forward contracts, futures contracts, options contracts, and swap contracts, play a crucial role in modern financial markets. They provide tools for hedging risk, speculating on future price movements, and capitalizing on hedging opportunities. Understanding the mechanics, benefits, and risks associated with each type of derivative is essential for anyone looking to engage in derivative trading. In India, the National Stock Exchange (NSE) and the Bombay Stock Exchange (BSE) are key players in the derivatives market, offering a wide range of derivative products. As with any financial instrument, thorough research, risk management, and a deep understanding of the underlying asset and market conditions are vital to successful trading in derivatives markets.
Big Budget


Popular Articles




.avif)
.avif)

.avif)



START YOUR INVESTMENT JOURNEY
Get personalized advice from our experts
- Dedicated RM Support
- Smooth and Fast Trading App
