


Nifty 50 31 Jul 2026 Morning Market Summary


Key Takeaways
- Prev session close reference: Nifty 50 Pivot 24370.9; R1 24442.1; R2 24500.6; S1 24312.4; S2 24241.2.
- Standout mover: TRANSPEK from 1101.1 -> 1321.3 (+20.00%).
- Biggest loser: NARMADA from 36.19 -> 17.02 (-52.97%).
- Market-wide Index Options PCR: Not available for this session.
Nifty 50 Support And Resistance Levels For 31 Jul 2026
Pivot: 24370.9; R1: 24442.1; R2: 24500.6; S1: 24312.4; S2: 24241.2. The Pivot is the central reference; R1 and R2 above are resistance hurdles, while S1 and S2 below are cushions. All these numbers come from yesterday's close as the basis for today's session.
In plain language, if the price sits above R1, the near-term tone is mildly bullish; above R2, the bias could extend higher; if it slips below S2, the bias could turn bearish. For deeper stock-level insights, Swastika's Sarthi AI stock assistant.
Nifty Bank Pivot Levels For 31 Jul 2026
Pivot: 57271.9; R1: 57404.2; R2: 57543.55; S1: 57132.55; S2: 57000.25. Those levels mirror the same logic as Nifty 50 for the Bank Nifty.


Top 5 Gainers (31 Jul 2026 Session, EQ Series, Liquid Names Only)
| Ticker | From | To | Change |
|---|---|---|---|
| TRANSPEK | 1101.1 | 1321.3 | (+20.00%) |
| UEL | 128.11 | 153.73 | (+20.00%) |
| YASHO | 3215.6 | 3858.7 | (+20.00%) |
| RSDFIN | 92.29 | 110.74 | (+19.99%) |
| DCI | 276.75 | 329.7 | (+19.13%) |
Top 5 Losers (31 Jul 2026 Session, EQ Series, Liquid Names Only)
| Ticker | From | To | Change |
|---|---|---|---|
| NARMADA | 36.19 | 17.02 | (-52.97%) |
| EXPLEOSOL | 906.6 | 802.85 | (-11.44%) |
| THANGAMAYL | 5807.0 | 5226.5 | (-10.00%) |
| ASIANTILES | 60.71 | 54.68 | (-9.93%) |
| SIGNPOST | 311.2 | 283.55 | (-8.88%) |
Market-Wide Index Options PCR
Market-wide Index Options PCR: Not available for this session.
Frequently Asked Questions
Nifty 50 Support and Resistance Levels for 31 Jul 2026
Pivot 24370.9; R1 24442.1; R2 24500.6; S1 24312.4; S2 24241.2. These are reference points for today's trading, derived from yesterday's close.
Nifty Bank Pivot Levels for 31 Jul 2026
Pivot 57271.9; R1 57404.2; R2 57543.55; S1 57132.55; S2 57000.25. These are yesterday's close-based reference levels for today.
Top Gainers on 31 Jul 2026
TRANSPEK: 1101.1 -> 1321.3 (+20.00%); UEL: 128.11 -> 153.73 (+20.00%); YASHO: 3215.6 -> 3858.7 (+20.00%); RSDFIN: 92.29 -> 110.74 (+19.99%); DCI: 276.75 -> 329.7 (+19.13%).
Top Losers on 31 Jul 2026
NARMADA: 36.19 -> 17.02 (-52.97%); EXPLEOSOL: 906.6 -> 802.85 (-11.44%); THANGAMAYL: 5807.0 -> 5226.5 (-10.00%); ASIANTILES: 60.71 -> 54.68 (-9.93%); SIGNPOST: 311.2 -> 283.55 (-8.88%).
PCR for Market-wide Index Options today
Market-wide Index Options PCR: Not available for this session.
Conclusion
Yesterday's close reference levels set the stage for today's open. Nifty 50 pivot at 24370.9 with R1 24442.1 and R2 24500.6; S1 24312.4; S2 24241.2. The standout mover TRANSPEK posted a 20% gain while NARMADA slid 52.97% from 36.19 to 17.02. Market-wide Index Options PCR remains not available for this session. Watch how price interacts with the pivot and resistance/support on open, and consider exploring deeper stock-level insights with Swastika's Sarthi AI stock assistant.
Open your trading and demat account here
Reference :
1 : Nseindia
Latest Articles

Understanding Ex Dividends in the Indian Share Market


Dividends are a way for companies to share their profits with people who own their stock. But to receive a dividend pay-out, timing is key. Let’s break down what dividends are and the important dates you need to know if you're investing in the Indian stock market.
What is a Dividend?
A dividend is a payment made by a company to its shareholders from its profits. When a company grows and decides to go public, it allows people to buy its shares through an Initial Public Offering (IPO). Once people buy shares, they become shareholders and can receive dividends from the company’s profits. These payments are often made regularly, such as every three months or once a year.
What is the Ex-Dividend Date?
The ex-dividend date is an important date for anyone buying stocks. It’s the deadline by which you must own the stock to get the next dividend payment. If you buy the stock on or after this date, you won't get the upcoming dividend; the previous owner will.
- Understanding the Ex-Dividend Date: This is the first business day after which new stock buyers become ineligible for the upcoming dividend pay-out.
- The Deadline: If you purchase a stock before the ex-dividend date, you'll be included in the company's record of shareholders who receive the dividend.
- Buying After the Ex-Dividend Date? No Dividend for You: Purchasing shares on or after the ex-dividend date means you won't be eligible for the upcoming pay-out. The seller in this case will receive the dividend.
So in simple words, If you purchase a stock before the ex-dividend date, you're considered a shareholder of record. This means you'll be entitled to receive the next dividend pay-out.
If you buy the stock on or after the ex-dividend date, you won't be eligible for the upcoming dividend. The seller in this case will receive the pay-out.
How it Affects Share Prices
When a stock goes ex-dividend, its price usually drops by the amount of the dividend. For example, if a company pays a ₹10 dividend and the stock price was ₹1000, it might drop to ₹990 on the ex-dividend date. This drop happens because the dividend is no longer included in the stock price.
Difference between the Ex-Dividend Date and the Record Date
- Ex-Dividend Date: The last day you can buy the stock to be eligible for the next dividend. If you buy the stock on or after this date, you won’t get the next dividend.
- Record Date: The date the company checks its records to see who owns the stock and is eligible for the dividend. To be on this list, you need to have bought the stock before the ex-dividend date due to the two-day settlement period (T+2).
Key Dates for Dividends
There are three key dates to remember when it comes to dividends:
- Ex-Dividend Date: The last day to buy the stock to get the next dividend.
- Record Date: The day the company looks at its records to see who gets the dividend.
- Payment Date: The day the company actually pays out the dividend to shareholders.
Conclusion
Knowing about dividends and the important dates can help you make better decisions when investing in stocks. The date is especially important because it determines whether you get the next dividend payment. By keeping track of these dates, you can manage your investments more effectively.

Understanding Dividends in the Indian Share Market
Dividends are a way for companies to share their profits with people who own their stock. But to receive a dividend pay-out, timing is key. Let’s break down what dividends are and the important dates you need to know if you're investing in the Indian stock market.
What is a Dividend?
A dividend is a payment made by a company to its shareholders from its profits. When a company grows and decides to go public, it allows people to buy its shares through an Initial Public Offering (IPO). Once people buy shares, they become shareholders and can receive dividends from the company’s profits. These payments are often made regularly, such as every three months or once a year.
What is the Ex-Dividend Date?
The ex-dividend date is an important date for anyone buying stocks. It’s the deadline by which you must own the stock to get the next dividend payment. If you buy the stock on or after this date, you won't get the upcoming dividend; the previous owner will.
- Understanding the Ex-Dividend Date: This is the first business day after which new stock buyers become ineligible for the upcoming dividend pay-out.
- The Deadline: If you purchase a stock before the ex-dividend date, you'll be included in the company's record of shareholders who receive the dividend.
- Buying After the Ex-Dividend Date? No Dividend for You: Purchasing shares on or after the ex-dividend date means you won't be eligible for the upcoming pay-out. The seller in this case will receive the dividend.
So in simple words, If you purchase a stock before the ex-dividend date, you're considered a shareholder of record. This means you'll be entitled to receive the next dividend pay-out.
If you buy the stock on or after the ex-dividend date, you won't be eligible for the upcoming dividend. The seller in this case will receive the pay-out.
How it Affects Share Prices
As an example, a company that is trading at 60 per share declares a 2 dividend on the announcement date. As the news becomes public, the share price may increase by 2 and hit 62.
If the stock trades at 63 one business day before the ex-dividend date. On the ex-dividend date, it's adjusted by 2 and begins trading at 61 at the start of the trading session on the ex-dividend date, because anyone buying on the ex-dividend date will not receive the dividend.
Difference between the Ex-Dividend Date and the Record Date
- Ex-Dividend Date: The last day you can buy the stock to be eligible for the next dividend. If you buy the stock on or after this date, you won’t get the next dividend.
- Record Date: The date the company checks its records to see who owns the stock and is eligible for the dividend. To be on this list, you need to have bought the stock before the ex-dividend date due to the two-day settlement period (T+2).
Key Dates for Dividends
There are three key dates to remember when it comes to dividends:
- Ex-Dividend Date: The last day to buy the stock to get the next dividend.
- Record Date: The day the company looks at its records to see who gets the dividend.
- Payment Date: The day the company actually pays out the dividend to shareholders.
Conclusion
Knowing about dividends and the important dates can help you make better decisions when investing in stocks. The date is especially important because it determines whether you get the next dividend payment. By keeping track of these dates, you can manage your investments more effectively.
.avif)
Types of Orders
What Is an Order?
An order is an instruction given to a broker or brokerage firm to buy or sell a security for an investor. It's the basic way to trade in the stock market. Orders can be placed by phone, online, or through automated systems and algorithms. Once an order is placed, it goes through a process to be completed.
There are different types of orders, allowing investors to set conditions like the price at which they want the trade to happen or how long the order should stay active. These conditions can also determine whether an order is triggered or cancelled based on another order.
Types of Orders
Market Order
A market order is an instruction to buy or sell a stock at the current price available in the market. With a market order, the investor doesn't control the exact price they pay or receive—the market decides the price. In a fast-moving market, the price can change quickly, so you might end up paying more or receiving less than expected.
For example, if an investor wants to buy 100 shares of a stock, they will get those 100 shares at whatever the current asking price is at that moment. If the price is ₹500 per share, they’ll buy 100 shares for ₹500 each. However, if the price changes before the order is executed, they might pay a different amount.
Limit Order
A limit order is an instruction to buy or sell a stock at a specific price or better. This allows investors to avoid buying or selling at a price they don't want. If the market price doesn't match the price set in the limit order, the trade won't happen. There are two types of limit orders: a buy limit order and a sell limit order.
Buy Limit Order:
A buy limit order is placed by a buyer, specifying the maximum price they are willing to pay. For example, if a stock is currently priced at ₹900, and an investor sets a buy limit order for ₹850, the order will only go through if the stock price drops to ₹850 or low
Sell Limit Order:
A sell limit order is placed by a seller, specifying the minimum price they are willing to accept. For example, if a stock is currently priced at ₹900, and an investor sets a sell limit order for ₹950, the order will only go through if the stock price rises to ₹950 or higher.
Stop Order
A stop order, also known as a stop-loss order, is a trade order that helps protect an investor from losing too much money on a stock. It automatically sells the stock when its price drops to a certain level. While stop orders are commonly used to protect a long position (where the investor owns the stock), they can also be used with a short position (where the investor has sold a stock they don't own yet). In that case, the stock would be bought if its price rises above a certain level.
Example for a Long Position:
Imagine an investor owns a stock currently priced at ₹1,000. They're worried the price might drop, so they place a stop order at ₹800. If the stock price falls to ₹800, the stop order will trigger, and the stock will be sold. However, the stock might not sell exactly at ₹800—it could be sold for less if the price is dropping quickly.
Example for a Short Position:
If an investor has shorted a stock at ₹1,000 and doesn't want to lose too much if the price rises, they might set a stop order at ₹1,200. If the price goes up to ₹1,200, the stop order will trigger, and the investor will buy the stock at that price (or higher if the price is rising quickly) to cover their short position.
To avoid selling at a much lower price than expected, investors can use a stop-limit order, which sets both a stop price and a minimum price at which the order can be executed.
Stop-limit order
A stop-limit order is a trade order that combines features of both a stop order and a limit order. It involves setting two prices: the stop price and the limit price. When the stock reaches the stop price, the order becomes a limit order. This means the stock will only be sold if it can meet or exceed the limit price, giving the investor more control over the selling price.
Example:
Let's say an investor owns a stock currently priced at ₹2,500. They want to sell the stock if the price drops below ₹2,000, but they don't want to sell it for less than ₹1,900. To do this, the investor sets a stop-limit order with a stop price of ₹2,000 and a limit price of ₹1,900.
If the stock price falls to ₹2,000, the stop order triggers, but the stock will only be sold if it can get at least ₹1,900 per share. If the price drops too quickly and falls below ₹1,900 before the order can be executed, the stock won’t be sold until it reaches ₹1,900 or higher.
In contrast, a regular stop order would sell the stock as soon as it hits ₹2,000, even if the price continues to fall rapidly and ends up selling for less. The stop-limit order gives the investor more control over the price, but there’s a chance the stock won’t sell if the limit price isn’t met.
Trailing stop order
A trailing stop order is a type of stop order that adjusts automatically based on the stock's price movement. Instead of setting a specific price, the trailing stop is based on a percentage change from the stock's highest price. This helps protect profits while allowing the stock to rise in value. If the stock's price falls by the set percentage, the order is triggered and the stock is sold.
Example for a Long Position:
Imagine an investor buys a stock at ₹1,000 and sets a trailing stop order with a 20% trail. If the stock price goes up to ₹1,200, the trailing stop will automatically move up to ₹960 (20% below ₹1,200). If the stock price then drops to ₹960 or lower, the trailing stop order will trigger, and the stock will be sold.
Example for a Short Position:
If an investor has shorted a stock at ₹1,000 and sets a trailing stop of 10%, the stop price would move down as the stock price falls. If the stock price rises by 10% from its lowest point, the trailing stop order will trigger, and the stock will be bought to cover the short position.
The trailing stop order allows the investor to lock in gains as the stock price moves favorably, while still providing protection if the market turns.
Immediate or Cancel (IOC) order
An Immediate or Cancel (IOC) order is a type of stock order that must be executed immediately. If the full order cannot be filled right away, whatever portion can be filled will be completed, and the rest will be canceled. If no part of the order can be executed immediately, the entire order is canceled.
Example:
Suppose an investor places an IOC order to buy 500 shares of a stock at ₹1,000 per share. If only 300 shares are available at ₹1,000 right away, the IOC order will purchase those 300 shares, and the remaining 200 shares will be canceled. If no shares are available at ₹1,000 immediately, the entire order will be canceled.
Good Till Cancelled (GTC) order
A Good Till Cancelled (GTC) order is a type of stock order that stays active until you choose to cancel it. Unlike other orders that expire at the end of the trading day, a GTC order remains open until you either cancel it or it gets executed. However, most brokerages set a limit on how long you can keep a GTC order open, usually up to 90 days.
Example:
Let's say an investor wants to buy a stock at ₹500, but the current price is ₹600. They place a GTC order to buy 100 shares at ₹500. This order will stay active until the stock price drops to ₹500 and the order is filled, or until the investor cancels the order. If the price never drops to ₹500 and the investor doesn't cancel the order, it will automatically expire after 90 days (or whatever time limit the brokerage sets).
Good 'Till Triggered (GTT) order
A Good 'Till Triggered (GTT) order is similar to a Good 'Til Canceled (GTC) order but with a key difference: a GTT order only becomes active when a specified trigger condition is met. Once the trigger price is reached, the order is placed in the market. If the trigger price is not reached, the order stays inactive.
Example:
Imagine an investor wants to buy a stock currently priced at ₹600, but only if it drops to ₹550. They set a GTT order with a trigger price of ₹550. If the stock price falls to ₹550, the order is activated and placed in the market. If the price never drops to ₹550, the order remains inactive until it reaches the trigger price or the investor cancels it.
GTT orders can also have a time limit, so if the trigger price isn’t reached within a certain period, the order will expire.
Conclusion
In the stock market, an order is a fundamental instruction to buy or sell a security, tailored to an investor's strategy and market conditions. The various types of orders—such as market, limit, stop, stop-limit, trailing stop, IOC, GTC, and GTT—offer flexibility to manage price, timing, and risk. Understanding these order types empowers investors to execute trades more effectively, ensuring alignment with their financial goals and risk tolerance.
Learn how to optimize your trades and manage risk with Swastika!

Understanding Long Strangles
The stock market can be unpredictable, and sometimes you might have a feeling that a stock's price will move significantly, but you're unsure if it will go up or down. This is where the long strangle strategy comes in.
The long strangle can be a valuable strategy for options traders who anticipate high volatility but are unsure of the price direction. However, it's important to understand the risks involved, including limited profit potential and the possibility of losing your entire investment.
What is a Long Strangle?
A long strangle is an options trading strategy that helps investors make money when they expect a big price move in a stock but aren't sure which direction it will go. This strategy involves buying two options: a call option and a put option with different strike prices. Both options are out-of-the-money, meaning they are not yet profitable at the current stock price.
Both call and put options are out-of-the-money (OTM), meaning their strike prices are above (for calls) or below (for puts) the current market price of the underlying asset.
Why Use a Long Strangle?
- Profit from Volatility: This strategy aims to benefit from a large price movement in the underlying asset, regardless of the direction (up or down).
- Lower Cost: Compared to a straddle, long strangles are generally less expensive because OTM options cost less than at-the-money (ATM) options used in straddles.
Example (using INR):
Imagine Nifty is at 10,400 and you expect an important price swing but are unsure of the direction. You can create a long strangle by:
- Buying a Nifty call option with a strike price of ₹10,600 (OTM call).
- Buying a Nifty put option with a strike price of ₹10,200 (OTM put).
Key Points:
- The net cost you pay for both options is your maximum loss.
- You'll potentially make a profit if the Nifty price moves above ₹10,600 (call strike + premium) or below ₹10,200 (put strike - premium).
Here's a table summarizing the profit and loss potential:

Break-even Points:
A long strangle has two break-even points:
- Lower Break-even Point: Strike price of Put - Net Premium
- Upper Break-even Point: Strike price of Call + Net Premium
The stock price needs to move beyond these break-even points for you to start making a profit.
Risks to Consider:
- Limited Profit Potential: a long strangle has a limited profit potential capped by the strike prices and volatility.
- Losing Your Investment: If the stock price ends up between the strike prices at expiration, you lose your entire investment (net debit).
When to Use a Long Strangle:
- High Volatility Expected: This strategy is suitable when you predict significant price changes in the underlying asset due to events like elections, policy changes, or earnings announcements.
Steps to Execute a Long Strangle:
- Choose the Underlying Asset: Select a stock or index where you expect an important price movements but are unsure of the direction.
- Pick OTM Strike Prices: Choose strike prices for both call and put options that are OTM but allow for enough price movement in either direction.
- Calculate Total Cost: Determine the combined cost of buying both options, including fees and commissions.
- Place Your Orders: Place buy orders for the chosen call and put options with specific expiration dates and strike prices. Make sure that you have sufficient funds in your brokerage account.
Conclusion:
The long strangle can be a valuable strategy for options traders who predict high volatility but are unsure of the price direction. However, it's crucial to understand the risks involved, including limited profit potential and the possibility of losing your entire investment.
Learn more about financial terminologies with Swastika!

What is a Bear Put Spread?
Options trading offers various strategies to maximize returns and minimize risks. One common strategy is the bear put spread, which helps investors profit from a gradual decline in a stock’s price. This blog will explain the bear put spread in simple terms with easy examples.
Goal of the Bear Put Spread
The primary goal of a bear put spread is to profit from a gradual decrease in the price of the underlying stock.
Understanding the Bear Put Spread
A bear put spread involves two steps:
- Buy a Put Option (Long Put): This gives you the right to sell a stock at a higher price.
- Sell a Put Option (Short Put): This obligates you to buy the same stock at a lower price if exercised.
Both options have the same stock and expiration date. You set up this strategy for a net cost (or net debit) and profit when the stock's price falls.
How to Set Up a Bear Put Spread
- Buy an ATM Put Option: An at-the-money (ATM) put option has a strike price close to the current market price.
- Sell an OTM Put Option: An out-of-the-money (OTM) put option has a strike price lower than the current market price.
- Ensure Both Options Have the Same Expiry Date
Example of a Bear Put Spread
Let's use stock XYZ as an example:
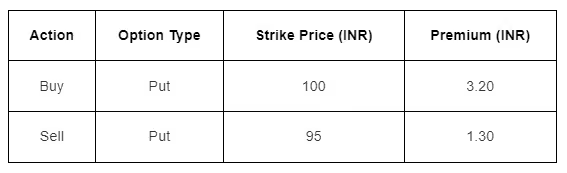
- Total Cost: 3.20 - 1.30 = 1.90 INR
How You Make Money
- Maximum Profit: The most you can earn is the difference between the two strike prices minus the net cost.
In this example:
- Difference between strike prices: 100 - 95 = 5.00 INR
- Net cost: 1.90 INR
- Maximum profit: 5.00 - 1.90 = 3.10 INR
You achieve this maximum profit if the stock price is below the lower strike price (95 INR) at expiration.
- Maximum Loss: The most you can lose is the net cost you paid.
In this example:
- Maximum loss: 1.90 INR
This loss happens if the stock price is above the higher strike price (100 INR) at expiration.
- Breakeven Price: The stock price at which you neither make nor lose money.
In this example:
- Breakeven: 100 - 1.90 = 98.10 INR
Profit/Loss Table
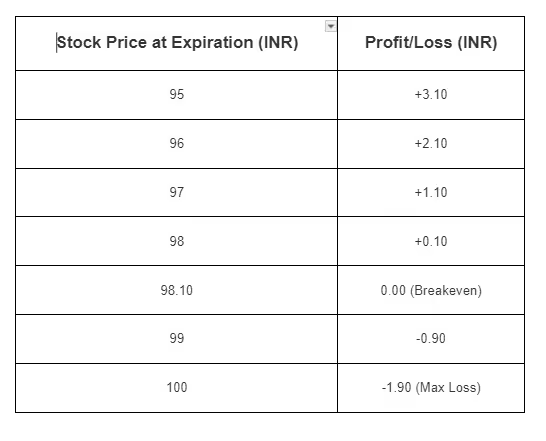
Advantages and Disadvantages of a Bear Put Spread
Pros
- Less Risky than Short-Selling: Limits your losses to the net amount paid.
- Profitable in Modestly Declining Markets: Effective when expecting moderate price declines.
Cons
- Risk of Early Assignment: The buyer of your short put can exercise it early if the stock price falls sharply. This would force you to buy the stock at a potentially unfavorable price.
- Limited Profit: Profits are capped at the difference between strike prices minus the net cost.
- Risk if Stock Price Rises: If the stock price rises significantly, the strategy results in a loss.
When to Use the Bear Put Spread
This strategy is ideal when you expect a moderate decline in stock prices and want to limit your risk. It works best in low volatility markets, as increased volatility after you enter the trade can amplify profits.
What Does the Bear Put Spread Result In?
The bear put spread results in a net debit, calculated as the difference between the higher and lower strike prices. The maximum loss is the net debit paid.
Closing a Bear Put Spread
It's usually a good idea to close a bear put spread before it expires if it's profitable. This helps you capture the maximum gain and avoid the risk of early assignment on the short put. If the short put is exercised, it creates a long stock position, which can be closed by selling the stock or exercising the long put. These actions may incur additional fees, so closing a profitable position early is often wise.
Summary
The bear put spread is a useful strategy for options traders expecting a moderate decline in stock prices. It offers a balanced approach by limiting both potential profits and losses, making it a safer alternative to other bearish strategies.
Learn more about financial terminologies with Swastika!

The 12 Best Stock Market Movies Every Investor Must Watch (With IMDb Ratings)
Whether you're a beginner trying to understand the stock market or an experienced investor looking for lessons beyond charts and numbers, stock market movies can be surprisingly educational. The best finance films explain complex concepts like investing, trading psychology, market manipulation, corporate greed, derivatives, IPOs, and financial crises through engaging storytelling.
From Hollywood classics like Wall Street and The Big Short to Indian masterpieces like Scam 1992 and Guru, these movies offer valuable lessons on risk management, ethics, discipline, and the realities of financial markets.
In this guide, we've handpicked the 12 best stock market movies that every trader and investor should watch. Along with a brief review, we've also included each movie's IMDb rating to help you decide what to watch first.
1. Wall Street (1987)
IMDb Rating: ⭐ 7.3/10
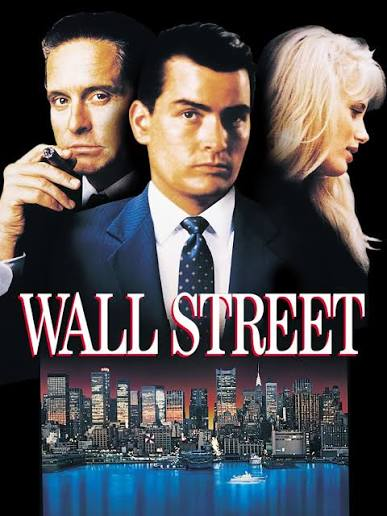
Oliver Stone's Wall Street remains one of the most iconic finance movies ever made. The story follows Bud Fox, a young stockbroker who dreams of success and eventually begins working with the ruthless corporate raider Gordon Gekko.
The famous dialogue, "Greed is good," became one of the most quoted lines in financial history.
Why You Should Watch
- Shows how insider trading works.
- Explains corporate takeovers.
- Highlights the dangers of greed and unethical investing.
- Michael Douglas won the Academy Award for Best Actor.
Key Lesson: Shortcuts may generate quick wealth, but integrity determines long-term success.
TRY SARTHI - YOUR AI STOCK ASSISTANT
2. The Wolf of Wall Street (2013)
IMDb Rating: ⭐ 8.2/10
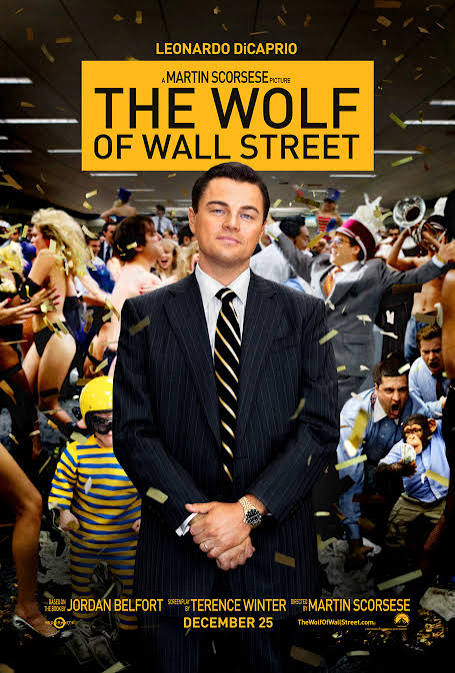
Directed by Martin Scorsese and starring Leonardo DiCaprio, the movie “The Wolf of Wall Street” tells the real-life story of Jordan Belfort, whose brokerage firm became infamous for fraudulent stock manipulation and pump-and-dump schemes. While entertaining, it also serves as a cautionary tale about unchecked ambition.
Why You Should Watch
- Explains penny stock manipulation.
- Demonstrates investor psychology.
- Shows the consequences of financial fraud.
- One of the most entertaining finance films ever made.
Key Lesson: Extraordinary wealth built on unethical practices never lasts.
3. Margin Call (2011)
IMDb Rating: ⭐ 7.1/10
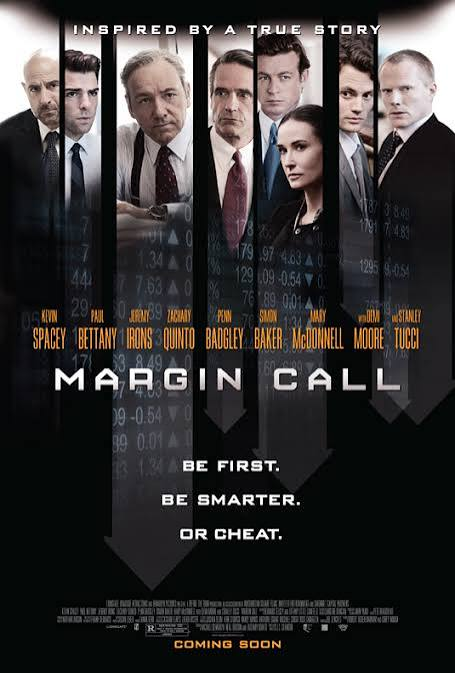
Set during the early hours of the 2008 global financial crisis, Margin Call follows the leadership team of an investment bank after discovering massive exposure to toxic assets. Unlike action-packed finance movies, this film focuses on decision-making under pressure.
Why You Should Watch
- Shows how risk management failures occur.
- Explains institutional investing.
- Offers realistic insight into Wall Street operations.
Key Lesson: Sometimes the biggest financial disasters begin quietly inside boardrooms.
4. The Big Short (2015)
IMDb Rating: ⭐ 7.8/10

Based on Michael Lewis' bestselling book, The Big Short follows investors who predicted the housing market collapse before the 2008 financial crisis. The movie explains complex financial instruments like mortgage-backed securities and credit default swaps using simple examples and humour.
Why You Should Watch
- Makes complicated financial concepts easy to understand.
- Explains market bubbles.
- Demonstrates contrarian investing.
- Outstanding performances by Christian Bale, Steve Carell, Ryan Gosling, and Brad Pitt.
Key Lesson: Independent thinking often creates the biggest investment opportunities.
5. Guru (2007)
IMDb Rating: ⭐ 7.7/10

One of India's finest business dramas, Guru is inspired by the life and entrepreneurial journey of Dhirubhai Ambani.
The film follows Gurukant Desai's rise from a small-town dreamer to one of India's most influential businessmen.
Why You Should Watch
- Focuses on entrepreneurship.
- Explores capital markets and business expansion.
- Shows how ambition transforms industries.
Key Lesson: Vision and perseverance can build extraordinary businesses.
6. Scam 1992: The Harshad Mehta Story (2020) (Web Series)
IMDb Rating: ⭐ 9.3/10

Arguably India's greatest finance-based series, Scam 1992 chronicles the rise and fall of Harshad Mehta, the man behind India's biggest securities scam. It also explains how banking loopholes were exploited to manipulate stock prices.
Why You Should Watch
- Explains how stock market manipulation works.
- Covers India's financial reforms.
- Outstanding screenplay and performances.
- One of the highest-rated Indian web series.
Key Lesson: Even booming markets require strong regulation and transparency.
7. The Big Bull (2021)
IMDb Rating: ⭐ 5.8/10

The Big Bull is loosely inspired by the life of Harshad Mehta and tells the story of Hemant Shah, a stockbroker who rises from humble beginnings to become one of the biggest names in the Indian stock market. While it takes creative liberties compared to Scam 1992, it still gives viewers an understanding of market manipulation, ambition, and the consequences of financial misconduct.
Why You Should Watch
- Inspired by one of India's biggest stock market stories.
- Explains how market manipulation can impact investors.
- Shows the importance of regulatory oversight.
- Features an engaging performance by Abhishek Bachchan.
Key Lesson: Rapid success without ethical practices eventually leads to long-term failure.
8. Trading Places (1983)
IMDb Rating: ⭐ 7.5/10
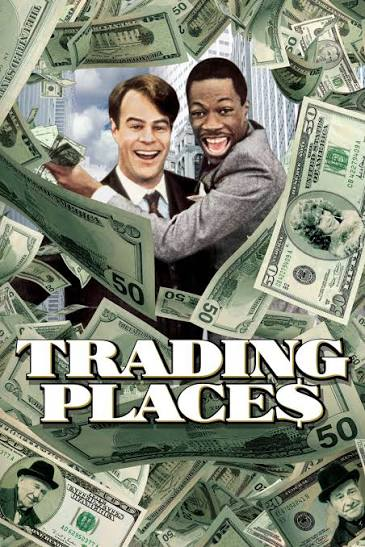
Unlike most finance movies, Trading Places combines comedy with lessons about commodities trading and market speculation. The story follows two men whose lives are switched as part of an experiment conducted by wealthy businessmen. While humorous, the movie introduces viewers to futures contracts, commodity markets, and trading psychology in an easy-to-understand way.
Why You Should Watch
- Makes financial concepts entertaining.
- Explains commodity and futures markets.
- Excellent performances by Eddie Murphy and Dan Aykroyd.
- A timeless comedy with valuable investing lessons.
Key Lesson: Markets are influenced as much by human behaviour as by economic data.
9. Boiler Room (2000)
IMDb Rating: ⭐ 7.0/10
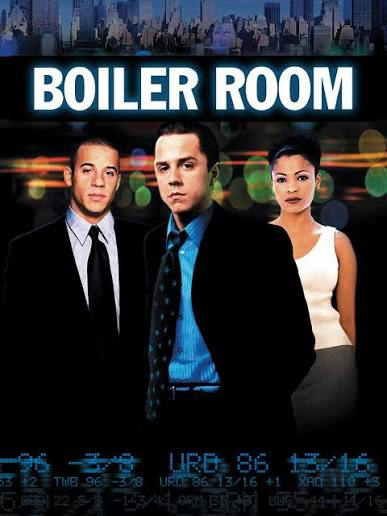
Boiler Room explores the aggressive world of brokerage firms where inexperienced brokers are trained to sell questionable investments using high-pressure sales techniques. The movie highlights how unethical practices can trap retail investors who fail to perform proper research before investing.
Why You Should Watch
- Shows how fraudulent brokerage operations work.
- Demonstrates investor psychology and sales tactics.
- Encourages due diligence before investing.
- A gripping financial crime drama.
Key Lesson: Always research investments instead of blindly trusting stock tips or sales pitches.
10. Glengarry Glen Ross (1992)
IMDb Rating: ⭐ 7.7/10
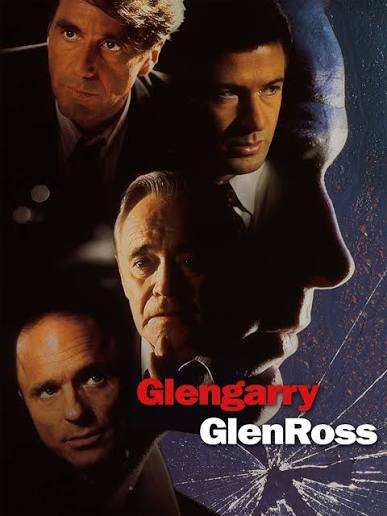
Although Glengarry Glen Ross focuses primarily on real estate sales rather than the stock market, its lessons about negotiation, pressure, competition, and ethics are highly relevant for traders, investors, and finance professionals. The movie features one of the strongest ensemble casts in cinema history, including Al Pacino, Jack Lemmon, Alec Baldwin, Ed Harris, and Kevin Spacey.
Why You Should Watch
- Outstanding dialogue and performances.
- Explores sales psychology.
- Demonstrates how pressure influences decision-making.
- Valuable lessons on ethics and professionalism.
Key Lesson: Sustainable success comes from trust and credibility, not aggressive selling.
11. Rogue Trader (1999)
IMDb Rating: ⭐ 6.4/10

On the true story of Nick Leeson, Rogue Trader recounts how one derivatives trader caused the collapse of Barings Bank through unauthorised and highly leveraged positions. The movie provides valuable insight into derivatives, futures trading, risk management, and corporate governance failures.
Why You Should Watch
- Based on a real financial disaster.
- Explains derivatives trading.
- Demonstrates the importance of internal controls.
- Highlights the dangers of excessive leverage.
Key Lesson: Poor risk management can destroy even the most established financial institutions.
12. Equity (2016)
IMDb Rating: ⭐ 5.5/10
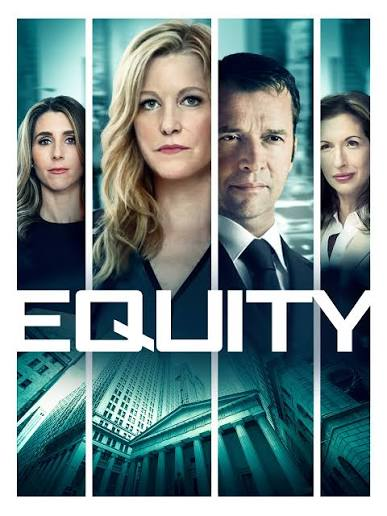
Equity is one of the few finance movies led by female professionals. The story revolves around a senior investment banker managing a high-profile IPO while balancing professional pressures, ethics, and personal challenges.
Unlike many finance films that focus on trading floors, Equity offers an inside look at investment banking and the IPO process.
Why You Should Watch
- Explains how IPOs work.
- Offers a fresh perspective on investment banking.
- Highlights ethical challenges in finance.
- Focuses on leadership and decision-making.
Key Lesson: Reputation and transparency are essential in capital markets.
What Can Investors Learn from These Stock Market Movies?
While these films are designed for entertainment, they also provide valuable lessons that every investor can apply in real life.
Key Takeaways
- Markets reward discipline more than emotions.
- Greed and fear often lead to poor investment decisions.
- Risk management is as important as identifying profitable opportunities.
- Understanding financial statements and business models is essential.
- Diversification helps reduce investment risk.
- Long-term investing usually outperforms speculation.
- Never invest based solely on rumours or market hype.
- Ethical investing creates sustainable wealth over time.
Whether you're a beginner or an experienced trader, these movies reinforce principles that remain relevant across every market cycle.
Frequently Asked Questions
Which is the best stock market movie of all time?
Many investors consider The Big Short, Wall Street, and Scam 1992 among the best stock market movies because they combine entertainment with valuable financial lessons.
Which movie explains the 2008 financial crisis?
The Big Short and Margin Call provide the most detailed and easy-to-understand explanation of the 2008 global financial crisis.
Is Scam 1992 better than The Big Bull?
Most viewers prefer Scam 1992 because it offers greater historical accuracy, stronger storytelling, and a more detailed explanation of the Harshad Mehta securities scam.
Can beginners learn stock market concepts from movies?
Yes. Movies can help beginners understand investing, trading psychology, market crashes, IPOs, derivatives, and financial fraud. However, they should complement, not replace, books, courses, and practical market experience.
Are these movies based on real events?
Several titles are inspired by true stories, including The Wolf of Wall Street, The Big Short, Scam 1992, Guru (partly inspired), Rogue Trader, and Margin Call (fictionalised but based on real events surrounding the 2008 financial crisis).
Bottom Line
Instead of simply entertaining, these stock market movies help you understand how financial markets work, how investor psychology influences decisions, and why discipline is more important than chasing quick profits. From corporate greed and insider trading to IPOs, derivatives, financial crises, and long-term investing, each movie offers practical lessons that remain relevant in today's markets. Whether you're interested in investing, trading, or simply understanding the world of finance, these films provide valuable insights that can improve your perspective before you make your next investment decision.
Learning from movies is a great starting point, but successful investing requires continuous learning, reliable research, and informed decision-making. At Swastika Investmart, we empower investors with expert market research, real-time insights, advanced trading platforms, and educational resources to help them navigate the stock market with confidence. Visit Swastika Investmart for the latest market insights, educational guides, and expert analysis that help you become a more informed investor.
Big Budget


Popular Articles





.avif)
.avif)

.avif)



START YOUR INVESTMENT JOURNEY
Get personalized advice from our experts
- Dedicated RM Support
- Smooth and Fast Trading App
