


TCI Industries Share Price: Jun 2026 Quarter Deep-Dive And Outlook


Key Takeaways
- TCI Industries posted a standalone net loss of Rs 0.51 crore for the June 2026 quarter, even as sales rose 8.16% to Rs 0.53 crore.
- Operating margin deteriorated sharply to -79.25% from -53.06% year over year.
- PBDT, PBT and NP remained negative, signaling ongoing profitability challenges for the quarter.
- Investors should monitor margin stabilization and the potential re-rating in TCI Industries Share Price as revenue grows.
TCI Industries Share Price has become a focal point for retail investors after the June 2026 quarter results showed a mixed picture: a standalone net loss of Rs 0.51 crore while Sales of Rs 0.53 crore rose 8.16% year-on-year. The margin story, however, remains challenging as operating margin collapsed to -79.25% in Jun 2026 from -53.06% in Jun 2025. Net profit printed negative at Rs -0.51 crore, while PBDT and PBT stayed negative, signaling continued profitability headwinds. In this post, we dissect these figures, compare them with the June 2025 quarter, and translate what they could mean for the tci industries share price trajectory going forward.
TCI Industries Share Price: Jun 2026 Quarter Performance Breakdown
The June 2026 quarter is a mixed bag for the company. Revenue rose 8.16% to Rs 0.53 crore, confirming topline momentum even as the bottom line remained in the red. Standalone net loss rose to Rs 0.51 crore, up from Rs 0.38 crore in the prior year. The margin compression is stark: OPM was -79.25% in Jun 2026, compared with -53.06% in Jun 2025. Profitability metrics confirm the strain: PBDT is -0.41 crore, PBT is -0.51 crore, and NP is -0.51 crore in Jun 2026, versus -0.29 crore, -0.38 crore, and -0.38 crore in Jun 2025. The revenue growth signals top-line momentum, but profitability is still under pressure, highlighting the challenge of turning revenue gains into earnings.
| Metric | Jun 2026 | Jun 2025 | YoY Change |
|---|---|---|---|
| Sales (Rs crore) | 0.53 | 0.49 | +8.16% |
| Net Loss (Rs crore) | 0.51 | 0.38 | +0.13 |
| OPM % | -79.25% | -53.06% | To be announced |
| PBDT (Rs crore) | -0.41 | -0.29 | To be announced |
| PBT (Rs crore) | -0.51 | -0.38 | To be announced |
| NP (Rs crore) | -0.51 | -0.38 | To be announced |
Notes: The data above reflect standalone quarterly figures reported by the company for the Jun 2026 quarter versus Jun 2025. The 8.16% sales rise comes with a widening net loss and sharper margin contraction, underscoring the profitability challenge even as top-line growth persists.


Why The Jun 2026 Standalone Loss Could Impact The TCI Industries Share Price
The standalone loss expansion to Rs 0.51 crore, despite higher sales, is a warning flag for near-term investor sentiment. The margin erosion to -79.25% signals that cost discipline or revenue mix changes are crucial before the stock can re-rate. In equity markets, margins are a critical driver of valuation; a persistent negative margin can cap upside even when revenue grows. Therefore, the TCI Industries Share Price may face downward pressure until there is credible evidence of margin recovery or meaningful cost reductions.
For deeper stock analysis and price targets, consult Swastika's Sarthi AI stock assistant.
Revenue Growth Versus Profitability: Analyzing The Jun 2026 Quarter
The juxtaposition of top-line growth with persistent losses is a central theme here. An 8.16% sales rise to Rs 0.53 crore shows the company is able to move volume or value in the market, but the magnitude of the losses suggests that the incremental revenue is not yet translating into earnings. The sharp OPM slide from -53.06% to -79.25% strengthens concerns about cost structure, pricing power, and the potential need for strategic readjustments. Without a credible path to margin expansion, the TCI Industries Share Price could remain vulnerable to investor sentiment shifts and broader market swings.
Investors should look for cost optimization measures announced in future quarters, including any changes in procurement, overhead controls, or product mix changes that could improve gross margins and operating leverage. A sustained improvement in OPM, even if incremental, could unlock the stock’s upside potential if paired with continued top-line growth.
YoY Comparison: Jun 2026 Versus Jun 2025 For TCI Industries
Comparing Jun 2026 with Jun 2025, sales rose from Rs 0.49 crore to Rs 0.53 crore–an 8.16% rise. However, net losses widened from Rs 0.38 crore to Rs 0.51 crore. OPM deteriorated from -53.06% to -79.25%, indicating worsening profitability margins across the board. PBDT, PBT, and NP remained negative in both years, with values higher in 2026. This juxtaposition underscores that revenue growth on its own is insufficient to reverse the earnings trajectory; it also highlights why the TCI Industries Share Price would require a credible margin recovery to re-rate meaningfully.
What Investors Should Watch Next For TCI Industries Share Price
From here, the critical watchpoints are margin stabilization and sustained revenue growth that translates into stronger earnings. If management can lift OPM toward a more sustainable level while continuing to grow sales, the market could reprice the stock favorably. Keep an eye on cost control, efficiency gains, and changes in the product mix that could improve gross margins and operating leverage. Stay tuned to quarterly results, management commentary, and any strategic updates that address the root causes of the margin compression observed in the Jun 2026 quarter.
Next step: Use a disciplined framework–watch for margin stabilization signals in the next two to four quarters, corroborated by improving gross margins or efficiency gains, and consider using Swastika's Sarthi AI stock assistant to model scenario-based outcomes for the TCI Industries Share Price under different cost and revenue trajectories.
Frequently Asked Questions
What was TCI Industries' net loss in the June 2026 quarter?
Rs 0.51 crore (standalone net loss).
What were TCI Industries' sales in the June 2026 quarter?
Rs 0.53 crore.
How did TCI Industries' operating margin change in the Jun 2026 quarter?
OPM was -79.25% in Jun 2026, down from -53.06% in Jun 2025.
Did PBDT, PBT and NP remain negative in Jun 2026?
Yes. PBDT was -0.41 Rs crore, PBT was -0.51 Rs crore, and NP was -0.51 Rs crore in Jun 2026 (vs Jun 2025 values of -0.29, -0.38, and -0.38 respectively).
What should investors watch next for TCI Industries share price?
Investors should monitor margin stabilization, cost-control efforts, and continued revenue growth, as these factors typically drive any potential re-rating of the TCI Industries share price.
Conclusion
In the current environment, the June 2026 quarter for TCI Industries shows revenue growth on the top line but weak profitability. The TCI Industries Share Price will likely reflect margins stabilization and cost controls rather than topline expansion alone. For retail investors, the mental model is "growth vs. profitability" and to watch for a credible turn in margins before re-rating the stock.
The recommended next step is to calibrate risk and monitor quarterly updates for signs that margins are stabilizing while top-line momentum persists. This approach helps you decide when the stock might offer a favorable risk-reward dynamic, and it aligns with a disciplined investment framework for evaluating micro-cap names with similar profiles. For richer scenario planning, consider Swastika's Sarthi AI stock assistant as a practical tool to quantify how margin shifts could impact the TCI Industries Share Price under different market conditions.
Open your trading and demat account here
Reference :
Latest Articles

सख्त मौद्रिक नीति से सोने के भाव पहुंचे एक महीने की ऊंचाई पर।


प्रमुख केंद्रीय बैंकों द्वारा इस सप्ताह अपनी संबंधित बैठकों में अपनी मौद्रिक नीतियों को सख्त करने के बाद कीमती धातुओं में तेज़ी रही और सोने के भाव एक महीने की उचाई पर पहुंच गए। डॉलर जो आम तौर पर सोने के विपरीत चलता है, अमेरिकी फेड और यूरोपियन सेंट्रल बैंक द्वारा अपने कोविड-19 आर्थिक प्रोत्साहन को वापस लेने के बाद फिसल गया।
पिछले सप्ताह सोना 1 प्रतिशत और चांदी 1.7 प्रतिशत तेज़ हुई है। प्रमुख केंद्रीय बैंक उच्च मुद्रास्फीति को नियंत्रित करने के लिए मौद्रिक नीतियों को सख्त कर रहे हैं, साथ ही ओमीक्रॉन कोवीड-19 संस्करण के प्रभाव पर भी नजर रख रहे हैं।
मौद्रिक नीति में सख्ती सोने और चांदी के भाव के लिए नकारात्मक प्रभाव देता है, लेकिन बाज़ारो ने इस खबर को पहले ही भुना लिया था जिसके कारण कीमती धातुओं में तेज़ी रही और डॉलर इंडेक्स में दबाव बना। अमेरिकी फेड के साथ यूरोपियन सेंट्रल बैंक ने भी कोवीड राहत पैकेज में मार्च तक कटौती करने को कहा है।
इस बीच, यूरोपीय सेंट्रल बैंक ने 6 महीनो के लिए नियमित मासिक बांड-खरीद को बढ़ावा दिया जिससे कीमती धातुओं में तेज़ी रही। जबकि फेड द्वारा मार्च 2022 मे 0.75 प्रतिशत ब्याज दर बढ़ाने की योजना है। बैंक ऑफ़ इंग्लैंड ने अपनी ब्याज दरों में 0. 25 प्रतिशत की वृद्धि कर दी है।
जबकि बैंक ऑफ़ जापान ने सरल मौद्रिक नीति रखने के साथ आपातकालीन कोवीड -19 फण्ड को घटाने के सन्देश दिए है। केंद्रीय बैंकों के सख्त मौद्रिक नीति के आत्मविश्वाश से कच्चे तेल का रुझान पिछले सप्ताह तेज़ी का रहा और अमेरिका से बेरोज़गारी दावे के आकड़ो में बढ़ोतरी दर्ज की गई जिसके कारण सोने और चांदी के भाव को सपोर्ट रहा है।
इस सप्ताह सोने और चांदी के भाव पर बुधवार को अमेरिका से जारी होने वाले कंस्यूमर कॉन्फिडेंस और गुरुवार को कोर पीसीई प्राइस इंडेक्स के आकड़ो का प्रभाव रहेगा।
तकनिकी विश्लेषण
इस सप्ताह सोने और चांदी के भाव में निचले स्तरों पर सपोर्ट रह सकता है। सोने में 48200 रुपये पर सपोर्ट और 49000 रुपये पर प्रतिरोध है। चांदी में 61400 रुपये पर सपोर्ट और 63000 रुपये पर प्रतिरोध है।
CMS Info Systems Limited IPO : Outlook & Valuation
In December, CMS Info Systems Limited IPO was listed. Incorporated in 2008, CMS Info Systems Limited is India's largest cash management company in terms of the number of ATM points and retail pick-up points as of March 31, 2021.
The company is engaged in installing, maintaining, and managing assets and technology solutions on an end-to-end outsourced basis for banks, financial institutions, organized retail as well as e-commerce companies in India.
CMS Info Systems Limited Business Operates in 3 Segments:
- Cash management services.
- Managed services i.e. banking automation product sales, common control systems, and software solutions, etc.
- Others i.e. financial cards issuance for banks and card personalization services.
In the first place, CMS integrated business platform is supported by customized technology and process controls.
In addition CMS enables it to offer its customers a wide range of tailored cash management and managed services solution.

The Company caters to a broad set of outsourcing requirements for banks, financial institutions, organized retail as well as e-commerce companies in India.
firstly, the demand for cash and cash related services in India has increased, banks and other participants in India are increasingly outsourcing their ATM operations and management.
Secondly, As of August 31, 2021, it has a network of 3,965 cash vans , 238 branches , offices to cover all of India's states , union territories and covering 97.04% of India’s 742 districts, 14,949, or 77.46%, Indian postal codes.
At last the revenue of the cash management market in India grew from approximately ₹10.0 billion in the Fiscal Year 2010 to approximately ₹27.7 billion in the Fiscal Year 2021, a CAGR of 10.88%
Outlook & Valuation:
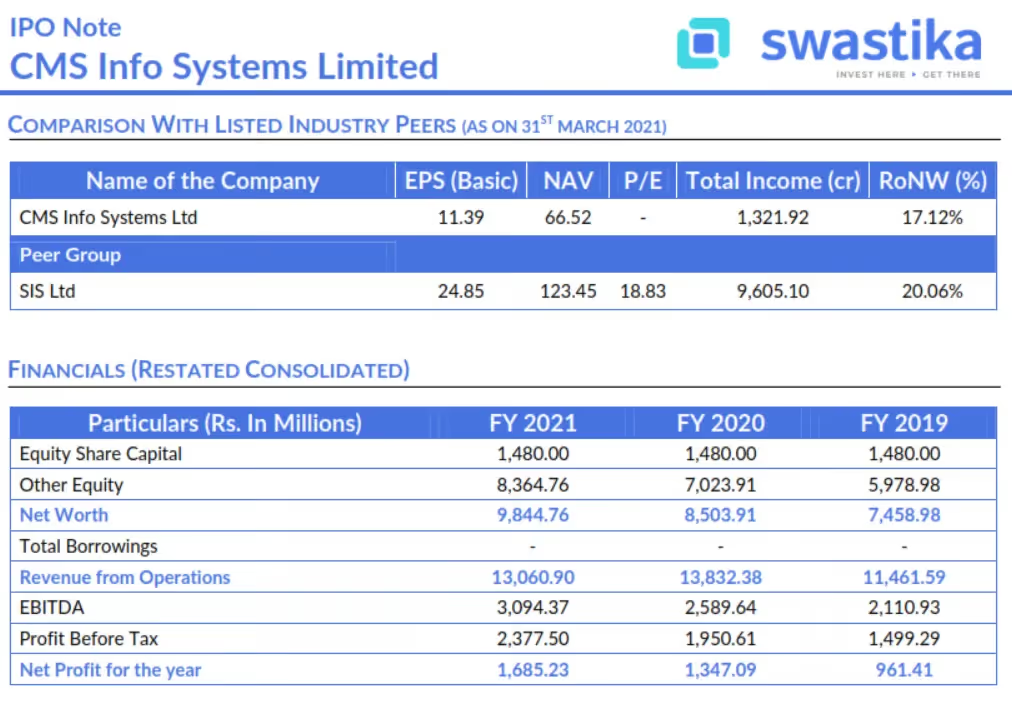
Despite consistent growth in revenues, we saw a decline in FY21 which can be attributed to COVID-19. According to the company, the revenue in FY20 was Rs. 1388.29 Crores and fell to Rs 1321.92 crore in FY21.
However, the company has improved its net profit from Rs. 134.7 crore in FY 20 to Rs. 168.52 crore in FY 2021. Also the company has stable financial performance and increasing margins.
In the first place, the risk of market volatility needs to be considered right now on the back of rising cases from the omicron variant.
As the government focuses on digital payments, a further decrease in the use and availability of cash can have an adverse effect on business activities.
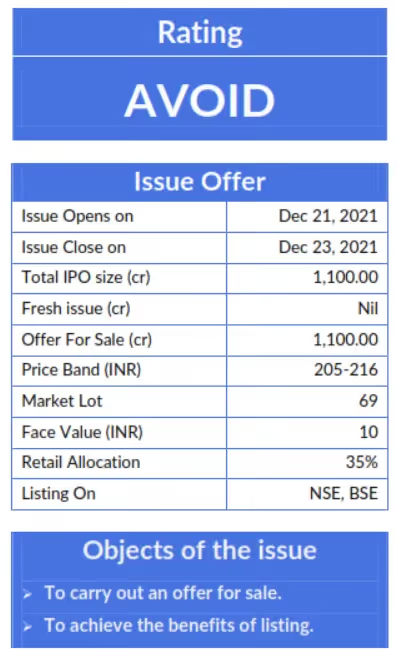
The IPO is priced at a PE of 19x to its FY21 EPS of Rs 11.09 and a P/BV of 3.24x on the NAV of Rs 66.52, which is in line with its listed peers. Thus we assign an "Avoid" rating to the IPO.
KEY MANAGERIAL PERSONNEL
- Shyamala Gopinath is the Chairperson and an Independent Director of the Company. She has been associated with the Company since November 13, 2017. In the past, she has served as the Deputy Governor of the RBI
- Rajiv Kaul is the Executive Vice Chairman, Whole Time Director and CEO of the Company. He is currently heading the Company and is responsible for the overall management of the Company. He has over 24 years of experience across technology, private equity and cash management industry.
- Pankaj Khandelwal is the President and Chief Financial Officer of the Company. He is currently responsible for the finance, legal as well as secretarial functions of the Company. He is a qualified chartered accountant from ICAI with over 27 years of experience.
- Praveen Soni is the Company Secretary and Compliance Officer of the Company. He has been associated with the Company since July 1, 2009. He has over 16 years of experience in secretarial as well as legal practices.
- Manjunath Rao Pare Parmeshwar is the President- Managed Services Business. He has been associated with the Company since July 6, 2012. He has over 34 years of experience in sales and marketing across sectors.
- Anush Raghavan is the President- Cash Management Business of the Company. He has over 14 years of experience in business management and business development.
- Sanjay Singh is the Chief Human Resources Officer of the Company. He has been associated with the Company since July 26, 2021
- Rohit Kilam is the Chief Technology Officer of the Company. He has over 20 years of experience in IT across sectors.
COMPETITIVE STRENGTHS
- Leading player in a consolidating market with strong fundamentals.
- Pan-India footprint with deep penetration in growing markets.
- Longstanding customer relationships with increased business opportunities.
- Integrated business platform offering a broad range of services and products.
- Track record of strong productivity and operational excellence.
- Experienced and highly qualified management team.
KEY STRATEGIES
- Drive operational efficiencies and increase profitability.
- Expand into business areas that create synergies with the current business.
- Enhancing the organizational capabilities.
KEY CONCERNS
- Company entire IPO proceeds (Rs 1,100 Crores) is Offer for Sale.
- India has moved to digitization post demonetization.
- The company business is highly dependent on the banking sector in India.
- Company business has affected by covid-19 pandemic and it can affect in future too.
- The company derives a substantial portion of its revenue from the limited number of customers.
How Does Investing in Stocks Help the Economy?
Investing in stocks is not just about growing your personal wealth; it also plays a crucial role in supporting and enhancing the broader economy. Here’s how investing in stocks contributes to economic growth and development:
1. Capital Formation
When investors buy shares of a company, they provide it with the capital needed to expand its operations, develop new products, or enter new markets. This process of capital formation helps businesses grow and innovate, which can lead to increased productivity and economic growth.
Example:
- Reliance Industries: When investors purchase shares of Reliance, the company can use this capital to invest in its telecom or retail ventures, leading to expansion and job creation.
2. Job Creation
As companies receive investment through the sale of stocks, they often use these funds to hire more employees, expand facilities, or increase production. This directly contributes to job creation and reduces unemployment.
Example:
- Infosys: Investments in Infosys enable the company to grow its operations, which can lead to the creation of thousands of jobs in technology and related sectors.
3. Innovation and Technological Advancements
Investment in stocks allows companies to fund research and development (R&D) activities. This funding supports innovation and technological advancements, which can drive economic growth and improve living standards.
Example:
- Biocon: Investments in Biocon, a biotech company, support its R&D efforts, leading to the development of new medicines and therapies, which can have a positive impact on public health and the economy.
4. Enhancing Market Liquidity
Stock markets provide a platform for buying and selling shares, which enhances market liquidity. Liquidity refers to how easily assets can be bought or sold without affecting their price. High liquidity in the stock market facilitates efficient capital allocation and investment.
Example:
- Nifty 50: The Nifty 50 index includes top-performing companies in India, and its liquidity allows investors to buy or sell shares easily, supporting efficient market operations.
5. Wealth Creation and Consumer Spending
Investing in stocks can lead to wealth creation for individuals. When investors see their investments grow, they may have more disposable income to spend on goods and services, which boosts consumer spending and stimulates economic activity.
Example:
- HDFC Bank: When investors gain returns from HDFC Bank stocks, they might spend more on goods and services, contributing to economic growth.
6. Encouraging Savings and Investment
The potential for capital appreciation and dividends encourages people to invest rather than keep their money in savings accounts. Increased investment in stocks can lead to higher levels of savings, which provides more capital for businesses and contributes to economic stability.
Example:
- SBI Mutual Funds: By investing in SBI Mutual Funds, individuals can grow their savings and contribute to the capital available for business investments.
7. Supporting Government Revenue
Stock markets generate revenue for governments through taxes on capital gains and corporate profits. This revenue can be used for public services, infrastructure projects, and other economic development initiatives.
Example:
- Tax on Dividends: Dividends received from stocks are subject to tax, providing revenue for the government that can be used to fund public services and infrastructure.
8. Building Investor Confidence
A well-functioning stock market attracts both domestic and international investors. Confidence in the stock market can lead to increased investment flows, which support economic stability and growth.
Example:
- Foreign Institutional Investors (FIIs): FIIs investing in Indian stocks bring foreign capital into the economy, supporting business growth and economic development.
9. Facilitating Wealth Distribution
Stock markets can help in the distribution of wealth by providing investment opportunities to a wide range of people. This can reduce income inequality and contribute to a more balanced economic growth.
Example:
- Equity Participation: Companies offering Employee Stock Option Plans (ESOPs) allow employees to become shareholders, aligning their interests with company performance and distributing wealth more broadly.
Conclusion
Investing in stocks is integral to the functioning of a healthy economy. It supports capital formation, job creation, innovation, and market liquidity. By encouraging savings and investment, providing government revenue, and building investor confidence, stock markets play a vital role in economic growth and stability. Understanding these contributions helps investors appreciate the broader impact of their financial decisions on the economy.

Open-High and Open-Low Strategy in Intraday Trading
Today in this blog we will discuss what is Open-high and Open-low Strategies in Intraday Trading.
In India, people often choose to trade in the stock market trading whether it is long term or short term. This is because it allows them to uplift their wealth to an upper level.
As per the new economic survey, it has been found that the participation of the retail sector in the stock market is rising as the number of investors in the stock market has grown up by a whopping 142 Lakh in FY 21. It has also been recorded that new accounts have opened up with 122. 5 Lakh new accounts in CDSL and 19.7 Lakh in NSDL.
If we talk about trading in India, then Intraday trading is something that is considered one of the most challenging yet electrifying forms of share market trading. Also, many traders prefer intraday trading over others because they find it the best way to achieve profit within one trading day.
To book profits within a single day, traders use numerous tools such as charts and patterns to measure stock’s performance and make decisions based on them. In addition, they also grasp some strategies to gauge the performance of their scripts.
Although traders use different strategies to book profit from day trading, open high and open-low strategy is often used by intraday traders. In this blog, we will uncover the pivotal points of intraday trading:
What is Intraday Open-High, Open- Low Strategy:
When any stock or index has the same value, then Open-High Open-low Strategy is the one wherein a buy signal is generated. This indicates that traders buy stocks in large quantities. Contrary to this, a selling signal is generated when the value of a stock or index remains the same for open and high. Here, a selling signal indicates that it's high time traders should sell their stocks.
Intraday trading makes sure that all the positions are squared off before the market closes and hence no changes in the management of shares. This indicates that the money flows throughout the market in the form of shares and when the market closes, the shares are withdrawn.
Open-High, Open-Low Strategy isn’t simple as it seems to be.
The NIFTY 50 Index reflects approximately 10% of the free-float market capitalization of NSE-listed stocks. This will help you choose the best sector to invest in and pull stocks out of the market at the right time.
Features of Open High Low Strategy:
Stock Chart Analysis (Long-Term)
The OHL feature helps traders to analyze the stock charts. With a detailed analysis of the stock charts, traders get an idea of where to buy or sell a stock. Many traders do trading against the trend of a stock. Hence it is recommended that the newbies should avoid trading against a stock’s trend.
To get a detailed insight into stock chart analysis, go for stock market learning.
High-Risk Reward Ratio
In general, the risk/reward ratio of OHL strategies is high and traders use this intraday trading method to set a "stop-loss"; near the strike price. If the stock's opening price is low, traders usually set the stop loss to the low of the opening candle for 15 minutes.
Evaluating Equity Trends Using the Scanner
Traders who choose the Open Hi-Lo strategy can more accurately assess equity trends. This allows you to make investment decisions more efficiently. Traders can put specific stocks on their watchlists and decide when to invest. This allows them to choose the best sector to invest their money in.
How Does Open High Low Strategy Work?
- Log in to your trading account and make sure you have enough funds to execute the transaction.
- Next, you need to navigate the user interface of your app or desktop to create a watchlist of scripts. The watchlist containing the script should be ready by 9:15 am, 15 minutes before the market opens.
- When creating a watchlist, you need to write down the highs, lows, and pivot levels of the previous day. This is easy to find on the broker platform.
- Monitor script prices for movements based on open interest movements of derivative securities and news about stocks, at least until 9:45 am. You can also check the analysis chart to see the changes.
- You can enter for a long time at 9:45 am. Once the market opens, wait for the price to break the previous day's highs. If it breaks, you need to make sure that today's opening price is equal to today's low price. If so, you can go long and keep your stop loss at the low price of the current trading day.
- And if you want to plunge at 9:45 am, you can also use the daytime open high-low strategy. In this case, we need to pay attention to the low price of the previous day before 9:15 am. As soon as the market on the current trading day opens, you have to wait until the price breaks through the previous day's lows.
- In this case, you should immediately check if the opening price of the current trading day corresponds to each daily high. If so, you need to be shorter and maintain a stop loss as the high on the current trading day.
- Once you have successfully executed your open high-low trading strategy, you can close your trade at the end of the trading day or according to a predetermined stop loss.
Things to Ponder Before Opting for OHL Strategy
Trading Volume
During intraday trading, traders are required to trade in the shares that have high trading volume. Stocks that have high trading volume uplift traders’ confidence to an upper level.
First Candle Closing Picture
Individuals find it easy to trade in the stock only if the closing price of the first candle is lower than the closing price of the second candle.
Risk: Reward Ratio
While trading in stocks, intraday traders need to ensure that the risk-reward ratio should be minimum. Trade analysts consider that 1:2 is the optimal ratio as risk-reward.
Range Breakout
Traders who are seeking the OHL strategy find entering long or short positions can make a range breakout.
Wrapping Up
Open-high and Open-low strategies are some of the favored strategies that many experienced traders regularly use.
On the other hand, if you are a beginner who wants to trade intraday, should opt for a reputed stockbroking firm with masterful stock market research and advisory services.
What is Inflation?
Inflation is the rise in the general level of prices of goods and services in an economy over time. It impacts the purchasing power of money — meaning ₹100 today might not buy you the same amount of goods next year. Inflation is a key factor in economic decision-making, from setting interest rates to determining wage growth.
Example of Inflation in India:
Parle-G Biscuits: A pack of Parle-G biscuits cost ₹4 in 2000. In 2023, it cost ₹10. This increase in price is due to inflation.
How Inflation is Measured in India
Inflation is primarily measured using two indexes in India:
- Consumer Price Index (CPI): Measures the average change in prices that consumers pay for a basket of goods and services.
- Wholesale Price Index (WPI): Tracks the price of goods sold in bulk (wholesale) before they reach consumers.
Recent Inflation Rates in India
In India, inflation rates have fluctuated in recent years due to various factors, including the pandemic, supply chain disruptions, and global oil price volatility.
Recent Inflation Rates in India:
Year CPI Inflation Rate (%)
2020 6.2
2021 5.1
2022 6.7
2023 4.6 (estimated)
Types of Inflation
Demand-Pull Inflation
Demand-pull inflation occurs when aggregate demand in the economy exceeds the available supply of goods and services. This can happen due to various factors, such as:
- Increased consumer spending: When consumers spend more, it puts upward pressure on prices.
- Government spending: Government investment can stimulate demand and lead to inflation.
- Exports: Increased exports can boost demand for domestic goods and services, raising prices.
Cost-Push Inflation
Cost-push inflation occurs when the cost of production increases, leading businesses to raise prices to maintain profit margins. Common causes of cost-push inflation include:
- Rising input costs: Increases in the prices of raw materials, energy, or labor can drive up production costs.
- Supply chain disruptions: Disruptions in supply chains, such as those caused by natural disasters or geopolitical events, can lead to shortages and higher prices.
- Increased taxes: Government-imposed taxes on businesses can raise production costs and contribute to inflation.
Built-in Inflation
Built-in inflation, also known as inflationary expectations, occurs when people anticipate future inflation and adjust their behavior accordingly. This can create a self-fulfilling prophecy, as businesses and workers may demand higher wages and prices to compensate for expected inflation.
Other Types of Inflation
- Structural Inflation: Occurs due to structural imbalances in the economy, such as bottlenecks in production or inefficient resource allocation.
- Imported Inflation: Occurs when prices of imported goods increase, often due to exchange rate fluctuations or higher prices in foreign markets.
Impact of Inflation on Indian Companies
Inflation affects various sectors in India differently:
- FMCG Sector: Companies in the Fast-Moving Consumer Goods (FMCG) sector are often more sensitive to inflation due to their reliance on raw materials and their need to compete in a price-sensitive market.
- Automobile Sector: The automobile sector is also affected by inflation, as the cost of raw materials, such as steel and aluminum, can increase production costs.
- Infrastructure Sector: Companies in the infrastructure sector, such as construction and real estate, can be impacted by rising interest rates and increased costs of materials.
Is Inflation Good or Bad?
Moderate inflation is considered beneficial for economic growth, while too much inflation can lead to instability.
- Positive Side of Inflation:some text
- Encourages Spending: A small amount of inflation encourages people to spend money rather than save it because the value of money decreases over time.
- Debt Relief: If you have loans, inflation reduces the real value of your debt over time. For example, those who took housing loans from HDFC Bank in the 2000s at a fixed rate benefited from inflation because their repayments became cheaper over time in real terms.
- Negative Side of Inflation:some text
- Erodes Savings: Inflation reduces the real value of your savings. For instance, if you save ₹1,00,000 at an interest rate of 4% but inflation is 5%, your purchasing power has decreased.
- Rising Costs: If inflation is high, salaries often don't rise at the same pace as prices, reducing the purchasing power of workers.
Scenario Effect
Low Inflation (1-4%) Stable economy, growth, debt relief
High Inflation (5-8%) Rising costs, pressure on households
Hyperinflation Economic collapse, loss of savings value
Conclusion
Inflation plays a significant role in shaping India’s economy. While moderate inflation is a sign of healthy growth, high inflation can cause financial strain on consumers and businesses. By understanding how inflation works, you can make better decisions in managing your investments, savings, and loans in the Indian market.

मजबूत बॉन्ड यील्ड और डॉलर से कीमती धातुओं में मंदी।
पिछले सप्ताह फेड के मिनट्स जारी किये गए जिसके बाद सोने और चांदी के भाव में भारी गिरावट दर्ज की गई। अमेरिकी बॉन्ड यील्ड और डॉलर बढ़त के साथ अपने उच्च स्तरों पर बने हुए है। कॉमेक्स वायदा में सोने के भाव पिछले सप्ताह 2 प्रतिशत से ज्यादा टूट गए और इसकी कीमते 1790 डॉलर प्रति औंस पर रही।
कॉमेक्स वायदा चांदी में 5 प्रतिशत से अधिक की गिरावट रही और इसकी कीमते 22 डॉलर के निचले स्तरों पर पहुंच गई। फेड अधिकारियों मुताबिक दर वृद्धि जल्द हो सकती है और संभवत: तेज गति से हो सकती है, जैसा कि उन्होंने पहले उम्मीद की थी क्योंकि अमेरिकी मुद्रास्फीति पिछले 40 वर्षो में बहुत तेज़ी बढ़ रही है।
फेड ने संकेत दिया कि नीति निर्माता, केंद्रीय बैंक की 8.9 ट्रिलियन डॉलर की बैलेंस शीट को पिछली बार कम करने की तुलना में अधिकआक्रामक तरह से घटाने पर विचार कर रहे हैं। कीमती धातुओं में बड़ी गिरावट को देखते हुए, ऐसा प्रतीत होता है कि सोना और चांदी अभी भी उच्च बॉन्ड यील्ड और डॉलर की तेज़ी के चपेट में आ गए है।
कच्चे तेल की कीमतों में लगातार तेज़ी और ओमीक्रॉन के मामलो में बढ़ोतरी के बावजूद सोने और चांदी की कीमतों को सपोर्ट नहीं मिला है जिससे दबाव बना रहने की सम्भावना बढ़ गई है। अमेरिकी साप्ताहिक बेरोजगार दावे, जो एक सप्ताह में 7000 से 207000 तक चढ़ गए और अमेरिकी व्यापार घाटे पर आकड़ा नवंबर में बढ़कर 80.2 बिलियन डॉलर हो गया, जो इससे पहले के महीने में 67.2 बिलियन डॉलर था। नॉन फार्म एम्प्लॉयमेंट चेंज से सोने और चांदी के भाव को सपोर्ट रहा।
तकनिकी विश्लेषण
कॉमेक्स डिवीजन में, सोने में 1780 डॉलर का समर्थन है, इसके निचे यह बिकवाली की गति को 1750 के स्तर तक बढ़ा सकता है। ऊपर की ओर 1835 डॉलर पर प्रतिरोध है। चांदी को 22 डॉलर पर सपोर्ट मिला है और इस स्तर से नीचे बिकवाली का दबाव बढ़ने की संभावना है। इसका 23 डॉलर पर रेजिस्टेंस है। एमसीएक्स में सोने को 46800 पर सपोर्ट और 49000 पर प्रतिरोध है। चांदी को 58800 पर सपोर्ट और 61000 पर प्रतिरोध है।
Big Budget


Popular Articles





.avif)
.avif)

.avif)



START YOUR INVESTMENT JOURNEY
Get personalized advice from our experts
- Dedicated RM Support
- Smooth and Fast Trading App
