
Gold Price Today Across Indian Markets: City-Wise Trends And Practical Investor Takeaways


Key Takeaways
- Gold price today shows volatility with 24K rates around 14,300 per gram in Bengaluru on July 16.
- June lows near 12,860 per gram for 22K; a tentative bounce near 13,000 in early July.
- City-wide 24K quotes cluster around 14,329–14,346 per gram, with Delhi, Mumbai, and Chennai near the top.
- Silver price per kilogram hovered around 2,35,000 after peaking around 2,90,000 and sliding through June.
Gold Price Today Across Indian Markets: July 2026 Snapshot
Gold price today in India is oscillating within a narrow corridor as global rate narratives and regional tensions influence demand. The June US inflation print came in cooler than expected, which typically supports gold, but persistent geopolitical tensions and higher rate expectations kept gains cautious. The price journey since mid-June shows a sharp move: on June 15, the 22-karat jewelry gold price per gram hovered around Rs 14,000. By June 25, it slipped to Rs 12,860 per gram, followed by a cautious rebound in early July. This week opened with a dip and a mixed pace through Wednesday, before a fresh decline today. On July 16, Bengaluru’s market data show 24-karat pure gold at Rs 14,329 per gram, 22-karat at Rs 13,135, and 18-karat at Rs 10,747 per gram. Mangalore mirrored 24K and 22K levels at Rs 14,329 and Rs 13,135, with 18K around Rs 10,747 as well.
To ground the narrative in the latest numbers, yesterday’s move shows the 22-karat price per gram slipping Rs 25 to Rs 13,135, while a ten-gram block moved down to Rs 131,350. This pattern–modest daily deltas within a broad range–reflects the market’s sensitivity to global liquidity signals, currency movements, and local demand pockets. The takeaway for a retail investor is clarity: do not rely on a single datapoint; instead, track a short-range trend and consider staged exposure when you expect a longer plateau.
Chennai Gold Price Today: City-Wide 24K And 22K Rates Across Major Cities
Morning trade confirms a tight cluster in 24-karat rates and a stable band for 22-karat variants across Indian metros. Here are the city-wise quotes captured in the latest morning trade across the ten major markets:
- Delhi: 24K Rs 14,344; 22K Rs 13,150
- Mumbai: 24K Rs 14,329; 22K Rs 13,135
- Ahmedabad: 24K Rs 14,334; 22K Rs 13,140
- Chennai: 24K Rs 14,346; 22K Rs 13,150
- Kolkata: 24K Rs 14,329; 22K Rs 13,135
- Hyderabad: 24K Rs 14,329; 22K Rs 13,135
- Jaipur: 24K Rs 14,344; 22K Rs 13,150
- Chandigarh: 24K Rs 14,344; 22K Rs 13,150
- Lucknow: 24K Rs 14,344; 22K Rs 13,150
- Kochi: 24K Rs 14,329; 22K Rs 13,135
- Mangalore: 24K Rs 14,329; 22K Rs 13,135
Chennai gold price today sits near the top end of the spectrum in the 24K category, consistent with a broader trend where the 24K line hovers above Rs 14,300 and the 22K line sits around Rs 13,1xx across major markets. For investors, this city-wise snapshot highlights where local supply and demand dynamics can tilt the buying experience, even when the underlying pure gold value remains relatively steady.
To deepen your understanding of how these city quotes impact purchases or hedging, see Swastika’s Sarthi AI stock assistant, which can help you connect precious metals market signals to stock market decisions: Swastika's Sarthi AI stock assistant.
24 Karat Gold Price And 22 Karat Price Trends: July 2026 Moves And What They Signal
The 24-karat gold price today, as observed in Bengaluru on July 16, shows Rs 14,329 per gram (down Rs 28 from the previous day), while 22-karat jewelry gold is Rs 13,135 per gram (down Rs 25). The 18-karat variant trades around Rs 10,747. The same morning in Mangalore confirms the trend with 24K Rs 14,329 and 22K Rs 13,135, underscored by the same 18K rate around Rs 10,747.
This data suggests a converging price path where the pure metal remains at the Rs 14.3k level, while jewelry-specific variants maintain a small premium over the 24K price, adjusted for alloy content, making Rs 13.1k for typical 22K jewelry a practical benchmark for buyers. The spread between 24K and 22K remains around Rs 1,000 to Rs 1,200 per gram in most markets, a factor that jewelry buyers monitor when negotiating gains or discounts with local dealers.
Silver Price Stability And Intercity Variations: What It Means For Your Portfolio
Silver’s price path has been comparatively steadier in recent weeks, though it also moves with commodity markets and currency shifts. In May, silver price per kilogram peaked near Rs 2,90,000, then eased to about Rs 2,80,000, and declined further to Rs 2,40,000 in June. By early July, silver hovered around Rs 2,50,000 per kilogram, with last week’s readings settling near Rs 2,35,000 and then stabilizing. For a retail investor, silver offers diversification potential but comes with higher volatility on a per-gram basis than gold, and storage and liquidity considerations can affect convenience and cost of ownership.
City-wise, the silver price today mirrors the same trend observed in gold: fluctuations in demand, local liquidity, and currency movements contribute to small variations across metros. Investors should view silver as a complement to gold for hedging, rather than a direct substitute, especially in times of currency stress or rising inflation expectations.
Morning Trade Snapshot: City-Wise 1 Gram Gold Price Across India
Here is a consolidated look at the 1-gram price levels in the morning trade for key cities, highlighting both the 24K and 22K variants. The values reflect the latest morning quotes and show how city-specific pricing aligns with the national trend:
| City | 24K Price (Rs/gram) | 22K Price (Rs/gram) |
|---|---|---|
| Delhi | Rs 14,344 | Rs 13,150 |
| Mumbai | Rs 14,329 | Rs 13,135 |
| Ahmedabad | Rs 14,334 | Rs 13,140 |
| Chennai | Rs 14,346 | Rs 13,150 |
| Kolkata | Rs 14,329 | Rs 13,135 |
| Hyderabad | Rs 14,329 | Rs 13,135 |
| Jaipur | Rs 14,344 | Rs 13,150 |
| Chandigarh | Rs 14,344 | Rs 13,150 |
| Lucknow | Rs 14,344 | Rs 13,150 |
| Kochi | Rs 14,329 | Rs 13,135 |
| Mangalore | Rs 14,329 | Rs 13,135 |
Understanding 24K, 22K And 18K Price Differentials: Practical Investor Insights
Grasping the difference between 24K, 22K, and 18K gold prices is essential for deciding when to buy or sell jewelry versus raw gold. The 24-karat price reflects the value of pure gold, while 22-karat and 18-karat prices incorporate alloy content that makes up the jewelry and affects making charges. The July 16 data shows 24K at Rs 14,329 per gram and 22K at Rs 13,135, with 18K at Rs 10,747 in Bengaluru and Mangalore. A small delta between 24K and 22K in many cities points to relatively stable alloy premiums in the current environment, though regional pricing can deviate due to dealer policies and local demand. Understanding this differential helps you budget jewelry purchases, plan for investment-grade metal, and estimate the relative cost of converting jewelry into pure gold when needed.
For a retail investor, the practical takeaway is clear: track the ratio of 24K to 22K prices over several weeks to identify whether the premium is widening or narrowing. A widening gap can indicate stronger jewelry demand or supply constraints, while a narrowing gap suggests a move toward a more uniform raw-gold price across markets. A disciplined approach–buying in increments, setting price alerts, and using a hedging mindset–can help you navigate the current price environment more effectively.
Actionable Takeaways For Retail Investors: How To Use The Gold Price Today Data
Given the data, a few practical steps can help you navigate gold investments in this environment. First, consider a staged purchase or diversifying across 24K and one or two widely traded jewelry-focused variants to manage liquidity and price risk. Second, use city-wise variations to time small entry opportunities where your preferred dealer offers a favorable 22K to 24K delta or where local demand indicators suggest a short-term move. Third, complement your gold exposure with a portion of silver if your portfolio requires diversification against inflation and currency risk, while being mindful of the higher volatility in silver compared with gold.
Frequently Asked Questions
What is the current gold price today in Bengaluru and other major markets?
As of July 16, 2026, Bengaluru shows 24K gold at Rs 14,329 per gram, 22K at Rs 13,135 per gram, and 18K at Rs 10,747 per gram. Other major markets reflect similar patterns: Delhi 24K Rs 14,344; Mumbai 24K Rs 14,329; Chennai 24K Rs 14,346.
How does the 24 karat gold price today compare with the 22 karat price today in major cities?
Across major cities, 24K prices hover around Rs 14,329 to Rs 14,346 per gram, while 22K jewelry prices range from Rs 13,135 to Rs 13,150 per gram. For example, Delhi 24K Rs 14,344 vs 22K Rs 13,150; Mumbai 24K Rs 14,329 vs 22K Rs 13,135; Chennai 24K Rs 14,346 vs 22K Rs 13,150.
What has been the trend for gold price today since mid-June 2026?
From June 15 to June 25, the 22-karat price per gram moved from around Rs 14,000 to Rs 12,860, then rebounded toward Rs 13,000 in early July. On July 16, the 24K price in Bengaluru was Rs 14,329 per gram, with 22K at Rs 13,135 and 18K at Rs 10,747, indicating a cautious, range-bound movement despite global volatility.
What is the silver price per kilogram and how has it moved recently?
Silver price per kilogram moved from around Rs 2,90,000 in May to Rs 2,80,000, then Rs 2,40,000 in June, rising to about Rs 2,50,000 in early July, and last week around Rs 2,35,000, with some stabilization since. This trajectory suggests silver is tracking broader commodity dynamics with notable volatility.
Where can I track the gold price today data in real-time and get AI-assisted insights?
Real-time price data can be tracked on credible market platforms. For deeper, AI-assisted insights that connect precious metals moves to stock market decisions, you can use Swastika's Sarthi AI stock assistant:Swastika's Sarthi AI stock assistant.
Conclusion
This article was published without a generated conclusion. Please review and add a conclusion before publishing.
Open your trading and demat account here
Reference :
1 : Varthabharati
Latest Articles

June LPG Cylinder Price Hike in India Citywise 14.2kg & 19kg: What Investors Must Know


Key Takeaways
- Domestic LPG price up ₹29; 19-kg up ~₹42; second rise in three months after ₹60 on 7 March.
- Citywise prices show 14.2kg around ₹942 to ₹979.50 and 19-kg between ₹3,113.50 and ₹3,400 across major cities.
- LPG imports account for about 90% of supply; diversification reduced West Asia dependence; US share now around 33% by April (from 8% in February).
- Subsidies: ₹700 to non-Ujjwala and ₹1,000 to Ujjwala beneficiaries; effective cost over ₹1,600; ₹29 hike translates to roughly ₹1 per day for a 12-cylinder/year family.
Two numbers leap from the latest official price revisions: a 14.2-kg cooking gas cylinder now priced at ₹942 in Delhi and a 19-kg cylinder priced at ₹3,113.50 in Delhi. This isn’t just a kitchen bill; it’s a lens on how energy costs ripple through households, policy budgets, and the stock market that retail investors follow every day. The June update follows a sequence of policy moves in which domestic LPG cylinders rose by ₹29 on 7 June– the second increase in three months after a ₹60 revision on 7 March– and a separate revision pushing up commercial 19-kg cylinder costs by around ₹42.
Where do these moves come from? In the wake of global energy disruptions and supply-chain frictions, the government has sought to manage price pressure while absorbing steep losses on each cylinder sold. State-run oil marketing companies (OMCs) have shouldered much of the pain to cushion consumers from the volatility of oil prices driven by the war and the related disruption in the Strait of Hormuz. In practical terms, this means a combination of policy tolerance and price signals that keep cooking gas affordable for households while maintaining energy liquidity for the market.
Why LPG price revisions happen and what the June 22 update implies for households and investors
The latest cycle marks the second upward revision in three months, following a ₹60 rise on 7 March. The 14.2-kg domestic cylinder rate has gone up by ₹29, while the 19-kg commercial cylinder rose by around ₹42. The revision on 1 June also affected commercial cylinder pricing, underscoring ongoing volatility in LPG pricing amid broader energy-market disruptions. According to PPAC data, LPG consumption fell 20% to 2.13 million tons this year compared with FY25, reflecting softer domestic demand and global supply constraints.
From a policy perspective, government statements emphasize diversification of LPG sourcing. Before the war, imports from West Asia (through the Strait of Hormuz) accounted for 90% of India’s LPG supply; by April this share had declined. The US now supplies around 33% of India’s LPG imports, up from 8% in February, according to a CRISIL report. This shift reduces exposure to Gulf-route disruptions, but does not fully erase risk. The government notes that Indians still pay among the lowest cooking-gas prices in the world, even after the latest hike, while the OMCs have been absorbing significant losses to cushion households.
How the latest price hike affects consumer budgets across major Indian cities: a city-by-city breakdown
After the latest revision, a 14.2-kg cooking gas cylinder still costs ₹942 in Delhi and ₹941.50 in Mumbai, while the 19-kg cylinder is priced at ₹3,113.50 in Delhi and ₹3,067.50 in Mumbai. Across other major cities, the 14.2-kg price sits around ₹968 in Kolkata, ₹957.50 in Chennai, ₹950.50 in Gurgaon, ₹939.50 in Noida, and ₹944.50 in Bengaluru. Note that some cities show only the 19-kg price in this update, reflecting data availability at the time of reporting; Bhubaneswar shows ₹3,290.00 for the 19-kg cylinder, and Bhubaneswar’s 14.2-kg price is not listed in this set. Chandigarh posts ₹951.50 for 14.2-kg and ₹3,136.00 for 19-kg, while Hyderabad sits at ₹994.00 for 14.2-kg and ₹3,367.00 for 19-kg. Jaipur, Lucknow, Patna, and Thiruvananthapuram close the list with ₹945.50, ₹979.50, ₹1,031.50, and ₹951.00 for 14.2-kg respectively, and ₹3,141.00, ₹3,236.00, ₹3,400.00, and ₹3,152.00 for 19-kg respectively.
What these numbers imply for households is nuanced. The Centre says the effective cost of supplying a 14.2-kg cylinder, based on the Saudi Contract Price, is over ₹1,600. Yet consumers pay ₹942 in many places, highlighting the subsidy and under-recovery dynamics that the government channels through OMCs. Additional Secretary Praveen Mal Khanooja notes that the government provides about ₹700 subsidy to non-Ujjwala consumers and ₹1,000 to Ujjwala beneficiaries, underscoring that the price signal is not a pure market outcome but a policy-funded adjustment. In this framework, the ₹29 price hike translates to roughly ₹1 per day for a family using 12 cylinders a year, or 20 paisa per day per household member. The Saudi CP, used as the global benchmark for LPG import pricing, has risen some 46% since the war began, reinforcing the cross-border linkages behind domestic price movements.
What the numbers mean for your investment lens: energy supply, subsidies, and stock-market implications
For investors tracking the energy complex, the LPG price trajectory is more than a cooking-gas headline. It signals how policy choices around subsidies, cross-subsidies, and import diversification feed into consumer prices and corporate margins. The 90% reliance on LPG imports before the war shows how sensitive domestic households are to international crude and feedstock prices. The shift in suppliers–US now contributing around a third of India’s imports by April–illustrates how geopolitics is shifting energy risk away from a single regional chokepoint, at least in part. For investors, this diversification matters because it can alter the risk profile of LPG-distribution players, household-supply chains, and even downstream packaging and retail operations.
A quick mental model for investors: price passes, subsidies, and portfolio resilience
Think of LPG pricing as a three-layer filter: the pass-through from international feedstock costs (Saudi CP, etc.), the subsidy layer that shelters households (₹700 or ₹1,000 depending on status), and the regulatory risk that comes from geopolitics and exchange-rate dynamics. If you own energy or consumer staples stocks, test how much price pressure the sector can absorb before margins compress. A simple mental model: if the policy environment bleeds a larger subsidy tail or if import-diversification continues, margins in distribution and retail could stabilize sooner than expected; otherwise, markets may price in a higher risk premium. Investors should watch how OMCs manage losses per cylinder and how this interacts with their stock-valuation frameworks. And if you want a structured, data-driven approach, Swastika’s Sarthi AI stock assistant can help you run scenario analyses on any stock or index with these energy-price drivers in mind.
FAQ
What caused the June LPG price hike in India?
Domestic LPG cylinder prices were increased by ₹29 on 7 June, marking the second rise in three months after a ₹60 revision on 7 March. The 19-kg commercial cylinder price rose by around ₹42 in the latest revision.
How do city-wise LPG prices look as of 22 June for 14.2-kg and 19-kg cylinders?
In Delhi, 14.2-kg is ₹942.00 and 19-kg is ₹3,113.50. In Mumbai, 14.2-kg is ₹941.50 and 19-kg is ₹3,067.50. In Kolkata, 14.2-kg is ₹968.00 and 19-kg is ₹3,255.50. In Chennai, 14.2-kg is ₹957.50 and 19-kg is ₹3,283.00. In Bengaluru, 14.2-kg is ₹944.50 and 19-kg is ₹3,198.00. The table lists additional cities with their respective 14.2-kg and 19-kg prices; some cities show only the 19-kg price if data is unavailable.
What is the share of LPG imports and how has diversification progressed in India?
LPG imports account for about 90% of India’s supply. Diversification has progressed since the war; the US now supplies around 33% of India’s imports, up from 8% in February, while West Asia’s share declined. Data cited reflect government and CRISIL analysis.
What subsidies apply to LPG for non-Ujjwala and Ujjwala beneficiaries?
The government provides about ₹700 subsidy to non-Ujjwala consumers and ₹1,000 to Ujjwala beneficiaries. The effective cost of a 14.2-kg cylinder is stated as over ₹1,600 based on the Saudi Contract Price.
What should retail investors watch when LPG prices remain volatile?
Investors should monitor energy-price pass-through, subsidy budgets, and import-diversification impact on margins. The price drift creates risk and opportunity in energy-related equities and consumer staples; use scenario analysis to assess how subsidy changes and import mixes affect stock valuations.
Conclusion
In the near term, the price revisions in LPG offer a practical reminder of how energy costs shape household budgets and corporate margins, especially in price-sensitive markets across India. The latest data show a 14.2-kg price of ₹942 in Delhi and a 19-kg price of ₹3,113.50 in Delhi, alongside a citywise spread that reflects both subsidy policy and import diversification. For retail investors, this is a case study in how geopolitical shocks translate into consumer costs and local market risk across geographies–from Delhi to Patna, from Hyderabad to Bengaluru. The question isn’t only about what a cylinder costs today, but how evolving supply chains, subsidies, and global liquidity conditions alter the risk and opportunity in energy-linked equities.
Open your trading and demat account here

Jio IPO: Date, Valuation, Review and Complete Investor Guide
Jio Platforms Limited, the parent company behind Reliance Jio, is India's largest telecom operator with over 524 million customers. But calling it just a telecom company undersells what it actually is. Beyond mobile and broadband connections, Jio also runs a growing stack of digital apps, enterprise services, and a serious push into artificial intelligence. It is trying to become India's homegrown version of a global technology giant, not just a phone network.
On June 19, 2026, Jio filed its Draft Red Herring Prospectus, setting up what is expected to be the largest IPO in Indian history. Unlike many headline IPOs that are simply existing investors cashing out, this one works differently. Jio itself will raise the money, and it already knows exactly what it plans to do with it.
This guide breaks down everything a potential investor needs to know, in simple language, with every number explained rather than just listed.
JIO IPO - Key Takeaways
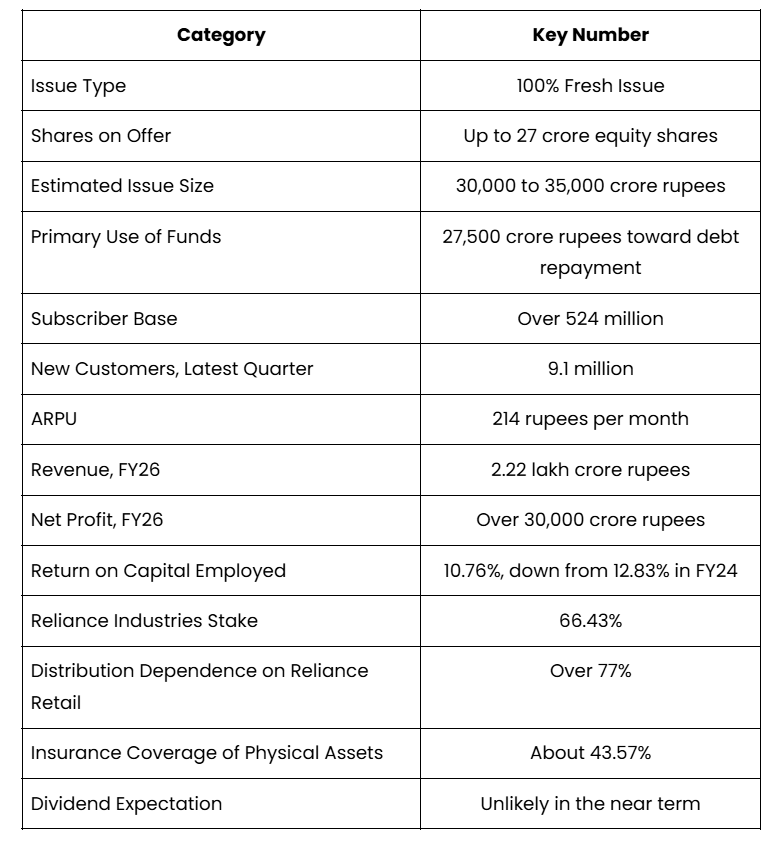
- Jio's IPO is a fresh issue of up to 27 crore shares, expected to raise around 25,000 to 33,000 crore rupees. There is no offer for sale, so no existing shareholder is selling stock.
- Most of the money raised, 27,500 crore rupees, will go toward paying off debt at Jio's telecom subsidiary, reducing interest costs and strengthening the balance sheet.
- Jio added 9.1 million new customers in a single quarter and crossed 30,000 crore rupees in annual profit for the first time in FY26.
- A close look at the numbers shows a business growing fast in revenue but slowing in capital efficiency, return on capital employed has fallen from 12.83% to 10.76% over two years.
- Reliance Retail alone accounts for more than 77% of Jio's prepaid distribution, making the business unusually dependent on a single sister company.
- Jio is significantly under-insured for a company of its size, with insurance covering only about 43.57% of its physical assets.
- Investors should not expect dividends any time soon. Returns here would come entirely from the share price rising over time, not from regular payouts.
JIO IPO Snapshot - The Complete IPO Detail
Forget the size of the number for a second and focus on the structure, because it explains everything else.
There are two ways a company can raise money through an IPO. It can let existing shareholders sell off part of their stake, in which case the company itself sees none of that cash. Or it can issue fresh shares, where the money lands directly in the company's own account. Jio has chosen the second route entirely. Every rupee from this offer goes to Jio Platforms itself, not to Reliance Industries, not to its early backers, nobody.
That single fact reframes the whole IPO. This isn't an exit for anyone. It's a fundraise, and a tightly targeted one at that. Here are the core facts of the offer at a glance (Jio DRHP).
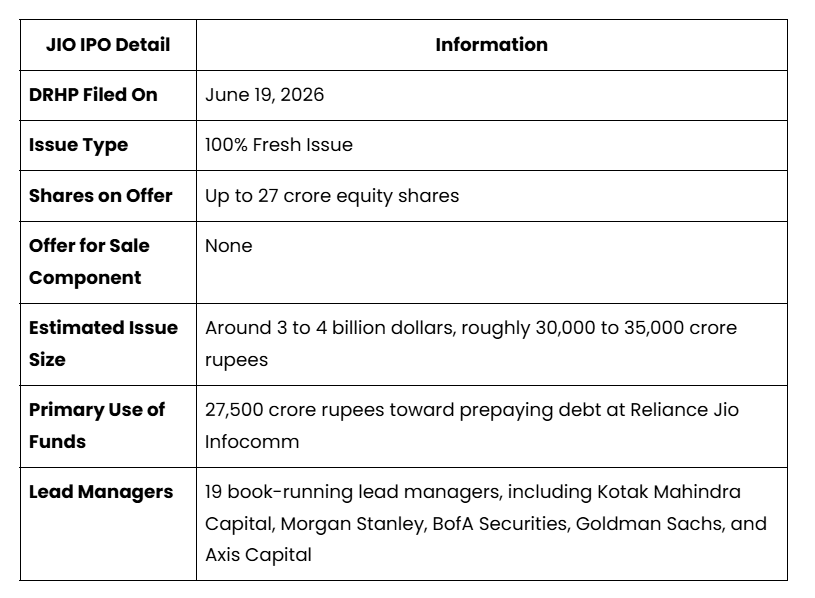
The special reservation for Reliance Industries shareholders deserves attention. If you already hold RIL shares in your demat account, you will have preferential access to this IPO through a dedicated quota. This is not standard practice and is worth checking before the issue opens.
Where is the IPO Money Actually Going
This is one of the more reassuring parts of Jio's IPO story for investors, because the company has been very specific about its plans.
- The single biggest use of funds, 27,500 crore rupees, will go toward repaying External Commercial Borrowings, which are loans Jio's telecom arm took from a consortium of major global and Indian banks, including Bank of America, HSBC, DBS, Mizuho, State Bank of India, Citibank, and ANZ.
- As of March 2026, Jio's total outstanding borrowings stood at approximately 30,057 crore rupees, meaning this IPO would clear most of that debt in one go.
- Paying down this debt reduces the interest expense Jio pays every year, which directly improves how much of its revenue eventually turns into profit.
- The company has framed this prepayment as a way to free up financial room for its next phase of investment, particularly in 5G, 6G, and artificial intelligence infrastructure.
In simple terms, this IPO is about strengthening the balance sheet first, before pushing harder into new growth areas. A company with less debt has more flexibility to invest aggressively when opportunities come up, without being weighed down by interest payments.
How the Shares Will Be Divided Among Investors
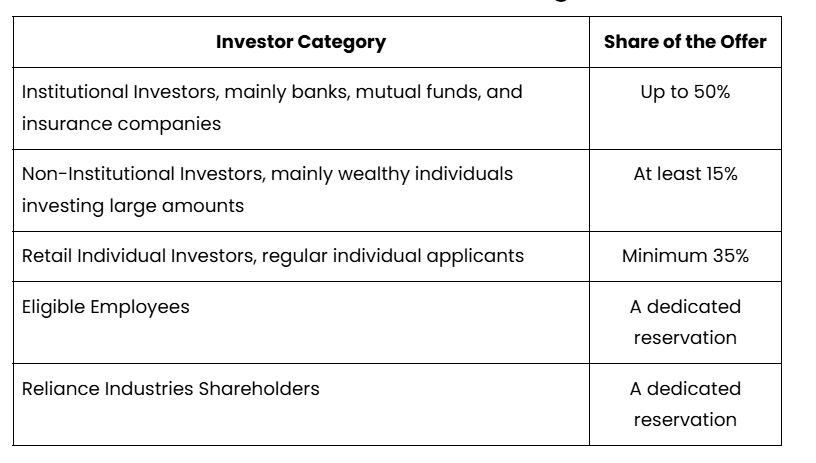
Two reservations here are worth pointing out specifically. Jio has set aside a dedicated portion for its own employees, a common practice that rewards staff for the company's growth. More notably, there is also a dedicated reservation for existing shareholders of Reliance Industries, Jio's parent company. This means if you already own Reliance Industries shares, you may get a preferential shot at this IPO, a detail current Reliance investors should not overlook.
What Jio's Business Actually Looks Like Today
Jio is best understood as three layers stacked on top of each other, not a single product.
- The connectivity layer: This is the core telecom business most people know, mobile data, calling, and home broadband through JioFiber and JioAirFiber. With more than 524 million subscribers, this remains India's largest telecom customer base by a wide margin.
- The digital platforms layer: This includes a range of apps and digital services that sit on top of the network, designed to keep customers engaged within Jio's ecosystem rather than just paying for a data connection.
- The enterprise and future technology layer: This is where Jio is investing most heavily for the future, including artificial intelligence infrastructure, 6G research, and its own Low Earth Orbit satellite project aimed at providing connectivity from space, an answer to growing competition from satellite-based internet providers.
This layered structure is exactly why Jio describes itself as moving from a telecom company toward what it calls a new-age technology enterprise. The phone network funds the business today, but the company's ambitions clearly extend well beyond it.
Jio's Financial Performance, FY26
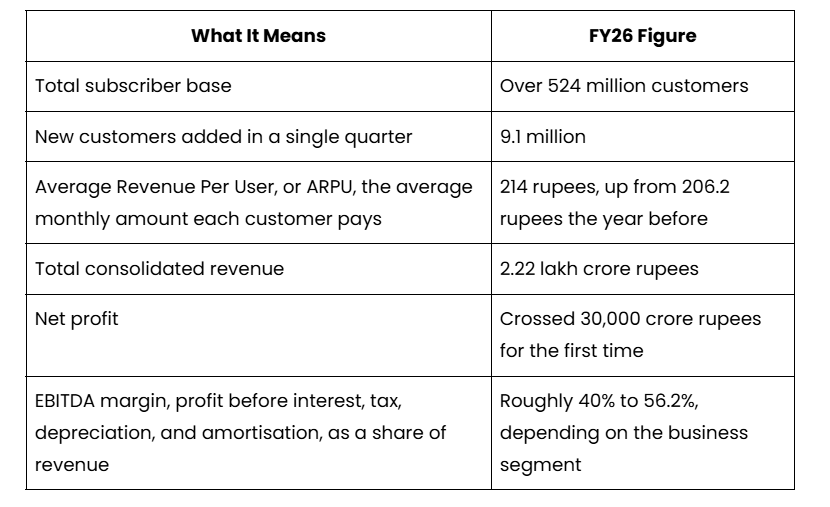
A couple of these numbers deserve a bit more explanation. ARPU rising from 206.2 rupees to 214 rupees might look like a small change, but across more than 524 million users, even a small increase adds up to a meaningful jump in revenue. It also tells investors that Jio is not just adding customers, it is getting each existing customer to pay slightly more over time, often by upgrading them to better data plans or bundled services.
The wide EBITDA margin range, from roughly 40% up to 56.2%, reflects the fact that Jio's different business lines do not all earn at the same rate. Its newer digital and enterprise services tend to carry higher margins than the core mobile network, so as those businesses grow as a share of the total, overall profitability could improve further.
A Closer Look at Capital Efficiency, the Number That Needs Context
This is the one statistic in Jio's story that genuinely needs careful explanation, because on its own it can sound more alarming than it should.
Return on Capital Employed, or RoCE, measures how much profit a company generates for every rupee it has invested in its business. Jio's RoCE has declined from 12.83% in FY24 to 10.76% in FY26. Taken alone, a falling RoCE usually raises a red flag, since it can mean a company is not using its money as efficiently as before.
In Jio's case, the more likely explanation is the sheer scale of its ongoing investment. The company has been spending heavily on 5G rollout, fibre infrastructure, and now 6G and AI capabilities, all of which require enormous upfront capital before they start generating meaningful returns. When a company invests faster than its profits can grow to match, RoCE naturally dips, even if the underlying business is healthy and the investments eventually pay off.
The honest way to read this number is as a signal to watch, not necessarily a warning sign on its own. Investors should track whether RoCE stabilises or continues falling in the next year or two, since that will reveal whether this recent spending is starting to convert into proportional profit growth.
Expert Insight: Jio IPO Could Be a Key Value Unlock for Reliance’s Next Growth Phase
Santosh Meena, Head of Research, Swastika Investmart, featured in Business Standard, highlights that Jio’s IPO marks an important milestone in Reliance’s transformation from a traditional energy company into a technology-led enterprise.
He also mentioned, “The AGM reinforces Reliance’s transition from traditional energy to a tech-energy-retail powerhouse. The Jio IPO is the near-term catalyst for value unlocking. Long-term growth levers in AI, green energy, and consumer businesses signal sustained high-teens earnings growth potential, though execution risks in capex-heavy new areas and commodity volatility remain.”
He concludes, Jio’s IPO, combined with its AI initiatives, satellite broadband ambitions, and digital ecosystem expansion, could become a significant growth driver. However, investors should continue monitoring execution, capital allocation, and the ability of these new-age businesses to deliver sustainable returns.
Major Stakeholders of Jio
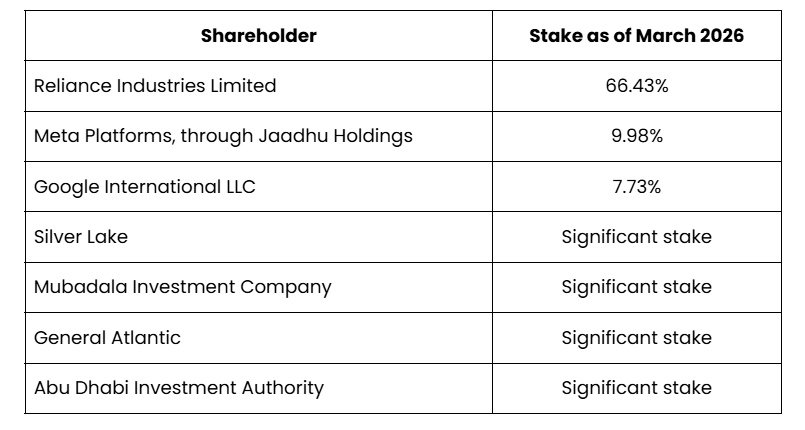
None of these shareholders is selling in this IPO. That fact alone is worth understanding in the right light. Meta and Google invested in Jio years before this listing was even a possibility. They remain fully invested today. The same is true of some of the world's most sophisticated sovereign wealth and private equity funds.
These are not passive investors. They have access to Jio's internal data, its long-term plans, and its competitive position in ways that outside investors do not. Their collective decision to hold, rather than use this IPO as an exit opportunity, suggests they continue to see significant value ahead.
Why Jio's Business is Hard to Replicate
- Scale that took over a decade to build: With more than 524 million subscribers, Jio has a customer base that took years of aggressive investment and pricing strategy to build, something a new entrant could not realistically replicate quickly.
- A growing, increasingly profitable customer base: Adding 9.1 million customers in just one quarter while also raising average revenue per user shows Jio is growing in both directions at once, more customers and more revenue from each one.
- A genuine technology pipeline beyond telecom: Investments in AI infrastructure, 6G research, and satellite connectivity position Jio to compete in markets well beyond traditional telecom, a transition most telecom companies globally have struggled to make successfully.
- Backing from world-class global investors: Having Meta, Google, and some of the largest investment funds in the world as long-term shareholders lends Jio a level of credibility and access to expertise that few Indian companies can match.
- A debt position about to improve significantly: Once this IPO clears roughly 30,000 crore rupees of borrowings, Jio's balance sheet becomes meaningfully lighter, freeing up cash flow for future investment instead of interest payments.
Key Risks Investors Should Know Before Applying
No IPO is without risk, and Jio has a few that deserve genuine attention before applying.
- Capital spending is outpacing returns for now: As explained above, RoCE has fallen from 12.83% to 10.76% over two years, meaning Jio's massive investments have not yet translated into proportionally higher profits. This needs to reverse over time for the investment case to fully play out.
- Heavy reliance on one sister company for distribution: Reliance Retail accounts for more than 77% of Jio's prepaid distribution. This level of dependence on a single related party, rather than a broader, more independent distribution network, is an unusual concentration for a company of this size.
- Significant under-insurance of physical assets: Jio's insurance coverage for material damages stands at about 1.37 lakh crore rupees, which covers only 43.57% of its total tangible assets and ongoing construction value. Major assets like spectrum and certain infrastructure rights are excluded entirely, meaning more than half the physical value of its network is effectively uninsured if something goes wrong.
- Real-world infrastructure can fail: A two-hour outage in Gujarat during FY26 was a reminder that a business this dependent on uninterrupted network performance is vulnerable to server failures and fibre cuts, incidents that directly affect millions of customers at once.
- Regulatory costs could rise: The telecom sector is closely regulated by TRAI and the Department of Telecommunications. Jio currently pays a license fee equal to 8% of its adjusted gross revenue, and any increase in this fee, or unfavourable changes to how that revenue is defined for tax purposes, could directly affect profitability.
- New technology could disrupt the model: Jio's JioAirFiber service relies on unlicensed band radio spectrum, which is shared with other users. As more people use this spectrum, signal interference can increase in ways Jio cannot legally control, potentially weakening the fibre-like experience it promises customers. Separately, the broader shift toward satellite-based internet is a long-term competitive threat the company is actively trying to get ahead of through its own satellite plans.
- No dividends expected soon: Investors should not expect regular income from this stock in the near term. Any return on investment would have to come from the share price rising over time, not from periodic payouts.
A Quieter Conflict Worth Knowing About
There is one detail that does not get much attention but is worth understanding. Jio's aggressive push into home broadband through JioAirFiber puts it in direct competition with two other companies in the broader Reliance Group, Hathway, and Den Networks, which together serve about 16.74 million broadband and cable subscribers. Since these are separately listed companies with their own minority shareholders, this overlap creates a level of internal competition within the same corporate family, something investors in any of these entities should be aware of when evaluating long-term strategy.
How This IPO Fits Into India's Bigger Picture
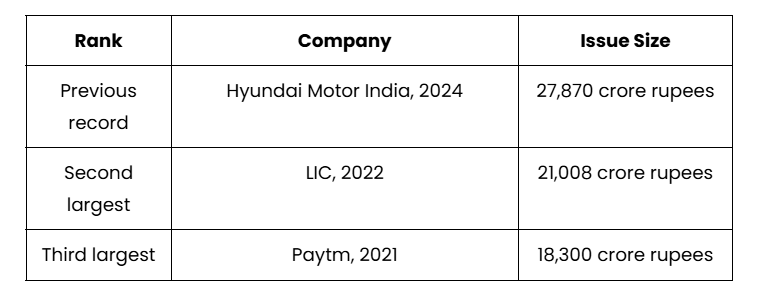
If Jio's issue size meets expectations, it would not just be large, it would reset the record books entirely. According to Financial Express, the JIO IPO will break the record of India’s biggest IPO. Here is how it would compare to India's previous biggest IPOs.
Since FY20, 56% of all new investors entering India's stock market have been under the age of 30. This younger demographic grew up with Jio data in their pockets. They are comfortable with the brand, comfortable with digital investing, and represent the single largest new cohort of retail participants in the history of Indian markets.
This context matters because it shapes who will be applying for this IPO and holding it afterwards. A younger, longer-horizon investor base is generally more tolerant of the kind of growth and reinvestment story Jio is telling than an older cohort seeking dividends and near-term returns would be.
Final Outlook: Is Jio Worth Considering
Jio comes into this IPO in a genuinely strong position. Over half a billion paying customers, growing revenue per user, a profit milestone crossed for the first time, and a purpose-built plan to use this money to clean up the balance sheet rather than simply fund vague expansion.
The company's ambition is real and backed by serious global investors who are not selling. Its technology roadmap, spanning 5G, 6G, AI infrastructure, and satellite connectivity, positions it to compete in markets that do not yet exist at meaningful scale in India today. And the fresh issue structure means the money raised strengthens the company itself.
But several risks deserve genuine weight and not just a mention. The declining return on capital employed is the most important number to track going forward. The 77% distribution dependence on Reliance Retail is an unusual structural concentration for a business this large. The insurance coverage gap on physical assets represents a real exposure that could matter enormously in a bad scenario. And the absence of any dividend means patience is not just advisable but mandatory.
This is a serious, long-term investment case built on genuine scale and genuine ambition. It is not a quick listing gain story. Investors who approach it expecting fast returns based on brand name alone may find themselves waiting longer than they anticipated.
The right approach is to wait for the final Red Herring Prospectus and the confirmed price band, read the complete risk factors section rather than skipping it, and invest only what you are comfortable holding through the volatility that any large, hyped listing will inevitably see in its early months.
Make your investment decisions wisely, and where you need guidance specific to your financial situation, consult a qualified financial advisor. For more IPO research, market updates, and investment insights, visit Swastika Investmart.
—---------------------------------------------------------------------------------------------------------------------------------------------------------------------------
JIO IPO - Quick Reference
RBI Bank Holidays June 26-28, 2026: What Indian Retail Investors Should Know
Key Takeaways
- RBI calendar shows three bank holidays in the week of June 22-28, 2026.
- Banks will be closed on June 26, 27, and 28; digital banking continues normally.
- Plan branch visits and transfers ahead of these dates; align investments accordingly.
- Use Swastika's Sarthi AI for stock research during holiday weeks.
As June edges toward its second half, Indian bank customers face a three-day pause on branch-based activities. The Reserve Bank of India's holiday calendar shows the week of June 22-28, 2026 will see public and private sector banks across the country close for three days–on June 26, June 27 and June 28. Digital banking will remain available, ensuring you can manage accounts, move funds, and track investments without interruption. For retail investors, this isn't just a scheduling exercise–it's a chance to plan, adjust, and stay on top of your financial moves before the doors close.
RBI bank holidays June 22-28, 2026: which dates will branches be closed?
According to the RBI holiday calendar, banks across both public and private sectors will observe holidays for three days during the week of June 22 to June 28, 2026. The designated holiday dates are June 26, June 27, and June 28. On these days, physical bank branches will be closed, and customers won't be able to conduct in-branch services. However, digital banking services will continue to function normally, enabling online transactions and account management as usual. In practice, this means you should wrap up any branch-based tasks–like cash deposits, loan applications, or cheque-related activities–before or after these dates to avoid delays. If you plan to visit a branch for a specific service, check well in advance and, if possible, schedule ahead of time or simply complete the task via digital channels before the holiday window. Major lenders–including State Bank of India (SBI), ICICI Bank, and HDFC Bank–will follow the RBI calendar nationwide during this period.
Digital banking during RBI holidays: what stays open and what doesn't
While branches close, your digital channels remain active. The RBI holiday calendar ensures digital banking services will function normally during the June 22-28, 2026 week. This means you can still access internet banking, mobile app transfers, bill payments, and general account management without interruption. This continuity is especially valuable for retail investors who rely on timely access to account information, real-time fund movements, and status updates for investments. Keep in mind that while digital services remain available, some external services (merchant networks or third-party payment aggregators) may experience slower processing times during holiday windows. If you had planned a fund transfer to your trading or investment accounts, consider initiating it before the holiday period or scheduling it for the first business day after the holidays to ensure timely settlement. In short, digital banking continues to operate, padding the gap created by branch closures for these dates.
Practical steps for retail investors planning around the RBI holiday calendar
Even with digital channels operating, investors should build a simple, proactive plan. Here are practical steps tailored for retail investors in India:
- Finish all essential branch-based tasks before June 26, or schedule them for the days immediately before or after the holiday week.
- When relying on bank transfers to fund investment accounts, consider initiating transfers through online banking ahead of the holiday window or immediately after the holidays.
- Set reminders to review any pending payments, post-dated transactions, or scheduled transactions that depend on branch hours.
- Keep a close eye on market-related account balances and statements using online banking apps to avoid surprises when the market reopens.
For SBI, ICICI Bank, and HDFC Bank customers, the same RBI calendar applies nationwide, so your local branch will observe the same closures whether you are in Mumbai, Delhi, Bengaluru, or Chennai. Even though branches pause operations, the digital banking layer remains your primary channel for planning, paying, and staying on top of your finances during June 22-28, 2026.
Investment planning during RBI bank holidays: how to stay on track
Bank holidays can influence the timing of cash flows that fund trading accounts or investments. Because branches are closed for three days, any essential cash deposits or cheque-based arrangements should be completed ahead of the closure window, or you should wait for the next business day after the holidays. Retail investors who use online transfers to fund their trading or mutual fund accounts may have access to digital channels; still, it is prudent to confirm the exact cutoff times with your bank and broker prior to the holiday period. Having funds ready in advance reduces the risk of missed opportunities when markets resume activity after the long weekend. In the weeks around the RBI holiday calendar, you might also use the time to re-evaluate watchlists, review earnings trajectories, and prepare for the post-holiday market environment using reliable research tools.
FAQ
What are the RBI bank holidays for June 2026 and when do they occur?
According to the RBI holiday calendar, banks across public and private sectors will observe three holidays during the week of June 22-28, 2026, with the dates June 26, June 27, and June 28 designated as holiday dates. Digital banking services remain available during this period.
Will digital banking be available during the RBI bank holidays?
Yes. Digital banking services will continue to function normally during the June 22-28, 2026 period, even as physical branches are closed on June 26-28.
Which banks are affected by the RBI holiday calendar in June 2026?
Public and private sector banks in India are affected by the RBI holiday calendar, including major lenders such as State Bank of India (SBI), ICICI Bank, and HDFC Bank, which will observe closures on the specified dates.
How should retail investors plan around these holidays?
Plan essential branch tasks before June 26 and use digital channels for most banking needs during the holiday week. If you need to fund investments, consider initiating transfers before the holiday window or immediately after the markets reopen, depending on your bank's processing times.
Where can I learn more about RBI's holiday calendar?
Consult the official RBI holiday calendar for authoritative dates and guidance; Swastika Investmart will also share timely updates aligned with official announcements.
Conclusion
For the retail investor, RBI bank holidays in June 2026 are a built-in feature of the calendar–an opportunity to pre-plan, verify all critical actions, and ensure your digital channels remain your primary tool for everyday banking and basic investment tasks. The closures on June 26, 27, and 28 mean you should align your financial calendar accordingly and use the digital channel to manage accounts, transfers, and basic investments during the holiday window. The next step is to map your own banking and investment schedule against the RBI holiday calendar and to build a tiny, practical mental model: complete essential branch-based tasks before the holiday, fund your digital transactions ahead of the window, and resume normal operations the moment markets reopen.
Open your trading and demat account here

Jio Platforms IPO Plan & June 22 Stock Catalysts in India
TLDR
- Jio Platforms' IPO plan moves ahead with the DRHP approval.
- Bharat Forge bags ₹425 crore MoD order for Navy gas turbine generators.
- Chennai Petroleum earns Navratna status, boosting autonomy for investments.
- Lloyds Enterprises buys 17.98% in Steel Infra Solutions for ₹1,073 crore; Wipro increases stake in Aggne Global IT Services by 20%; Il Jin Electronics to acquire 37.5% of Ascent for ₹328 crore; Krishna Institute of Medical Sciences completes QIP by issuing 1.9 crore shares at ₹755.
June 22 could become a directional inflection point for Indian equities, driven by a string of post-market disclosures that touch Reliance Industries, defence manufacturing, energy refining, and IT services. The core driver is the confirmation that Jio Platforms has initiated the process for its proposed initial public offering, with the board having approved the draft red herring prospectus. The plan to submit the offer document to market regulators signals a step toward what could be one of the largest public offerings in India. The announcements were disclosed in a regulatory filing and are expected to keep traders focused on Monday as the market absorbs the implications across multiple sectors. For retail investors evaluating risk and opportunity, this is a moment to reassess exposure to large-cap energy and technology names, while watching how regulators respond to one of the country’s most anticipated listings. If you want structured, AI-assisted stock research to parse these catalysts, Swastika Investmart’s Sarthi can help tailor insights to your portfolio.
Jio Platforms IPO Plan: what Reliance's board approval signals for the Indian equity universe
The primary thrust is a formal move from a major conglomerate’s technology platform toward a public market listing. Reliance Industries informed exchanges that Jio Platforms has initiated the process for its proposed initial public offering. During the company’s 49th Annual General Meeting, the chairman stated that the board of Jio Platforms had approved the draft red herring prospectus. The company plans to file the offer document with market regulators, and the listing is expected to be one of the largest in Indian history. Investors should monitor regulatory feedback, possible competitive responses, and the timing risk around a mega IPO. This development is a macro-level signal about investor appetite for large technology-enabling platforms and diversified tech ecosystems within India. The timing of the filing aligns with a broader IPO window that could benefit other tech and consumer platforms with robust growth stories.
Bharat Forge: ₹425 crore MoD contract expands defence manufacturing exposure
Bharat Forge has secured a ₹425 crore contract from the Ministry of Defence to supply gas turbine generators for the Indian Navy. This order strengthens the company’s presence in the defence manufacturing segment and adds to its existing order book, which could support earnings visibility and further order inflows from defence and related sectors. For investors, the contract underscores a growth vector tied to state-led defence prioritization and domestic manufacturing incentives. Such orders can bolster cash flow visibility and support a higher multiple for a company with a diversified industrial footprint. This is an after-hours development that could influence Monday’s price action, especially in the aerospace and defence-component supply chain.
Chennai Petroleum Corporation Navratna upgrade: operational autonomy and investment flexibility
Chennai Petroleum Corporation received Navratna status from the government, a classification that grants greater operational and financial autonomy for investments and strategic decisions. This upgrade can improve the speed and scale of capex and strategic initiatives, potentially improving the downstream refiner’s competitiveness and expansion capabilities. For retail investors, Navratna status can signal strengthened governance and resource allocation advantages, which may translate into steadier capital expenditure, enhanced project execution, and potential long-term upside in earnings power. Market watchers will note how this upgrade interacts with the company’s refining economics, geopolitical oil-price sensitivity, and government policy supports for public-sector energy players.
Lloyds Enterprises’ ₹1,073 crore Steel Infra Solutions stake: implications for steel sector exposure
Lloyds Enterprises announced the acquisition of a 17.98% stake in Steel Infra Solutions for ₹1,073 crore. This sizeable investment is aimed at expanding the company’s footprint in steel-related businesses and could reflect a broader shift toward integrated steel solutions, infrastructure services, and allied sectors. Investors should consider how this stake alignment may influence the growth trajectory of Steel Infra Solutions, including potential cross-selling, project wins, and scale-up in steel-processing capabilities. The deal underlines rising capital deployment in steel infrastructure, a sector sensitive to both private investment cycles and government-led infrastructure plans.
Wipro’s 20% stake in Aggne Global IT Services: implications for IT services consolidation
Wipro completed the purchase of an additional 20% stake in Aggne Global IT Services, increasing Wipro’s ownership in the company following its earlier investment in February 2024 through Wipro and Wipro IT Services LLC. This move signals ongoing consolidation in the IT services ecosystem and could improve execution capabilities, client access, and scale in niche niches that Aggne specializes in. For investors, the step-up in ownership may imply stronger synergies, more predictable revenue streams, and potential cross-sell opportunities across Wipro’s broader IT services portfolio. The market will watch for any accompanying guidance on margins, headcount strategy, and integration milestones.
Il Jin Electronics’ 37.5% stake in Ascent (Amber Enterprises) for ₹328 crore: electronics manufacturing ecosystem
Il Jin Electronics will acquire a 37.5% stake in Ascent, a subsidiary of Amber Enterprises, for ₹328 crore. This acquisition is positioned to strengthen the electronics manufacturing ecosystem by expanding collaboration across components and assembly capabilities. For investors, this could imply improved supply-chain resilience and potential synergies in electronics manufacturing services, aligning with India’s push to broaden domestic electronics production under Make in India initiatives. Watch for the integration plan and how this stake aligns with Amber Enterprises’ existing capabilities and customer base.
BCL Industries: Bathinda distillery fire and business continuity planning
BCL Industries reported a fire incident involving an ethanol tanker at its Bathinda distillery. The company stated that no casualties were reported and the fire was brought under control. An assessment of the financial impact is currently underway. In the near term, investors should monitor the status of production, insurance recoveries, and any operational disruptions, as well as management’s plan for business continuity and safety upgrades.
Kirloskar Oil Engines’ Hyper Next order: data centre infra pipeline
Kirloskar Oil Engines received a major order from Hyper Next for supplying infrastructure solutions for large-scale data centres, adding to its industrial business pipeline. Such orders align with the growing demand for reliable power and infrastructure components in data centre ecosystems, offering revenue visibility and potential margin expansion if execution proceeds smoothly. Investors will want to track execution milestones and any accompanying contract expansions tied to hyperscale data-centre deployments.
Goodluck India ₹255 crore order for defence-related long-range empty shells: strategic diversification
Goodluck India has secured a ₹255 crore order for manufacturing long-range empty shells, thereby diversifying its defence-related business portfolio. This order indicates a shift toward diversification within the defence supply chain, potentially improving risk dispersion across product lines and customer bases. Retail investors should consider how this diversification interacts with Goodluck India’s core business and capital allocation strategy.
Black Box approval to raise up to ₹2,500 crore: implications for equity capital raising
Black Box received approval to raise up to ₹2,500 crore through the issue of securities. This planned fund-raising could provide the company with capital to accelerate growth initiatives, pursue acquisitions, or strengthen its balance sheet. For investors, the key questions will be around the use of proceeds, dilution impact, and the market’s read on the company’s growth plan, as well as how this capital raise interacts with market liquidity and appetite for new issues.
Karur Vysya Bank MCLR up 10 basis points: borrowing costs and lending dynamics
Karur Vysya Bank increased its MCLR by 10 basis points across tenures. A higher MCLR can translate into marginally higher borrowing costs for borrowers tied to these benchmarks, with potential ripple effects across the bank’s loan book and net interest margins. Investors should monitor the bank’s credit quality trajectory and any accompanying guidance on loan growth and treasury management as the policy environment evolves.
Krishna Institute of Medical Sciences QIP: 1.9 crore shares at ₹755 and share dilution
Krishna Institute of Medical Sciences completed its qualified institutional placement (QIP), allotting 1.9 crore shares at ₹755 apiece. This flood of new equity can provide capital for expansion, research, or debt reduction, but it also brings dilution for existing shareholders. Market participants will assess the use of funds and the company’s growth roadmap, particularly in the private healthcare segment that KIMS focuses on.
FAQ
What major corporate actions were announced after market close on Friday, June 19 that could influence Monday's trading?
Key updates include Reliance Industries' Jio Platforms IPO plan with the board approving the draft red herring prospectus; Bharat Forge securing a ₹425 crore MoD contract for gas turbine generators; Chennai Petroleum Corporation receiving Navratna status; Lloyds Enterprises acquiring a 17.98% stake in Steel Infra Solutions for ₹1,073 crore; Wipro increasing its stake in Aggne Global IT Services by 20%; Il Jin Electronics acquiring a 37.5% stake in Ascent for ₹328 crore; BCL Industries reporting a fire at its Bathinda distillery with no casualties; Kirloskar Oil Engines securing a data-centre infrastructure order from Hyper Next; Goodluck India securing a ₹255 crore order for defence long-range shells; Black Box getting approval to raise up to ₹2,500 crore; Karur Vysya Bank raising MCLR by 10 basis points; and Krishna Institute of Medical Sciences completing a QIP allotting 1.9 crore shares at ₹755 each.
What is the Navratna status, and which company gained it in this news cycle?
Chennai Petroleum Corporation received Navratna status from the government, a classification that grants greater operational and financial autonomy for investments and strategic decisions.
What are the specifics of the Lloyds Enterprises deal and why does it matter for Steel Infra Solutions?
Lloyds Enterprises announced the acquisition of a 17.98% stake in Steel Infra Solutions for ₹1,073 crore, aimed at expanding Lloyds’ footprint in steel-related businesses and signaling growth in steel infrastructure investments.
What happened with Krishna Institute of Medical Sciences' QIP, and what does it imply for investors?
Krishna Institute of Medical Sciences completed its qualified institutional placement, allotting 1.9 crore shares at ₹755 per share. This infusion of capital can support expansion and growth, but it also introduces dilution for existing shareholders.
Which other major capital movements occurred, and how might they influence sector performance on Monday?
Besides the Jio Platforms IPO plan, other notable moves include Wipro’s additional 20% stake in Aggne Global IT Services, Il Jin Electronics’ 37.5% stake acquisition in Ascent for ₹328 crore, and Black Box’s approval to raise up to ₹2,500 crore. Additionally, Karur Vysya Bank raised MCLR by 10 basis points across tenures. Sector-wise, IT services, electronics manufacturing, and banking may experience heightened interest as investors assess growth visibility, capital deployment, and the implications of new debt costs.
Conclusion
In a market environment where one night of corporate updates can ripple into a full week of trading, it pays to segment catalysts by sector and assess how each line item interacts with capital flows and risk appetite. The Jio Platforms IPO plan sets the stage for a potential wave of large listings, while defence contracts, Navratna upgrades, and strategic stake moves provide concrete revenue and growth signals across multiple industries. For the retail investor, the prudent approach is to diversify exposure while prioritizing quality franchises with visible earnings trajectories and controllable risk. A practical next step is to run a scenario test: what if Jio Platforms lists at a premium, what is the implied impact on IT and consumer tech peers, and how do the new capital moves reshape the relative valuations of steel, IT services, and healthcare names? Use this mental model to guide your next investment check-in.
Open your trading and demat account here

Brent Above $82: Delhi Petrol & Diesel Prices (June 2026)
Key Takeaways
- Brent crude rose above $82 as Hormuz tensions resurfaced and US-Iran talks paused.
- Delhi's petrol price is ₹102.12 per litre and diesel ₹95.20 per litre.
- Petrol under-recoveries fall to ₹3 per litre; diesel to ₹27 per litre.
- Oil prices remain the main driver of Indian petrol and diesel rates, with taxes and currency playing a supporting role.
Brent crude climbed above $82 a barrel as renewed tensions around the Strait of Hormuz and uncertain U.S.-Iran negotiations rattle the energy markets. Meanwhile, domestic fuel prices in India stayed unchanged on Monday, June 22, despite a fresh rise in global crude. According to data from the Ministry of Petroleum and Natural Gas, petrol in Delhi remained at ₹102.12 per litre and diesel at ₹95.20 per litre. This juxtaposition–global price movements paired with local price stability–is a reminder to retail investors that energy markets are shaped by both international geopolitics and domestic tax policy. Here is what this means for you as a retail investor in India, including how to interpret under-recoveries and what to watch next in oil markets.
How Brent Crude Above $82 Influences Indian Petrol and Diesel Prices in Delhi
Brent crude's move above the $82 threshold is not just a headline; it's an indicator of potential pass-through to domestic fuel prices. The increase was driven by renewed geopolitical tensions in West Asia and the prospect of disruptions to oil shipments through the Strait of Hormuz. While the price at the pump in Delhi remained stable on June 22, the broader trend matters for the trajectory of petrol and diesel across the country as oil supply dynamics tighten and prices swing. In India, despite the global move, domestic petrol and diesel prices reflect a combination of global crude, rupee-dollar exchange rate, central excise duty, and state-level value-added tax. The Ministry of Petroleum and Natural Gas notes that under-recoveries–losses recovery by oil marketing companies–have eased significantly, a development that can cushion the pump prices in the short term, even as crude remains volatile.
As Brent crude price movements influence import costs for Indian refiners, the government and market participants monitor the energy supply chain closely. The news that Brent crude rose as much as 2.2% to trade above $82 a barrel and that West Texas Intermediate crude crossed the $78 mark highlights the scale of global risk being priced into energy markets. Negotiations between the United States and Iran–held in Switzerland–saw setbacks when Iranian media reported that discussions paused following Trump's warning to consider tolling oil shipments via the Strait of Hormuz. This geopolitical backdrop matters because India imports a large portion of its crude; thus, any sustained rally in Brent tends to put upward pressure on domestic fuel costs, all else equal.
But how does this translate into the price you see at the pump? In the current data snapshot, retail prices have risen by ₹7.50-₹8 per litre since the onset of tensions, but the daily price in Delhi stayed flat on June 22. The reason lies in the interplay between world prices and local taxes and policy. The rupee-dollar exchange rate is a crucial piece of the puzzle, as is the central excise duty and state-level VAT that adds to the final per-litre cost. In other words, oil price volatility is a driver, but the exact pass-through path depends on local tax regimes and currency movements.
Petrol and Diesel Price Snapshot in Delhi
These numbers come from the Ministry of Petroleum and Natural Gas and illustrate the current pass-through of global crude costs into Indian consumer prices, as mediated by government policy and local tax regimes. The lower under-recoveries indicate that oil marketing companies are bearing smaller losses in the petrol market, which can show up as less drag on consumer prices in the near term. For a retail investor, this is relevant because it speaks to the likely medium-term price stability or volatility in fuel costs, which in turn can affect energy-related equities and funds.
Delhi Petrol Price Today: What ₹102.12 Means for Retail Investors
What does a petrol price of ₹102.12 per litre in Delhi mean for you as a retail investor? It means you have a real-world data point that connects global energy markets to your day-to-day expenses and to the performance of energy sector equities. For equity investors, one key takeaway is to monitor how long such price levels persist and what policy responses follow. If crude prices stay elevated, refiners' margins can come under pressure or improve depending on how pass-through unfolds through the price chain. In this snapshot, domestic price stability on June 22 occurs despite a Brent price above $82 and WTI above $78, underscoring that the price path is not a straight line from Brent to Delhi pump price. The exact pass-through is shaped by a confluence of global supply risks, currency movements, and Indian tax policy.
From an investment perspective, the 102.12/95.20 price pairing for petrol and diesel in Delhi becomes a reference point to track energy equities and energy-linked funds. If you are evaluating energy plays, you should check how the sector’s earnings sensitivity responds to crude price changes and to the government’s tax stance. Historical patterns show that the pass-through tends to squeeze refiners’ margins if crude remains high for an extended period, but supportive under-recoveries can cushion the immediate impact on pump prices. The current data shows that under-recoveries for petrol have fallen to ₹3 per litre from ₹24 per litre on April 1–a reduction of 83%–and diesel losses have fallen to ₹27 per litre from ₹105 per litre, a 75% decline. These shifts can affect stock price behavior for oil marketing companies and the broader energy sector, so you should consider how much of the macro risk is already priced into the stock prices you hold or plan to buy.
How Under-Recoveries for Oil Marketing Companies Affect Consumer Fuel Costs
The term under-recoveries refers to the gap between the actual costs of crude and the price at which fuel is sold to consumers. When under-recoveries are high, oil marketing companies (OMCs) incur losses on petrol and diesel sales, which can be offset by government subsidies or recoveries through other channels. The latest data from the Ministry of Petroleum and Natural Gas shows that under-recoveries on petrol have come down to ₹3 per litre from ₹24 per litre on April 1, an 83% reduction. In the case of diesel, losses have come down to ₹27 per litre from ₹105 per litre, representing a 75% decline. This easing of OMC losses reduces the pressure on retail prices to rise quickly and, at the same time, helps support refiners’ margins during times of higher crude costs. For a growth-focused retail investor, this can signal that near-term price volatility may ease, potentially reducing the risk premium assigned to energy stocks in some market scenarios.
The market's reaction to under-recoveries going down is nuanced. On one hand, lower losses can reduce the political and policy pressure to adjust pump prices aggressively, providing a steadier price environment for households and businesses. On the other hand, if crude prices rise again due to geopolitical tensions or supply disruptions, OMCs can still be exposed to higher costs that could re-emerge as pass-through in prices. The dual reality–lower current under-recoveries and potential future pass-through–means that investors should approach the energy space with a balanced view, considering both the macro oil price trajectory and the policy instruments that govern domestic retail fuel pricing.
Geopolitical Tensions in West Asia: Implications for India’s Energy Supply and Oil Prices
The Strait of Hormuz remains a strategic chokepoint for global crude flows. Iran’s statements about the strategic waterway being shut following Israeli attacks in Lebanon, and the possibility that U.S. action could toll oil shipments via the Strait of Hormuz, add to the volatility in global energy markets. The timing is important: as global security concerns rise, traders price in the risk premium, which can push crude prices higher. For India, a net importer of crude, these prices translate into more expensive imports, pressuring domestic pump prices and potentially impacting consumer inflation. Yet, the same data from the Ministry of Petroleum and Natural Gas remind us that pass-through is not instantaneous and is mediated by exchange rates, taxes, and the efficiency of price transmission through the supply chain.
The Swiss-hosted talks between U.S. and Iranian officials were reported to have paused after Trump’s warning, complicating the path toward normalizing trade routes. While such diplomatic developments do not determine everyday prices instantly, they shape expectations and the risk environment for global commodities. Investors should monitor how shipments through the Strait of Hormuz evolve and how any disruption could affect Brent and WTI, and thus the Indian energy complex. A change in these dynamics can affect sector performance across oil marketing companies, upstream producers, and downstream refiners, creating both challenges and opportunities for energy-focused portfolios.
Key Drivers of Fuel Price Formation: Rupee-Dollar, Taxes and Central Policy
Beyond global crude prices, the rupee-dollar exchange rate remains a critical driver of domestic fuel costs. A weaker rupee makes imports more expensive, exerting upward pressure on India’s petrol and diesel prices. Local taxes–specifically central excise duties and state-level VAT–also shape the final retail price at the pump. The same dataset confirms that different cities sport different price levels due to these varying local tax regimes. So while the global price signal from Brent is important, it is filtered through a domestic tax-and-currency lens that determines the exact price you pay per litre in your city.
In the current scenario, the Delhi price point acts as a case study for how this transmission works. The petrol price remains at ₹102.12 per litre, diesel at ₹95.20 per litre, even as Brent trades above $82. This is not a contradiction; it reflects the interplay of pass-through delays, tax pass-through rules, and the government’s policy stance on under-recoveries and price stabilization. Investors oriented to the energy sector can use this lens to assess the risk-reward profile of energy equities: if crude stays elevated for longer, refiners and OMCs can maintain healthier cash flows, but tax policy can cap how quickly price gains propagate to consumers.
What Retail Investors Should Watch Next: Oil Price Trends and Stock Exposure
As you plan your next investment moves in the energy space, the current data point highlights a broader framework for decision-making. First, watch the Brent/WTI trajectories. A sustained move above $82 plus a stable or weakening dollar could push domestic fuel costs higher, even if the current Delhi price remains unchanged for a moment. Second, observe the currency dynamic–the rupee-dollar exchange rate acts as a major multiplier for import costs, and a weak rupee could worsen the pass-through to pump prices. Third, monitor the government’s stance on under-recoveries and tax policy–any shifts in central excise duties or state VAT can alter the price pass-through, affecting both consumer prices and energy-sector profitability.
For retail investors evaluating exposure to energy stocks, this is where a disciplined approach matters. Use a framework that weighs global crude price signals alongside domestic tax policy and currency movements. Short-term price spikes can create volatility in energy equities, but longer-term trends will depend on supply stability, demand growth, and the ability of policymakers to manage pass-through dynamics in a way that preserves affordability for consumers while ensuring the viability of oil marketing companies and refiners. If you’re looking for institutional-grade research to support stock selection, Swastika offers Sarthi – an AI stock assistant that provides research insights on any stock or index to retail investors. This tool can help you test scenarios across price paths, currency shocks, and policy shifts to refine your energy portfolio strategy.
FAQ
What is the current Delhi petrol price per litre on June 22, 2026?
Petrol in Delhi is ₹102.12 per litre and diesel is ₹95.20 per litre, according to data from the Ministry of Petroleum and Natural Gas.
What are the diesel and petrol under-recoveries as of June 22, 2026?
Petrol under-recoveries are ₹3 per litre; diesel under-recoveries are ₹27 per litre.
How much did petrol and diesel prices rise in the latest price revision?
The latest increase was petrol ₹2.60 per litre and diesel ₹2.70 per litre.
What primarily drives Indian petrol and diesel prices?
Global crude prices, rupee-dollar exchange rate, central excise duty, and state VAT determine domestic pump prices, with the Ministry of Petroleum and Natural Gas providing the underlying data.
Why are prices different across Indian cities?
Because local taxes in different states and cities cause price variations in Delhi and other cities.
Conclusion
The near-term outlook for Indian petrol and diesel prices sits at the intersection of global oil price signals, domestic tax policy, and exchange-rate dynamics. Brent crossing above $82 and WTI above $78 signals heightened risk in energy markets, but the current Delhi prices of petrol at ₹102.12 per litre and diesel at ₹95.20 per litre show that pass-through is not monotone and can be buffered by under-recoveries and tax design. Retail investors should view this as a reminder that external geopolitical developments and policy choices together shape the price path you see at the pump and in energy equities. The ongoing easing of under-recoveries (petrol ₹3 per litre; diesel ₹27 per litre) provides a buffer in the near term, but the risk of a fresh price impulse remains if crude continues to climb or if supply disruptions escalate.
Open your trading and demat account here

India Stock Market Outlook: Nifty50 Range 23,800–24,200 and Sensex at 76,803
Key Takeaways
- Sensex closed at 76,802.90 and Nifty50 at 24,013.10 after a volatile week.
- Nifty50 trades in 23,800–24,200 range with immediate support 23,850–23,800 and resistance 24,150–24,200; a break below 23,800 could push toward 23,500.
- FII inflows around Rs 3,400 crore and DII inflows around Rs 7,100 crore provided market support amid volatility.
- Rupee at 94.32 per USD; Brent at 80.57 and WTI around 77.54; RSI 58 and ADX DI- crossing DI+ signal caution.
The week delivered a sharp reminder: Indian equities can swing on global headlines even after a strong run. The Sensex settled at 76,802.90 and the Nifty50 closed at 24,013.10, after both indices had surged as much as 5% across the previous five trading sessions. For retail investors, the question is not just what happened today, but what comes next in a market defined by geopolitical headlines, macro data, and shifting flows. Here is a practical, price-focused read on what these levels imply for your portfolio and how to navigate the coming sessions with discipline.
What the Sensex close at 76,802.90 and Nifty50 close at 24,013.10 tell you about near-term market direction
The close numbers anchor the near-term narrative: Sensex at 76,802.90 and Nifty50 at 24,013.10 mark a consolidation phase after a run higher. The index remains below key short- and long-term moving averages, and the RSI has slipped below 40, signaling bearish momentum in the immediate term. The ADX indicator shows DI- has crossed above DI+, reflecting growing seller dominance. Yet the broader momentum isn’t uniformly negative; the index has to reclaim momentum on the upside to sustain a fresh leg higher. In practical terms, retail investors should watch whether price action can reclaim the 20-day EMA and the 50-day EMA as proof of renewed buying interest, and avoid chasing moves that break below major support levels without confirmation.
How to read Nifty50's immediate support and resistance: 23,800–23,850 and 24,150–24,200
From a technical standpoint, the near-term range is well defined. Immediate support sits in the 23,850–23,800 band, which coincides with both the 50-day EMA and the 50% Fibonacci retracement of the latest rally. A decisive break below 23,800 could push the index toward the next support around 23,500, opening more downside. For resistance, 24,150–24,200 aligns with the 100-day EMA and is likely to cap gains in the short run. A sustainable move above 24,200 would improve bullish sentiment and could open the path toward 24,500 in the near term. This setup argues for a cautious, range-trading mindset rather than aggressive breakout plays until there is a clear price-action signal.
The 27,050–27,000 zone and 28,250–28,300 zone: what they imply for the medium term
Despite the current price residing around 24,000, the longer-term chart highlights meaningful structural levels. The 27,050–27,000 zone is described as a crucial support region in the broader context, while 28,250–28,300 represents a meaningful resistance barrier above the current range. For retail investors, this implies markets may stay in a wide range for the intermediate term, with meaningful breakout requiring sustained participation from global funds and a favorable macro backdrop. The upshot is a reminder to spread risk and prepare for two-way moves rather than chase a single directional bet from here.
Rupee movement and RBI measures: how currency moves influence Indian equity returns
The rupee closed at 94.32 per dollar after a volatile session, with an intraday high of 94.21 as traders trimmed long-dollar positions before global and domestic cues took hold. Gains from the unwinding of long-dollar positions were offset by weakness in regional currencies and index-related outflows. RBI measures introduced two weeks ago aimed at attracting dollar inflows appear to support the rupee in a risk-on backdrop, but the overarching dynamic–global dollar strength versus local flows–keeps currency moves a key variable for Indian equities. For retail investors, this means that currency movements will often interact with earnings visibility and export-led sectors in ways that aren’t always predictable, so hedging and diversification remain important tools.
FII net buying and DII support: what flows say about sentiment
Foreign institutional investors turned net buyers during the week, bringing cumulative inflows of around Rs 3,400 crore. Domestic institutional investors continued to purchase around Rs 7,100 crore, providing steady market support during periods of volatility. This dual flow pattern suggests a broader risk-appetite stabilization and a willingness among both foreign and domestic participants to maintain exposure to Indian equities amid geopolitical tensions and oil-price volatility. Retail investors can take this as evidence that the market environment remains data-driven and liquidity-driven rather than fragile, though individual stock risk remains.
What momentum indicators are signaling for the near term
Technical setup indicates a mixed but cautiously constructive backdrop. The broader Nifty trend remains positive as the index trades above its 20-day and 50-day EMAs. The daily RSI sits at 58 and remains above its nine-day moving average, signaling underlying momentum is still favorable despite consolidation. However, the ADX indicator shows DI- crossing above DI+, which points to rising seller strength in the absence of a decisive price action to the upside. In practical terms, this combination advises traders to favor stocks with strong earnings visibility and to use price action around the EMA clusters as a guide for entry and exit, rather than relying solely on momentum alone.
Oil, geopolitics, and global risk appetite: why crude prices matter for Indian stocks
Global headlines continue to influence risk appetite in Indian markets. Brent crude prices advanced 0.9% to close at 80.57 per barrel, while West Texas Intermediate futures were around 77.54 earlier in the day. Although a 60-day ceasefire framework between the United States and Iran aimed to facilitate negotiations, tensions persisted after Iran’s IRGC announced the closure of the Strait of Hormuz. The U.S. military stated that commercial shipping traffic remained uninterrupted. Brent and WTI movements add a layer of energy-price risk to equities, particularly for industrials and energy-linked stocks, and a sustained rise in oil prices can compress margins for import-dependent sectors while benefiting energy exporters. Retail investors should consider these macro energy dynamics when evaluating sector allocations and stock-level exposure.
Putting it all together: practical steps for Indian retail investors
Against this composite backdrop, a disciplined, risk-conscious approach is prudent. Favor high-quality names with robust balance sheets and recurring earnings, and be mindful of concentration in IT or energy sectors that can experience outsized moves in volatile weeks. IT heavyweights such as Infosys, TCS, Tech Mahindra, and HCL Tech tumbled as much as 7% in the session, underscoring the need for diversification and risk controls. A practical way forward is to use clearly defined stop losses, limit leverage, and allocate capital in a way that aligns with your risk tolerance and investment horizon. If you want precise, stock-level research aligned to your risk profile, consider Swastika Investmart’s Sarthi – an AI stock assistant that delivers institutional-grade research for retail investors. Learn how Sarthi can tailor ideas and risk controls to your portfolio here: https://www.swastika.co.in/sarthi.
FAQ
What do the Sensex close of 76,802.90 and Nifty50 close of 24,013.10 indicate for near-term market direction?
The close indicates consolidation after a prior rally and suggests caution unless prices reclaim key moving averages; momentum indicators point to potential downside pressure unless price action strengthens.
Where are the immediate support and resistance levels for Nifty50, and how can they guide trading?
Immediate support sits around 23,850–23,800, coinciding with the 50-day EMA and 50% retracement. Immediate resistance sits around 24,150–24,200, aligning with the 100-day EMA. A break below 23,800 could target 23,500, while a move above 24,200 could aim for 24,500.
How do FII net buying and DII support affect sentiment in this environment?
FII inflows totaling around Rs 3,400 crore and DII purchases around Rs 7,100 crore indicate broad institutional support despite volatility, signaling that liquidity and risk appetite remain constructive for Indian equities in the near term.
What is the significance of the rupee level and oil prices for Indian stocks now?
The rupee closed at 94.32 per dollar with intraday highs around 94.21, influenced by RBI measures to attract dollars. Brent crude at 80.57 and WTI around 77.54 add macro headwinds, especially for energy-intensive sectors, making currency and commodity dynamics important considerations for stock selection and hedging.
What do RSI and ADX readings imply about near-term momentum?
RSI at 58 indicates continued momentum to the upside, but ADX shows DI- crossing DI+ signaling growing seller strength and a potential risk to price action without a reaffirmation above key moving averages.
Conclusion
For the retail investor, the story is less about chasing the next breakout and more about trading the range with discipline. The Nifty50’s near-term axis of 23,800–24,200, paired with the larger 27,000–27,050 support and 28,250–28,300 resistance anchors, points to a market that may continue to oscillate in the absence of a decisive macro signal. The immediate next step is to watch how prices behave around 23,800 and 24,200, and to adjust risk exposure accordingly using a probability-based framework that accounts for both global cues and domestic flows. In parallel, use a tool like Sarthi to refine stock ideas, risk controls, and time horizons so your decisions stay aligned with your financial goals and risk tolerance in this evolving environment.
Open your trading and demat account here
Big Budget


Popular Articles
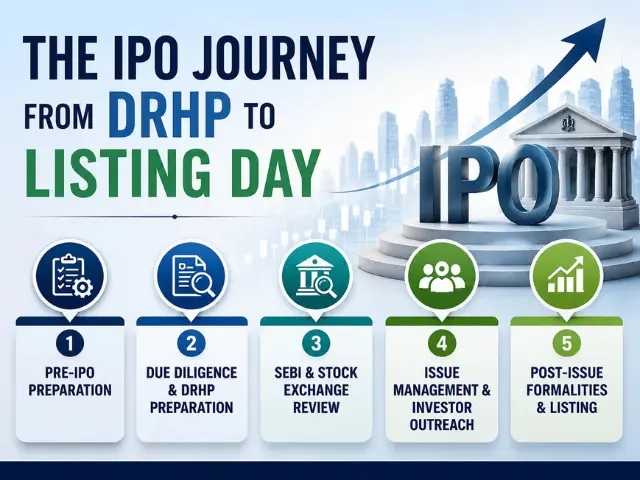


.avif)
.avif)

.avif)


START YOUR INVESTMENT JOURNEY
Get personalized advice from our experts
- Dedicated RM Support
- Smooth and Fast Trading App
