
Learning


What is a Circuit Breaker?
.webp)

A circuit breaker in the stock market is a mechanism that sets a price band within which a stock can be traded on a given day. Circuit breakers operate automatically by halting trading when global exchange values reach predetermined levels. This band includes a lower limit (lower circuit) and an upper limit (upper circuit).
Why is a Circuit Breaker Needed?
Stock prices often fluctuate due to market sentiments, influenced by positive or negative news. Circuit breakers are set up to prevent extreme price movements, protecting investors from sudden, unexpected changes. They also help reduce price manipulation to some extent.
The Securities and Exchange Board of India (SEBI) has defined various circuit levels: 2%, 5%, 10%, and 20%. These levels are based on the stock's closing price from the previous day.
Example:
If XYZ stock closed at ₹100 yesterday and has a 10% circuit limit, today it can only be traded between ₹90 (lower limit) and ₹110 (upper limit). If the stock reaches either limit, trading is halted.
How Circuit Breakers Work
In the trade world, a circuit breaker serves the same purpose as it does in residential electrical circuits. It engages and cuts the circuit when it senses an overload. Circuit breakers are emergency safeguards in the trading industry put in place by stock markets to temporarily or permanently halt trading activity when market prices decline drastically.
Individual Stocks:
If the price hits the upper or lower limit, trading in that particular stock is halted.
Market Indices:
A 10%, 15%, or 20% change triggers a market-wide halt.
Upper and Lower Circuit Limits
The limits prevent excessive speculation and volatility. Depending on the stock category, a stock can shift by 5%, 10%, or a maximum of 20% during a trading day.
Example of Upper Circuit and Lower Circuit
Let's say XYZ stock closed at ₹100 yesterday. If it has a 10% circuit limit:
- Upper Circuit: The upper limit would be ₹110 (10% above ₹100). If the stock price reaches ₹110, trading is halted because it has hit the upper circuit. This indicates strong buying interest, and the price can't go higher for the rest of the day.
- Lower Circuit: The lower limit would be ₹90 (10% below ₹100). If the stock price drops to ₹90, trading is halted because it has hit the lower circuit. This indicates strong selling pressure, and the price can't go lower for the rest of the day.
Market-Wide Circuit Breakers
Time-Based Rules:
- Before 1 PM: A 15% movement halts the market for 1 hour and 45 minutes, followed by a 15-minute pre-opening session.
- Between 1 PM and 2 PM: A 15% movement halts the market for 45 minutes, followed by a 15-minute pre-opening session.
- After 2 PM: A 15% movement halts the market for the rest of the day.
- At Any Time: A 20% movement halts the market for the entire day.
Summary Table of Circuit Breaker Durations

Conclusion
Circuit breakers play a important role in stabilizing the stock market by preventing excessive volatility and protecting investors from sudden, significant price changes.

Understanding Market Capitalization: Meaning, Importance
Ever wondered how much a company is "worth"? The answer lies in a key metric: Market Capitalization. In the stock market, it shows a company's total value based on its current share price and the number of shares available for trading. Instead of looking at revenue or total asset worth, investors use this number to assess a company's size. The market capitalization of a takeover candidate aids in evaluating whether the acquirer will receive a decent deal from the deal.
Formula:
Market Cap = Current Share Price * Total Outstanding Shares
So, if Company W share price is Rs. 200 and there are 5 crore outstanding shares, its Market Cap would be Rs. 1,000 crore (200 * 5 crore).
Why does it matters?
It gives you a snapshot of where a company stands:
- Growth Potential: A smaller company might be newer and have more room to grow, making it an attractive option for growth investors.
- Stability: Larger companies are more stable and less affected by market fluctuations. They often have more financial reserves to cover losses and recover from downturns.
- Risk and Volatility: Small-cap companies can offer high growth potential but come with higher risk and volatility. Large-cap companies are generally more stable but may grow more slowly.
Using Market Capitalization to Diversify Your Portfolio
Diversification is about spreading your investments to manage risk:
- Across Asset Classes: For example, investing in both stocks and bonds.
- Within Asset Classes: Investing in a mix of small-cap, mid-cap, and large-cap stocks to balance potential risks and returns.
Types of Companies
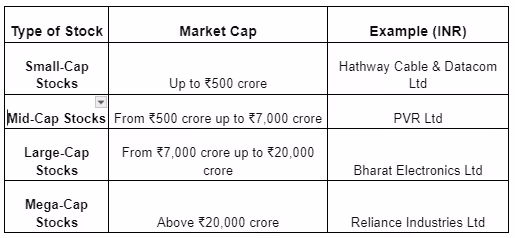
Companies are categorized into different types based on their market capitalization. This helps investors balance their portfolios to minimize risk.
Categories
Small-Cap Stocks
- Market Cap: Up to ₹500 crore.
- Growth Potential: Small-cap companies are often in their early stages and have growth potential. However, they are also more risky.
- High Risk, High Reward: These companies can offer high returns during favorable economic conditions but are more affected by market fluctuations and economic downturns.
- Examples: Hathway Cable & Datacom Ltd.
Mid-Cap Stocks
- Market Cap: From ₹500 crore up to ₹7,000 crore.
- Balanced Growth: Mid-cap companies have a balance between growth potential and stability. They are more established than small-cap companies but still have space for growth.
- Moderate Risk: These companies are less risky than small-caps but more volatile than large-caps. They can provide returns with moderate risk.
- Examples: PVR Ltd.
Large-Cap Stocks
- Market Cap: From ₹7,000 crore up to ₹20,000 crore.
- Stability: Large-cap companies are well-established and financially sound. They are market leaders with a proven track record.
- Lower Risk, Steady Returns: These companies offer more stability and are less likely to experience volatility. They are suitable for conservative investors seeking steady returns.
- Examples: Bharat Electronics Ltd.
Mega-Cap Stocks
- Market Cap: Above ₹20,000 crore.
- Market Dominance: Mega-cap companies are the largest and dominant in their industries. They are often multinational corporations with influence on the market.
- Very Low Risk: These companies provide the highest level of stability and are considered safe investments. While the growth potential might be lower, they offer reliable returns and are ideal for risk-avoid investors.
- Examples: Reliance Industries Ltd.
Conclusion
Market capitalization is an important factor in evaluating stocks and mutual funds. It helps investors take decisions based on their risk tolerance and return expectations. However, while it is a valuable indicator of a company’s financial health, investors should not rely solely on it. A thorough analysis of the company’s overall performance and market conditions is essential before making investment decisions.

How Do Election Results Impact the Indian Stock Market?
Elections are crucial events in any democracy, and India is no exception. The outcomes of elections can have significant impacts on the stock market. This blog explores how election results influence the Indian stock market and what the potential impacts of Prime Minister Narendra Modi’s third term could be.
Political Factors Affecting the Stock Market
Market Sentiment and Stability:
- Market Sentiment: Elections often bring a sense of uncertainty. Investors generally prefer stability, and election outcomes can either boost or reduce their confidence. If the results are in favor of a party or leader perceived to be business-friendly and stable, the market reacts positively.
- Policy Predictability: Stable governments are often able to implement policies more predictably. Investors like predictability as it reduces the risks associated with sudden policy changes.
Economic Policies:
- Pro-Growth Policies: If the elected government has a track record or a plan focusing on economic growth, infrastructure development, and business-friendly regulations, the stock market usually reacts positively.
- Reform Initiatives: Governments promising and delivering structural reforms (like tax reforms, deregulation, and infrastructure spending) can boost investor confidence and drive market rallies.
Fiscal Management:
- Budget and Spending: Election outcomes can impact fiscal policies. Governments that promise sensible fiscal management and reduced deficits tend to be favored by the markets.
- Spending Programs: Conversely, if a new government is expected to increase public spending significantly without a clear plan for managing the budget, it may cause concern among investors about inflation and fiscal health, potentially leading to market volatility.
Global Perception:
- Foreign Investments: Global investors closely watch Indian elections. A government perceived as stable and reform-oriented can attract more Foreign Direct Investment (FDI) and Foreign Institutional Investment (FII), positively influencing the stock market.
- Geopolitical Stability: Election results that contribute to regional stability or enhance diplomatic relations can positively impact the stock market.
Narendra Modi’s Potential Third Term and Its Impact
Prime Minister Narendra Modi, known for his strong leadership and decisive economic policies, could significantly impact the stock market if he secures a third term. Here’s how:
Continuation of Economic Reforms:
Modi’s government has been known for several landmark economic reforms such as the Goods and Services Tax (GST), Insolvency and Bankruptcy Code (IBC), and digitalization initiatives. A third term could mean the continuation and deepening of these reforms, providing a stable and predictable policy environment that is likely to be welcomed by investors.
Infrastructure and Development Projects:
Modi’s focus on infrastructure development, including projects like smart cities, improved transportation networks, and digital infrastructure, could continue. These initiatives can stimulate economic growth, create jobs, and increase demand in various sectors, positively influencing the stock market.
Foreign Investment and Economic Relations:
Under Modi’s leadership, India has improved its ease of doing business rankings and attracted significant foreign investments. A third term could further strengthen India’s global economic relations, encouraging more foreign investments and boosting market confidence.
Political Stability:
A third term for Modi could imply political stability, which is generally favorable for the stock market. Stability reduces uncertainty and helps in long-term planning for both domestic and foreign investors.
Focus on Technology and Innovation:
Modi’s government has also emphasized technology and innovation through initiatives like Digital India and Make in India. Continued focus in these areas could foster a more robust tech ecosystem, providing growth opportunities for tech stocks and start-ups.
Potential Risks:
Implementation Risks: While Modi’s policies are generally market-friendly, the actual implementation of large-scale reforms can sometimes face hurdles, leading to temporary market fluctuations.
Global Economic Conditions: The global economic environment can also impact the effectiveness of Modi’s policies. Trade wars, global slowdowns, or geopolitical tensions can affect market performance regardless of domestic policies.
Conclusion
Election results have a deep impact on the Indian stock market, primarily due to changes in market sentiment, policy direction, and fiscal management. A potential third term for Prime Minister Narendra Modi is expected to bring continued economic reforms, infrastructure development, and political stability, all of which are likely to positively influence the stock market. However, investors should remain mindful of implementation challenges and global economic conditions that can also affect market dynamics. As always, a balanced and insightful approach to investing is crucial in navigating the impacts of election results on the stock market.
Learn more about stock market with Swastika!

What is Prospectus?
A prospectus is a formal document that gives information about an investment offering to the public and is required by the Securities and Exchange Commission (SEC) to be filed. Bonds, mutual funds, and stock offers need the filing of a prospectus. Because it includes a wealth of pertinent information about the investment or security, the prospectus can assist investors in making better-informed investing decisions.
- Preliminary Prospectus
This is the initial offering document provided by the company. It contains most details about the business and the transaction. However, it doesn't include the number of shares or the price.
- Final Prospectus
This document provides all the details of the investment offering to the public. It includes background information, the number of shares or certificates to be issued, and the offering price.
Prospectus Example
In mutual funds, the prospectus covers objectives, investment strategies, risks, and performance, fees, and fund management details.
Requirements for Issuing a Prospectus
To issue a prospectus, a company must:
- File it with local regulatory bodies like SEBI and stock exchanges.
- It must be dated and signed.
- Include all necessary information outlined in the Companies Act 2013.
- Avoid providing misleading information.
Why Read a Prospectus? Here's Why It Matters:
An SEC-mandated prospectus gives investors crucial information regarding an offering of securities.
It disseminates risk information to the public and compiles important details about the investment and the business being invested in.
Investors should take into account the type and degree of risk involved, which is why those facts are usually included early in the prospectus and in more depth later on.
Investors want to know that the firm they are investing in is financially stable enough to fulfill its obligations, therefore the financial standing of the business is also crucial.
Types of Prospectuses
- Red Herring Prospectus: Filed with the registrar before offering shares. Usually lacks details like quantity or price.
- Abridged Prospectus: A brief summary with essential offer details. Must include all documents needed for purchasing the security.
- Deemed Prospectus: Considered deemed if it details the company’s investment offer to the public.
- Shelf Prospectus: Distributed by banks or financial institutions, containing details of multiple investment types.
Details Included in a Prospectus
A prospectus contains the following details:
- Company Information: Name, registered office address, objectives, and background.
- Offer Details: Number of shares or certificates to be issued, offering price, and any minimum subscription amount.
- Financial Information: Audited financial reports, including profit and loss statements, balance sheets, and cash flow statements.
- Management Details: Information about the company's directors, management team, and key personnel.
- Risk Factors: An overview of the risks associated with the investment, including market risks, regulatory risks, and operational risks.
- Legal and Regulatory Information: Details of any legal proceedings, regulatory compliance, and agreements relevant to the offering.
- Use of Proceeds: How the funds raised from the offering will be used by the company.
- Fees and Expenses: Details of any fees, expenses, or charges associated with the investment, including management fees and transaction costs.
- Offering Structure: Any special terms or conditions of the offering, such as underwriting arrangements or distribution channels.
- Other Relevant Information: Any additional information deemed relevant to investors, such as industry trends, competitive landscape, and future growth prospects.
Conclusion
By reading the prospectus carefully, you can:
- Compare different investment options.
- Spot any potential risks.
- See if the investment aligns with your goals and risk tolerance

What is a Covered Call? Overview of a Covered Call Strategy
As an investor, navigating the stock market can often involve balancing potential profits with risks. One strategy that stands out for its is the Covered Call Strategy. This approach allows you to generate income from your stock holdings Let's dive into what a covered call is and how this strategy can benefit you as an investor.
Understanding a Covered Call Strategy
Imagine you own shares of a company. You believe the stock may rise in the long run but don't expect gains in the near term. However, you still want to earn some income from these shares in the meantime. This is where a covered call strategy comes in
In a covered call strategy, an investor sells a call option on a stock they already own. This nets them a premium from the sale of the option. the call option is sold as an Out of The Money (OTM) call, meaning the option's strike price is higher than the current stock price. The call option would not get exercised unless the stock price increases above the strike price. Until then, the investor retains the premium as income, making this strategy attractive for those who are neutral to moderately bullish about their stock.
How a Covered Call Strategy Works
To use a covered call option strategy, you must first own the stock of a company. Let's assume you already hold the stock, showing a bullish movement. Over time, you become unsure about the stock's short-term upside potential and don't expect a significant price increase. Here's what you can do:
- Sell a Call Option: You sell a call option contract at a strike price higher than your stock's purchase price. The buyer of the call option pays you a premium for this contract.
- Collect the Premium: Regardless of whether the option is exercised, you keep the premium. This becomes your immediate income from the stock.
- Outcome Scenarios: After executing a covered call strategy, one of three scenarios can occur:some text
- Stock Price Remains Stable or Falls: The call option expires worthless, and you keep both the premium and your shares.
- Stock Price Rises Slightly: The stock price increases but remains below the strike price. The call option still expires worthless, allowing you to keep the premium and benefit from the stock's appreciation.
- Stock Price Rises Significantly: The stock price rises above the strike price. The call option is exercised, and you must sell your shares at the strike price. You keep the premium and receive the strike price for your shares, potentially missing out on further gains beyond the strike price.
When to Use a Covered Call
The covered call strategy works particularly well in the following situations:
Generating Income
The primary use of the covered call strategy is to generate income. If you own assets like stocks or ETFs that you're willing to sell at a certain price, selling a covered call can help generate additional income.
Neutral or Slightly Bullish Market
The covered call strategy is effective in a neutral or slightly bullish market. If you expect the price of an asset to remain relatively stable or increase slightly, selling a covered call can allow you to generate income while still owning the asset and benefiting from modest price increases.
Reducing Risk/Hedging
By selling a call option, you can theoretically limit downside risk if the price of the underlying stock falls. If the stock price drops below the strike price of the call option, the option will expire worthless, and you'll still own the underlying stock, which you can sell or hold for potential future gains.
When to Avoid a Covered Call
A covered call should be avoided in the following situations:
Expecting a Stock Price Rise
If you expect the stock to rise significantly in the near future, selling a covered call may limit your potential upside. It's better to hold onto the stock and let it appreciate.
Facing Serious Downside
If the stock looks like it's going to drop significantly, using a covered call to get extra cash might not be wise. In such cases, it’s probably best to sell the stock or consider short selling to profit from its decline.
Advantages of a Covered Call Strategy
- Generates Income: Covered calls generate income from holdings that wouldn't otherwise provide a cash flow stream.
- Adds to Returns: Investors periodically sell covered call options to enhance a position's return.
- Acts as a Hedge: A covered call offers some protection by reducing the breakeven price due to the premium.
- Low-Risk Strategy: Selling covered calls is easy and low-risk because the stock position "covers" the short call.
Conclusion
In summary, covered calls can be a strategy for investors looking for risk management and income generation. By merging stock ownership with the sale of call options, investors can increase their potential returns in a moderate appreciation of stock price. This strategy provides a balance between earning additional income and managing risks, making it a valuable tool for an investor.
Learn more about financial terminologies with Swastika!
How to Use Open Interest for Intraday Trading
What is Open Interest?
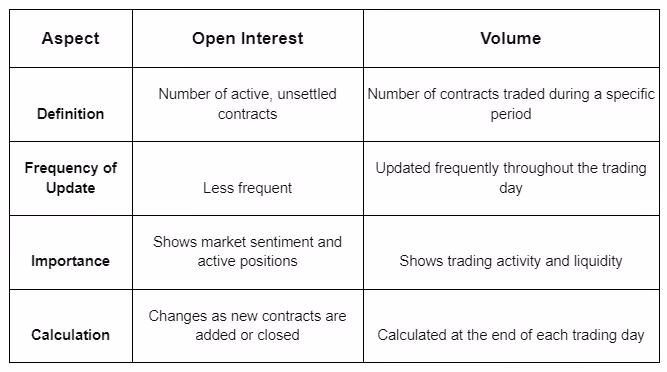
Open interest refers to the total number of outstanding options and futures contracts that have not been settled, closed out, or exercised. In simple terms, it's the number of active positions in options and futures contracts. For example, if a buyer and a seller enter into a new call option contract, open interest increases by one. Conversely, if the same buyer and seller close their contract by taking an opposite position, open interest decreases by one. If the buyer sells their contract to another buyer, the open interest remains unchanged, as there is no net change in open positions.
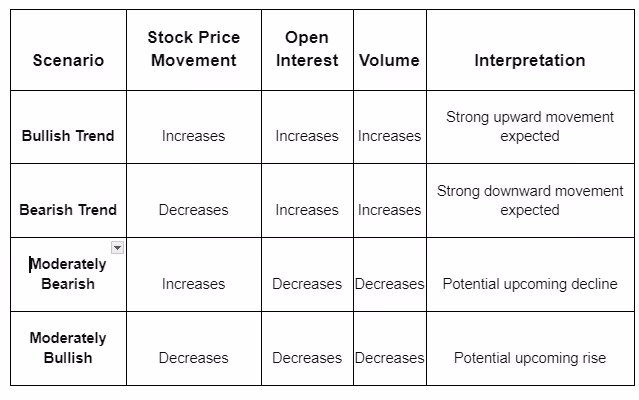
How to Use Open Interest for Intraday Trading
- Bullish Trend: If the stock price rises along with an increase in open interest and volume, it shows a bullish trend.
- Bearish Trend: If the stock price falls along with an increase in open interest and volume, it shows a bearish trend.
- Moderately Bearish: If the stock price rises but open interest and volume decrease, it shows a moderately bearish trend.
- Moderately Bullish: If the stock price falls but open interest and volume decrease, it shows a moderately bullish trend.
Open Interest vs. Volume
Importance of Open Interest
Monitoring open interest provides valuable insights for making decisions in financial markets. Here are some key points:
- Market Sentiment Indicator: Changes in open interest shows bullish or bearish sentiment of the market.
- Price Trend Confirmation: Rising open interest signal uptrends, while falling open interest may signal downtrends.
- Reversal Indication: Sudden changes in open interest can hint at trend reversals.
- Liquidity and Trading Activity: High open interest shows increased market liquidity and trading activity.
- Options Expiry Consideration: Important in options trading, helps in influencing decisions around expiry dates.
- Contrarian Indicator: Analyses extreme open interest situations for potential contrarian trading opportunities.
Example in INR
Suppose an investor is tracking a stock with the following details:
- Current Stock Price: ₹500
- Open Interest: 10,000 contracts
- Volume: 5,000 contracts
Conclusion
By analyzing open interest along with volume and price action, you can identify market trends. Once you've identified the trend, you can take appropriate positions. To get specific open interest data for an asset, use an open interest calculator, which is often available online for free.

Stock Market Vs Commodity Market
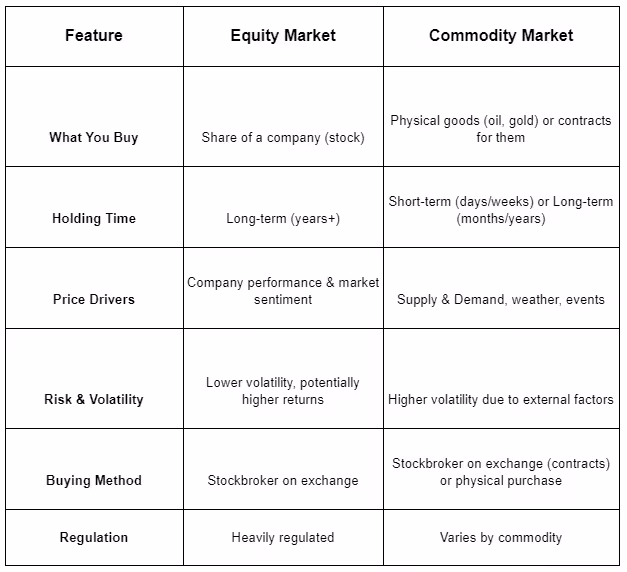
What is the Equity Market?
The equity market, commonly known as the stock market or share market, is a platform where people buy and sell shares of companies. In India, these shares are traded on stock exchanges or directly between individuals. To trade shares online in India, you need a "demat account" and a "trading account." These accounts function like digital wallets for your shares.
What is the Commodity Market?
Commodities are important resources that can be traded for other commodities of the same type. They are divided into two categories: hard commodities like gold and oil, and soft commodities like agricultural products and cattle. The commodity market is a place where these commodities are bought and sold, either physically or virtually. Investments in commodities can be made directly or through commodity futures contracts.
Key Differences: Equity Market vs. Commodity Market
Knowing the differences between these two markets can help you decide which one suits your investment goals better. Here are some key differences:
Performance Comparison
The stock market and commodity market can perform differently:
- Stock Market: Historically, the stock market has provided higher returns, with an average annual return of around 10% over the last 100 years.
- Commodity Market: The commodity market has averaged around 3% annual returns.
Factors influencing these markets differ as well. Stock market performance is driven by company earnings, economic growth, interest rates, and geopolitical events. Meanwhile, the commodity market is influenced by supply and demand factors like weather conditions, production levels, and geopolitical events.
Which Market Should You Choose?
Choosing between the stock market and the commodity market depends on your investment goals, risk tolerance, and investment horizon:
- Long-Term Growth: The stock market may be better for long-term growth and capital appreciation.
- Short-Term Speculation: The commodity market may be suitable for short-term speculation and hedging against inflation.
Both markets carry risks. The stock market is subject to market volatility and company-specific risks, while the commodity market is influenced by supply and demand factors and geopolitical risks. It's essential to conduct thorough research and consult with a financial advisor before making any investment decisions.
Example: Comparing Returns in INR
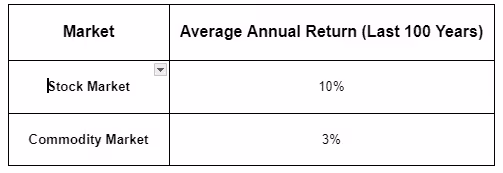
For instance, if you invested ₹1,00,000 in the stock market, you could expect an average return of ₹10,000 annually. In contrast, the same investment in the commodity market would yield around ₹3,000 annually.
Conclusion
Both the equity and commodity markets offer unique opportunities and risks. Understanding these differences and how each market works can help you make informed investment decisions. Whether you're looking for long-term growth in the stock market or short-term gains in the commodity market, it's crucial to align your investments with your financial goals and risk tolerance.

Understanding Commodity Transaction Tax (CTT): A Comprehensive Guide
In the realm of financial markets, various taxes and fees play a crucial role in regulating transactions and generating revenue for the government. One such tax that impacts commodity trading in India is the Commodity Transaction Tax (CTT). In this comprehensive guide, we will delve into the details of CTT, exploring its purpose, impact, and implications for traders and investors.
What is Commodity Transaction Tax (CTT)?
Commodity Transaction Tax (CTT) is a tax imposed by the Indian government on transactions executed on commodity exchanges. Introduced in the Finance Act, 2013, CTT is similar to the Securities Transaction Tax (STT) imposed on equity transactions. The primary objective of CTT is to generate revenue for the government and discourage speculative trading in commodity markets.
How Does CTT Work?
- CTT is imposed on the value of taxable commodities transactions conducted on recognized commodity exchanges in India. The tax rate varies depending on the type of commodity and the nature of the transaction. As of the latest guidelines, the following rates apply:
- CTT tax is 0.01% for non-agricultural commodities futures contracts and 0.05% for non-agricultural commodities options contracts. While agricultural commodities are exempt.
- CTT is typically collected by the commodity exchange at the time of the transaction and passed on to the government. It is applied to both buy and sell transactions, thereby impacting both buyers and sellers in the commodities market.
Purpose and Objectives of CTT
The imposition of CTT serves several purposes and objectives, including:
- Revenue Generation: CTT serves as a source of revenue for the government, contributing to the overall tax collection and fiscal management.
- Discouraging Speculative Trading: By imposing a tax on commodities transactions, especially in non-agricultural commodities, CTT aims to discourage speculative trading and promote more stable and orderly commodity markets.
- Level Playing Field: CTT helps create a level playing field between different asset classes by subjecting commodity trading to similar taxation as equity trading, where STT is applicable.
- Regulatory Oversight: CTT also serves as a regulatory tool, enabling authorities to monitor and regulate commodities transactions more effectively.
Impact of CTT on Traders and Investors
The imposition of CTT has several implications for traders and investors active in commodity markets:
- Cost of Transactions: CTT adds to the overall cost of trading in commodities, as traders are required to pay the tax on every transaction executed on the exchange.
- Impact on Trading Volumes: The introduction of CTT may have an impact on trading volumes in commodity markets, as it could discourage high-frequency traders and speculators from participating in the market.
- Risk Management: Traders and investors need to factor in the impact of CTT when creating their trading strategies and risk management plans. The tax can influence decision-making regarding position sizing, trading frequency, and holding periods.
- Market Liquidity: CTT may affect market liquidity in commodity markets, as it could lead to reduced trading activity and narrower bid-ask spreads.
- Compliance Requirements: Market participants need to ensure compliance with CTT regulations and reporting requirements to avoid penalties and legal repercussions.
Challenges and Criticisms of CTT
While CTT serves certain objectives, it has also faced criticism and challenges:
- Impact on Market Efficiency: Critics argue that CTT may hamper market efficiency by reducing liquidity and increasing transaction costs, especially for small investors and hedgers.
- Competitive Disadvantage: Some stakeholders believe that the imposition of CTT puts Indian commodity exchanges at a competitive disadvantage compared to global counterparts where similar taxes are not levied.
- Need for Review: There have been calls for a review of CTT rates and structures to ensure that they strike the right balance between revenue generation and market development.
Conclusion
In conclusion, Commodity Transaction Tax (CTT) is a tax levied on transactions conducted on commodity exchanges in India. It serves various purposes, including revenue generation, discouraging speculative trading, and promoting regulatory oversight. While CTT has implications for traders and investors in commodity markets, it also faces challenges and criticisms regarding its impact on market efficiency and competitiveness. As the commodities market continues to evolve, it remains essential for policymakers to review and adapt CTT regulations to ensure a balance between revenue objectives and market development goals.
Start Investing Today!

Trend Analysis in Share Market for Better Stock Picks
Spotting the Trend: How Trend Analysis Can Help You Pick Winning Stocks
The stock market can feel like a wild ride sometimes, with prices constantly going up and down. But what if you could predict these ups and downs, at least a little bit? Well, that's where trend analysis comes in!
What is Trend Analysis?
Trend analysis is like looking at the flow of the water. Is it uptrend? Is it sideways trend? Or is it downtrend?
By analyzing past price movements and trading volume, trend analysis helps you understand the overall direction of a stock's price. It is a technique used to examine data points over time to identify patterns and predict future movements.
Here's a breakdown of the key ideas:
- Data Points: This could be anything from stock prices to website traffic, depending on what you're analyzing.
- Patterns: By looking at past data points, you can see if there are any recurring trends, like prices going up and down in a specific cycle.
- Predictions: Based on the identified patterns, you can make an educated guess about what might happen in the future.
Types of Trends
There are three main types of trends in the stock market:
- Upward Trend (Bull Market Trend): Prices are generally moving higher over time. This is a good sign for investors looking to buy stocks.
- Downward Trend (Bear Market Trend): Prices are generally moving lower over time. This can be a time to be cautious or even sell some stocks.
- Sideways Trend: Prices are fluctuating within a certain range. This can be a time to wait and see before making a move.
How to Use Trend Analysis
There are many types of trend analysis tools and techniques, but here are two simple ways to get started:
- Moving Averages: This is a line on a stock chart that shows the average price over a certain period (like 50 days or 200 days). An upward sloping moving average suggests an uptrend, while a downward sloping suggests a downtrend.
Picture a line on a stock chart that shows the average price of a stock over a certain period, like the past 50 days or 200 days. If this line is going up, it means the average price is rising, suggesting the stock is on an uptrend. For example, if a stock's 50-day moving average is slowly increasing and is currently at ₹100, while the current price is ₹110, it indicates an uptrend. On the other hand, if the moving average is sloping downward and is at ₹100, while the current price is ₹90, it signals a downtrend.
- Support and Resistance Levels: These are price levels where the stock price has historically found difficulty breaking through. Support levels are areas where the price tends to bounce back up, while resistance levels are areas where the price tends to get rejected and fall back down. Imagine certain price points where a stock tends to bounce back up after falling (support) or struggles to break through and falls back down (resistance).
Let’s say a stock has a support level at ₹120. Whenever the price drops to ₹120, it tends to bounce back up because investors see it as a good buying opportunity. Similarly, if there's a resistance level at ₹150, whenever the price approaches ₹150, it struggles to go higher as investors start selling their shares, causing the price to fall back down.
How to Use Trends to Pick Stocks
Here's how you can use trend analysis to pick better stocks:
- Spot the Trend: First, find out if a stock is on the rise (uptrend) or falling (downtrend). That tells us if it's a good time to buy or sell.
- Double-Check: Use different tools to make sure you're seeing the trend right.
- Time Your Moves: Wait for the right moment to buy or sell.
- Stay Safe: Always have a plan to protect your money. Use stop-loss and take that much risk what you can afford to lose.
Trend analysis can be a powerful tool for stock pickers, but it's important to use it alongside other investment strategies. By understanding trends, you can increase your chances of making profitable investments.
Conclusion
Trend analysis is a valuable tool for identifying stock market movements and making informed investment decisions. By analyzing patterns, using moving averages, and identifying support and resistance levels, investors can spot potential opportunities. However, it should be combined with other strategies and risk management techniques for better results. Understanding trends can enhance decision-making and improve the chances of picking winning stocks.
Learn more about financial terminologies with Swastika!

Understanding the Different Types of Brokers in the Stock Market
Stock market investing can be a great way to grow your wealth, but it can also seem complicated, especially for beginners. One of the first decisions you'll need to make is who will help you navigate this exciting world: a full-service broker or a discount broker? Today, we'll be exploring the types of brokers you can choose when entering the exciting world of stock trading.
What is a Stock Broker?
Before we dive into the different types of stockbrokers, let's first understand what a stock broker actually does. A stockbroker is a professional who helps in the buying and selling of stocks and other securities on behalf of investors. They act as intermediaries between buyers and sellers in the stock market. Share market investment advisors and registered representatives (RRs) are other names for stockbrokers.
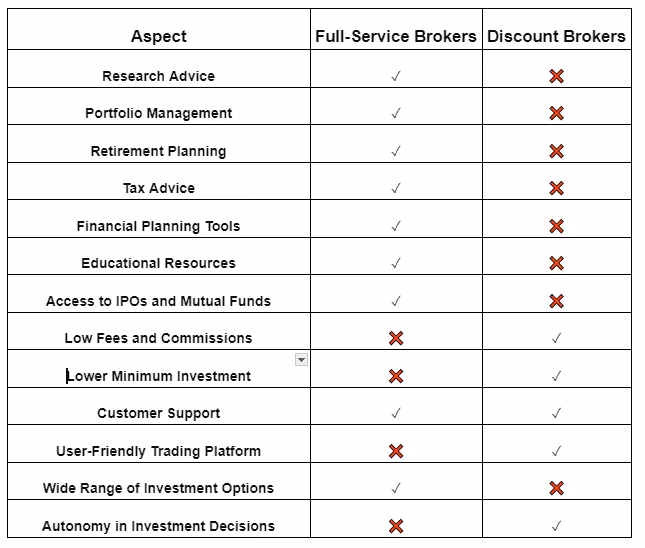
Types of Stock Brokers:
- Full-Service Brokers: Picture them as your financial advisors, offering complete services to guide you through the complex world of investing. Here's what you can expect:
- Personalized Advice: Full-service brokers provide customized investment advice based on your financial goals, risk tolerance, and market conditions.
- Diverse Investment Options: Full-service brokers provides a wide range of investment options, including stocks, bonds, mutual funds, and more.
- Research Reports: They offer in-depth research reports and market analysis to help you make better investment and stock trading decisions.
- Portfolio Management: Many full-service brokers offer portfolio management services, where they actively manage your investments on your behalf.
- Complete Financial Planning: Beyond just buying stocks, full-service brokers offers complete financial planning services, covering areas like retirement planning, tax optimization, and estate planning.
- Additional Services: From retirement planning to tax advice, full-service brokers go the extra mile to meet all your financial needs.
- Examples of full-service brokers in India include Swastika Investmart, ICICI Direct, HDFC Securities, and Kotak Securities.
- Discount Brokers: A discount broker or online stockbrokers would typically just buy and sell on behalf of their clients.
- Cost-Effective Trading: Discount brokers take lower fees and commissions compared to their full-service brokers, making them an attractive option for investors for more affordable trading.
- User-Friendly Trading Platforms: Discount brokers provide simple and user-friendly trading platforms with features for executing trades efficiently.
- Independent Investing: With a discount broker, you have full control over your investment decisions. Whether you're buying stocks, ETFs, or options, you have the complete independence to execute trades according to your investment strategy and market analysis.
- Minimal Account Maintenance Requirements: Discount brokers often have lower minimum account balance requirements, making them affordable to a broader range of investors.
- Limited Customer Support: While discount brokers may offer basic customer support services, they generally provide less personalized assistance compared to full-service brokers. Examples of discount brokers in India include Tradingo, Zerodha, Upstox, and 5paisa.
Comparison of Different Types of Brokers: Let's compare the key features of full-service, discount, and online brokers in the table below:
Conclusion:
Choosing the right type of broker is an important decision for any investor. Whether you prefer personalized advice and portfolio management or are comfortable making your own investment decisions, there's a broker out there to suit your needs. We hope this guide has helped understand the types of stock market brokers.
Learn more about Stock Market!

Put Call Ratio (PCR): Definition, Formula, and Significance
Introduction to Put Call Ratio (PCR)
Among the many tools and indicators used by investors and traders, one of the indicators to understand is the Put Call Ratio (PCR). The Put-Call Ratio (PCR) is a popular tool to know the market sentiment!
Understanding PCR
Let’s understand this in the simplest way possible. Think of the stock market as a tug-of-war between investors who think prices will go up (bullish) and those who think the prices will go down (bearish). Stock options, which give you the right to buy (call) or sell (put) a stock at a predetermined price at a predetermined date, can reveal these beliefs. The PCR uses options to understand which side is pulling harder!
Before diving into the Put Call Ratio itself, it's essential to understand the basics of call and put options, and Market sentiment?
Call options give the holder the right, but not the obligation, to buy an asset at a specified price within a predetermined time frame. On the other hand, put options give the holder the right, but not the obligation, to sell an asset at a specified price within a predetermined time frame.
Market sentiment is the feeling of most investors at a particular time. It indicates whether they're feeling positive (bullish) or negative (bearish) about the market in general or a specific stock.
- Bullish Sentiment: Investors are feeling confident and expect prices to rise.
- Bearish Sentiment: Investors are feeling cautious and expect prices to fall.
So The Put Call Ratio (PCR) is a measure of market sentiment derived from the ratio of the trading volume of put options to call options.
Formula for Calculating PCR
The PCR is calculated using a simple formula:
PCR = Put Volume / Call Volume
Put Volume and Call Volume refer to the number of put and call option contracts traded in a day.
Example: Let's say on a particular day, 100 put contracts and 50 call contracts are traded for a stock. Here's how to find the PCR:
PCR = 100 (Put Volume) / 50 (Call Volume) = 2
A PCR of 2 suggests a bearish sentiment as more investors are buying puts, indicating a price drop.
Significance of PCR
The Put Call Ratio plays a significant role in market sentiment analysis. A high PCR value suggests that investors are bearish, indicating a potential downtrend in the market. While a low PCR value suggests that investors are bullish, indicating a potential uptrend. Ideal PCR is between 0.80-1.20.
In more simple language, A PCR value greater than 1 indicates a bearish sentiment, as there are more put options being traded in comparison to call options. A PCR value less than 1 indicates a bullish sentiment, as there are more call options being traded in comparison to put options.
Understanding PCR and its relation with market sentiment Practical Examples
Positive PCR (Bearish Sentiment):
Imagine a scenario where investors are feeling nervous about a stock, say ABC Ltd. They anticipate the price to go down. Here's how PCR reflects this:
Example:
- Put Volume: 200 contracts (Investors are actively buying puts)
- Call Volume: 100 contracts (Investors are hesitant to buy calls)
- PCR = Put Volume / Call Volume = 200 / 100 = 2
A PCR of 2 indicates a negative PCR, meaning there are more puts than calls. This suggests a bearish sentiment. Investors are betting on the price to fall by buying more put options.
Negative PCR (Bullish Sentiment):
Now, let's imagine a different scenario where investors are optimistic about XYZ Ltd. They expect the price to increase. Here's how PCR reflects this:
Example:
- Put Volume: 50 contracts (Investors are less interested in puts)
- Call Volume: 150 contracts (Investors are actively buying calls)
- PCR = Put Volume / Call Volume = 50 / 150 = (1 / 3)
A PCR of (1 / 3) is a positive PCR, meaning there are more calls than puts. This suggests a bullish sentiment. Investors are looking to profit from a price rise by buying more call options.
Neutral PCR:
Sometimes, investors might be unsure about the direction of the stock price. This creates a balanced market sentiment.
Example:
Put Volume: 75 contracts
Call Volume: 75 contracts
PCR = Put Volume / Call Volume = 75 / 75 = 1
A PCR of 1 is considered neutral. Put and call volumes are equal, indicating a balanced market sentiment where investors are neither overly bullish nor bearish.
Where to Find PCR Data:
Many financial websites and trading platforms offer live and historical PCR data. You can also find specific PCRs like the Nifty 50 PCR (for the top 50 Indian stocks) or the Bank Nifty PCR (for banking stocks). Additionally, some platforms provide PCR data for individual stocks.
Conclusion:
The Put-Call Ratio (PCR) is a valuable tool to understand investor sentiment in the stock market. By analyzing the PCR along with other factors, you can gain insights into market psychology.
Learn more about financial terminologies with Swastika!

What is Brokerage? | Meaning, Types, & More
The Indian stock market is a big marketplace where people buy and sell shares of ownership in companies, similar to a stock market anywhere else in the world. Here's a quick breakdown:
- Companies Sell Shares: Companies can raise money by selling small pieces of ownership, called shares or stocks, to the public. This is a way for them to get funding for growth.
- Investors Buy Shares: People who buy these shares become part-owners of the company. They hope that the company will do well, and the value of their shares will increase. They can then sell their shares at a profit later.
- The Stock Exchange: This is where the buying and selling of shares takes place electronically. The Bombay Stock Exchange (BSE) and the National Stock Exchange of India (NSE) are the two main stock exchanges in India.
- Brokers Help You Trade: You can't directly buy and sell shares on the stock exchange. You need a brokerage firm, like a middleman, to handle the transactions for you.
What is a Brokerage in the Stock Market?
A brokerage in the stock market is like a middleman that helps you buy and sell stocks. They are companies or individuals authorized to buy and sell stocks on behalf of investors. The stock brokerage company that facilitates your share purchases and sales levies a fee for its services. The term "brokerage" refers to this charge.
Example of a Brokerage:
Let's say you want to buy shares of a company like TCS. You don't go directly to the stock exchange to buy them yourself. Instead, you open an demat account with a brokerage firm like Swastika Investmart. Through their online platform or app, you place an order to buy TCS shares. The brokerage then carries out the transaction for you, and the shares are added to your account.
There are currently four methods available to stock brokers in India for charging brokerage fees. Let's examine each of them individually.
- Flat fee for every trade: As the name implies, there is a flat price associated with each deal you make in this mode. As a result, the brokerage you must pay is the same regardless of the transacted value. But there's a catch: the investor will only be charged the lower sum if the percentage brokerage is lower.
- Brokerage as a percentage of the traded value: A portion of the entire trade value is charged as brokerage by stock brokers. Put simply, a trade's worth will determine how much the brokerage is going to be, and vice versa.
- Monthly trading plans: A few stock brokers now provide monthly trading plans that let you make an infinite amount of trades in a given month, regardless of how much each trade is worth. They also demand a monthly or annual subscription fee in exchange.
- Zero brokerage: Numerous discount broking businesses do not charge a brokerage fee for the transactions.
How to Choose the Perfect Broker in India
The Indian stock market offers exciting opportunities, but choosing the right brokerage firm can feel difficult.
- Reputation and Reviews: Trust is key! Look for firms with a strong track record and satisfied customers.
- Reviews: User reviews on financial websites and forums offer valuable insights from real people. Read both positive and negative comments to get a well-rounded picture.
- Registrations: Ensure the firm is registered with SEBI (Securities and Exchange Board of India), the regulatory body. Their website should display membership codes for stock exchanges like NSE (National Stock Exchange) or BSE (Bombay Stock Exchange).
- Reputation: Established firms with a long history and satisfied clients are often a safe bet.
- Services: Consider your investment style and experience level when choosing between service models:
- Full-service brokers: Ideal for beginners. They offer personalized advice, research reports, and educational resources, but charge higher fees. (commissions).
- Discount brokers: Perfect for experienced investors who prioritize low costs. They focus on trade execution with minimal fees.
- Fees (Brokerage Charges): Understand fee structures, including commissions, account minimums, and any hidden charges. Full-service brokers might offer bundled services at a higher cost, while discount brokers have lower fees but fewer services.
- Trading Platform: Check the user-friendliness and features of the platform. Look for ease of navigation, real-time market data, and charting tools to support your investment decisions.
- Customer Support:
- Multiple Channels: Check whether they offer phone, email, and live chat options for assistance.
- Prompt Response: Look for firms known for resolving issues.
- Transparency is Key: No Hidden Costs.
Before opening an account, have a detailed discussion with the brokerage representatives. Ensure a clear understanding of all charges involved in the transaction
By understanding these costs upfront, you can avoid surprises and make better decisions about your investment.
Conclusion
Brokerage plays a crucial role in the stock market by facilitating the buying and selling of shares for investors. It serves as a middleman and charges fees for its services, which can be structured as flat fees, percentage-based commissions, monthly trading plans, or zero brokerage models. Choosing the right broker requires evaluating reputation, SEBI registration, fees, trading platforms, and customer support. By understanding these factors, investors can select a brokerage that aligns with their needs, ensuring a seamless and cost-effective trading experience.
Start Investing Today!
.avif)
What is the Securities Transaction Tax (STT)?
Introduction:
The world of finance can be confusing, especially when it comes to terms like Securities Transaction Tax (STT). But don't worry! This blog will make STT simple. Let's explore what it is, how it works, why it's there, and what it means for you as an investor.
What is STT?
STT is a tax imposed by the government on the buying and selling of securities like stocks, derivatives, and certain mutual funds. Whenever you make a transaction in the stock market, a small percentage of the transaction value is collected as STT. The tax is levied at a predetermined rate, expressed as a percentage of the transaction value, and is applicable to both the buyer and the seller.
How Does STT Work?
STT operates as a transaction-based tax, meaning it is triggered with every buy or sell order executed in the market. The tax rate varies based on the type of security being traded and the nature of the transaction—whether it involves delivery (holding securities beyond a specified period) or intraday trading (buying and selling within the same trading day). For instance, equity delivery trades typically attract a different STT rate compared to intraday trades. In other words STT is calculated based on the type of security you're trading and whether it's a buy or sell transaction. The rates may vary, but the idea remains the same: a little slice of your transaction goes to the government.
Why Does STT Exist?
The primary goal of STT is twofold. Firstly, it's a way for the government to collect revenue. Secondly, it acts as a measure to regulate the stock market. By imposing a tax on transactions, especially on short-term trades, it aims to discourage excessive speculation and promote more stable, long-term investments.
The introduction of STT serves several purposes, primarily driven by governmental and regulatory objectives:
- Revenue Generation: STT serves as a crucial source of revenue for the government. By taxing transactions within the securities market, the government can accumulate funds to support various developmental initiatives, infrastructure projects, and welfare programs.
- Regulatory Measure: Beyond revenue generation, STT acts as a regulatory tool aimed at shaping market behavior and fostering stability. By imposing a tax on transactions, particularly on short-term trades, STT discourages speculative activities and promotes a more disciplined, long-term approach to investing.
Impact on Investors:
For investors, STT adds a small cost to each transaction. While it may seem like pennies at a time, it can add up, especially for frequent traders. However, it's also a transparent tax, clearly stated on your transaction records, making it easy to keep track of.
For investors participating in the securities market, STT carries both direct and indirect implications:
- Cost Consideration: STT adds to the overall cost of trading for investors. While the tax rates are relatively modest, even small percentages can accumulate, especially for frequent traders engaged in high-volume transactions.
- Transparency: Unlike some other charges and fees associated with stock market transactions, STT offers transparency. It is explicitly disclosed in transaction statements provided by brokerage firms, allowing investors to accurately track and account for their tax liabilities.
- Behavioral Influence: STT plays a pivotal role in shaping investor behavior. By making short-term trades comparatively more expensive, STT incentivizes investors to adopt a more strategic, long-term perspective. This shift towards long-term investing not only aligns with wealth accumulation goals but also contributes to market stability and resilience.
Conclusion:
STT may sound intimidating at first, but it's simply a tax on stock market transactions. It serves the dual purpose of revenue generation for the government and regulating market behavior. So, the next time you see STT mentioned, just remember: it's a small fee for playing in the stock market sandbox.
Learn More about financial terminologies with Swastika !

What is Rollover in Stock Market
Introduction:
In the world of finance, there are many terms that can sound intimidating to beginners. "Rollover" is one such term that might seem confusing at first glance. However, once you understand what it means, it's actually quite simple. In this blog post, we'll break down the concept of rollover in the stock market.
What is Rollover?
Rollover in the stock market refers to the process of extending the expiration date of an investment position. This typically applies to futures contracts, options, and certain other derivative instruments. Let's delve into each of these to understand rollover better:
Futures Contracts:
In futures trading, investors agree to buy or sell a particular asset at a predetermined price on a specified future date. However, not all investors intend to take physical delivery of the underlying asset. Instead, they may choose to close out their position before the contract expires by offsetting their initial position with an opposite position (buying back what they sold or selling what they bought).
Rollover occurs when an investor extends the expiration date of their futures contract by closing out their current position and simultaneously opening a new position with a later expiration date. This allows investors to maintain exposure to the underlying asset without actually taking delivery.
Options:
Options contracts give the holder the right, but not the obligation, to buy or sell an underlying asset at a predetermined price (strike price) within a specified period. Like futures contracts, options contracts have expiration dates.
When an options holder decides to extend the expiration date of their contract, they can engage in a rollover. This involves closing out their existing position and opening a new position with a later expiration date.
Why Rollover?
Investors might choose to rollover their positions for several reasons:
- Time Horizon: If an investor's outlook on the underlying asset hasn't changed but they want to extend their investment horizon, rollover allows them to do so without exiting the position entirely.
- Avoiding Delivery: In futures trading, rollover helps investors avoid taking physical delivery of the underlying asset, which may not be practical or desirable for various reasons, such as storage costs or logistical constraints.
- Adapting to Market Conditions: Rollover can also be a strategic move in response to changing market conditions. For example, if an investor expects volatility to increase in the near future, they may roll over their position to a later expiration date to give their investment more time to play out.
Conclusion:
Rollover is a common practice in the stock market, particularly in futures and options trading. It allows investors to extend the expiration date of their positions, providing flexibility and strategic options. By understanding the concept of rollover, investors can better manage their investments and adapt to evolving market conditions.
Learn more about Stock Market!
What is short selling?
Short selling is like betting that the price of something will drop. They borrow shares from a broker and sell them right away at the current price. They hope the stock price drops so they can buy back the shares at a lower price. Then, they return the borrowed shares to the broker and keep the difference between the selling and buying prices.
Here's how it works:
Imagine borrowing a toy from a friend to sell it to someone else. You hope that by the time you have to give the toy back to your friend, its price will be lower, so you can buy it for less and return it. Short-sellers do this with stocks or other investments. They borrow them, sell them to someone else, and hope the price goes down so they can buy them back cheaper and return them. This is different from regular investors who want the price to go up.
Example of short selling
- Let's say you believe that XYZ Corporation's stock, currently priced at Rs. 7,000 per share, is overvalued and will decrease in the near future. You decide to short sell the stock.
- You borrow 10 shares of XYZ Corporation from your broker and sell them immediately at Rs. 7,000 per share, receiving Rs. 70,000 in total. Now, you're "short" 10 shares of XYZ Corporation.
- A few weeks later, XYZ Corporation announces disappointing earnings, causing its stock price to come down to Rs. 5,600 per share. You decide it's time to close your short position.
- You buy back the 10 shares of XYZ Corporation at the current market price of Rs. 5,600 per share, spending Rs. 56,000 in total.You return the 10 borrowed shares to your broker.
- So finally you made a profit of Rs. 14,000: (Sale proceeds of Rs. 70,000 - Purchase cost of Rs. 56,000 = Rs. 14,000), excluding any transaction fees or interest charges
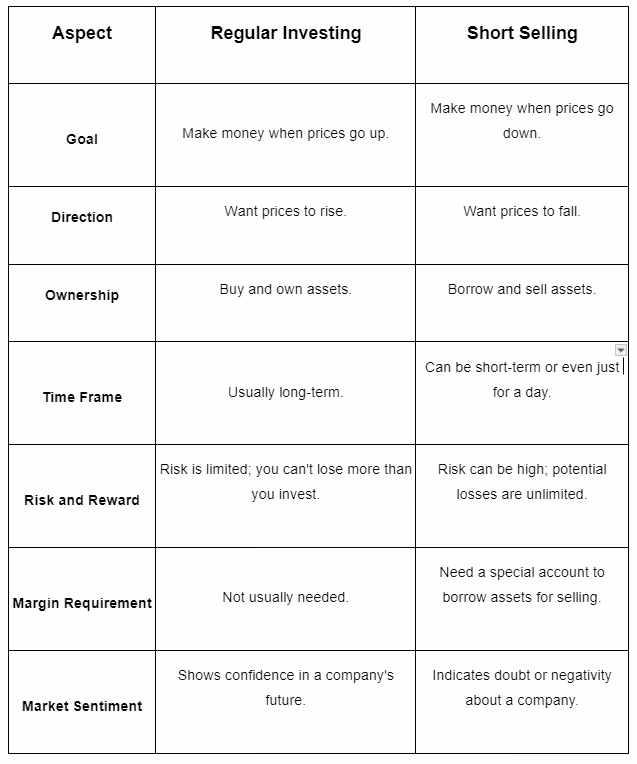
Differences Between Regular Investing And Short Selling
Pros of Short Selling:
- Chance for Big Profits: If you predict that a stock's price will drop and you're right, you can make a lot of money from short selling.
- Protection against a bear Market: Short selling can help protect you when the market isn't doing well. When stock prices are falling, short selling lets you still make money.
- More Ways to Make Money: Short selling gives you another way to make money in the market. It adds flexibility to your trading and can help you earn extra cash.
Cons of Short Selling:
- Unlimited Losses: When you short sell, your potential losses aren't limited. If the stock price goes up instead of down, you could end up losing more money than you put in.
- You can not carry your position to next day and you will have to square of it same day only.
- Missed Opportunities: While you're busy short selling, your money is tied up in that trade. This means you might miss out on other chances to make money elsewhere.
FAQs
1) How do I start short selling?
To short sell, you'll need to open a margin account with a brokerage firm. Once you have an account, you can place a short sell order for the desired stock through your broker's trading platform.
2) Are there any restrictions on short selling?
Some regulations may limit short selling, especially during times of market volatility. Additionally, not all stocks are available for short selling, as it depends on the availability of shares to borrow.

What is Liquidity
In finance, The efficiency or convenience with which a security or asset can be turned into quick cash without negatively impacting its market price is referred to as liquidity.
High liquidity means it's easy to turn an asset into cash at its expected value or market price. Low liquidity means there aren't many chances to buy and sell, making assets hard to trade.
Cash is the most liquid asset, followed by stocks, bonds, and real estate, which vary in their liquidity levels. Cash can be readily spent or invested, while stocks and bonds can be sold quickly. Real estate, however, takes longer to sell due to its illiquidity.
What does "liquidity" mean when we talk about the stock market?
Well, it's all about how easy it is to buy and sell stocks without affecting their prices too much. Higher liquidity stocks will have a sufficient number of outstanding shares as well as a suitable supply and demand. It's the quantity of consumers and sellers that are present in a market, to put it simply.
But smaller companies, especially those traded on smaller exchanges, can be trickier. They're not traded as much, so there's a bigger gap between what buyers are offering and what sellers want. When more people suddenly want to buy or sell these stocks, their prices can swing wildly. That's the basic idea of liquidity in the stock market.
Importance in financial markets:
Liquidity is likewise important for investors, as it influences the price they will pay when purchasing stocks or ETFs and Stock liquidity is crucial since it dictates how soon you can enter or exit a trade. High liquidity also means lesser risk because there is a greater chance that someone will take the opposite position in the transaction.
For businesses, understanding their liquid assets is important as these funds are required to settle any pending bills or debts. To figure out if a company or person has enough cash to pay their bills, you can compare their assets to their debts. If their assets are higher, they're solvent, which means they can pay their debts and still have some cash left over.
Types of Liquidity:
- Accounting Liquidity: Accounting liquidity quantifies how easily a person or business may pay off debts when they become due by using their liquid assets to meet their financial commitments.
- Market Liquidity: The degree to which assets can be purchased and sold at steady, transparent prices on a market—like the stock market of a nation or the real estate market of a city—is referred to as market liquidity.
Conversely, greater market liquidity is a feature of the stock market. A buyer's bid price (the price per share) and a seller's ask price (the price they are willing to accept) will be quite close to each other if an exchange has a significant volume of transaction that is not dominated by selling.
For example, big stock exchanges usually have lots of trading and small price differences between buying and selling, making them easy to buy and sell in. On the other hand, some markets outside exchanges might have less trading and bigger price differences, making them harder to trade in quickly.
How to Identify Liquid Stocks:
1) Trade volume is high:
- High trading volume means lots of people are buying and selling the stock, making it easier to trade.
- Low trading volume means fewer trades, which can make it harder to buy or sell the stock quickly.
2) The difference between the bid price and ask price is less:
- A narrow bid-ask spread means the difference between what buyers are willing to pay and what sellers are asking for is small. It's easier to trade when this gap is tight.
- A wide bid-ask spread suggests there's a bigger difference between what buyers want to pay and what sellers are asking for. This can make trading slower and more expensive.
3) Consider Market Depth:
- Market depth shows how many orders are waiting to be filled at different prices. More orders mean there's more interest in the stock, making it easier to trade.
- Less market depth suggests fewer orders, which can mean less interest and slower trading.
Conclusion
Liquidity refers to how easily an asset can be converted into cash without impacting its price. In the stock market, higher liquidity means smoother trading with minimal price fluctuations, while lower liquidity can lead to volatility and wider bid-ask spreads. Investors can identify liquid stocks by looking at trading volume, bid-ask spread, and market depth. Liquidity is crucial for both investors and businesses, affecting trade execution, financial stability, and risk management.
Learn more about financial terminologies with Swastika!

Stock Market Hedging: What It Is?
What is hedging?
Imagine you're a farmer growing wheat, and you're worried about the price of wheat dropping by the time you harvest it. You want to protect yourself from losing money if the price goes down. So, you make a deal with a buyer to sell your wheat at a fixed price in the future, say 6 months from now. This way, even if the market price of wheat drops, you're still guaranteed to sell your wheat at the agreed-upon price.
Hedging in the stock market refers to a risk management strategy that is used by investors to lower the potential losses that results from unfavourable price movements.
Stock market hedging helps investors reduce risk by using options, futures, or swaps. This can be done on stocks, indexes, bonds, and even commodities.
How does Hedging Work?
Hedging works by taking an opposite position in a related investment. For example the main Investment could be the stock, bond, commodity etc. you already own that you want to protect from price movements. For this the Hedging Position would be a new investment you make that will benefit you if the main investment loses its value, and vice versa.
In the above example here's how hedging can help:
- Main Investment: Your wheat crop. You're hoping for a good harvest and high wheat prices.
- Hedging Position: You can sell wheat futures contracts. These are agreements to sell wheat at a predetermined price (called the strike price) on a specific future date.
Another common example of hedging in the stock market involves using put options to protect yourself from a decline in a stock's price. Here's how it works:
- Main Investment: Let's say you own 100 shares of A company at ₹100 per share. You believe in A’s long-term potential, but you're worried about a short-term market correction that could bring the price down.
- Hedging with Put Options: You can buy put options for A stock. Put options give you the right, but not the obligation, to sell your shares at a certain price (called the strike price) by a certain expiry date.
Imagine you buy put options with a strike price of ₹90 and an expiry date in 3 months. Here's what could happen:
- Stock Price Goes Up: You can simply let the put options expire unused. You'll enjoy the gains on your original 100 shares of A if the price rises.
- Stock Price Goes Down: If the price falls below ₹90, you can exercise your put options and sell your shares at ₹90 each. This will limit your lose compared to just holding the stock and watching the price drop. Even if the price crashes to ₹80, you'd still get ₹90 per share thanks to the put options.
Advantages of Hedging:
- Risk Reduction: Think of hedging like a safety net for your money. It helps protect you from losing too much if the price movements vary in the markets. By using hedging strategies, individuals or businesses can protect themselves against adverse price movements in assets, currencies, commodities, or interest rates.
- Peace of Mind: When you hedge, you worry less about sudden drops in prices or rates. It allows individuals or businesses to lock in prices or rates, so they won't suffer major financial losses if market conditions turn unfavourable.
- Control: Hedging gives you more control over your financial risks. You can choose strategies that fit your needs and comfort level.
- Price Speculation: In some cases, hedging can be used strategically to speculate on future price movements. For example, an airline might hedge against rising oil prices by buying oil futures contracts, locking in a lower price for future fuel purchases.
- Reduce Overall Portfolio Volatility: This means the value of your investments won't swing as much, making things less stressful, especially if you don't like taking risks or are close to retirement.
Disadvantages of Hedging:
- Costs: hedging strategies often comes with costs, such as transaction fees, premiums for options contracts, or margin requirements. These costs can also take away your into potential profits or increase overall expenses.
- Over-hedging: Sometimes people hedge too much, which can limit their ability to make money when things are going well. It's like being too cautious and missing out on good opportunities.
- False Security: While hedging can reduce risk, it can also create a false sense of security. You might rely too much on your hedge and not pay enough attention to other risks.
- It Might Not Work: Despite your best efforts, hedging doesn't always do the trick. Market conditions can be unpredictable, and your hedge might not fully protect you from losses.
- Complexity: Hedging strategies can be complex, especially for beginners. Understanding different hedging instruments and how to use them effectively requires some financial knowledge and experience

Understanding Derivatives: A Beginner's Guide for Indian Investors
Ever heard fancy terms like "derivatives" or "futures contracts" and wondered what they mean? Don't worry, you're not alone! Many beginner investors find these concepts confusing. However, understanding derivatives is essential for anyone looking to navigate the world of finance confidently. In this blog, we'll break down derivatives in simple language, specifically suited for Indian investors.
What are Derivatives?
Let's start with the basics. Derivatives are financial contracts that derive their value from an underlying asset, like stocks, commodities, or indices. Think of derivatives as bets on the future price of these assets. They allow investors to speculate on price movements, hedge against risks, or even just manage exposure to different assets without actually owning them.
Derivatives are essentially agreements between two parties that derive their value from the fluctuations in the price of this underlying asset.
For example you own a farm and expect the price of mangoes to go up in the summer. You can enter into a derivative contract with a local vendor, agreeing to sell them mangoes at a fixed price in three months. This way, you lock in a profit if the price indeed goes up, and the vendor gets mangoes at a predictable price.
Types of Derivatives:
There are a few main types of derivatives that you should know about:
1. Forward Contracts: These are customized agreements made directly between two parties. They agree on a price to buy or sell a specific underlying asset at a predetermined future date.
Let's say you're a jeweller and need gold for your upcoming collection launch in 6 months. You can enter into a forward contract with a supplier to lock in the gold price today, this protects you from future price hikes.
Remember, forward contracts are private agreements, and are not traded on exchanges.
2. Future Contracts:Similar to forwards, futures are agreements to buy or sell an asset at a specific price on a specific future date. However, unlike forwards, they are standardized contracts traded on exchanges like the National Commodity & Derivatives Exchange (NCDEX) in India. This means the contract details (like quantity and quality) are predefined, ensuring transparency and ease of trading.
Example: You believe the price of crude oil will increase due to global tensions. You can buy a futures contract for 100 barrels of crude oil at a future date (say, ₹5,000 per barrel in 3 months). If the price goes up to ₹5,500 by then, you can sell your contract and make a profit. But if the price falls, you'll incur a loss.
Note:
- Expiry Date: The date on which the contract must be settled (delivery of the underlying asset or cash settlement).
- Lot Size: The standardized quantity of the underlying asset in a futures contract.
3. Options Contracts: Imagine having the option to buy or sell an asset at a certain price by a certain date, but not being obligated to do so. That's the beauty of options contracts. Options contracts give you the right, but not the obligation, to buy or sell an underlying asset at a certain price by a certain date. There are two main types:
- Call Option: This gives you the right, but not the obligation, to buy an asset at a predetermined price (strike price) by a specific expiry date.
- Put Option: This grants you the right, but not the obligation, to sell an asset at a predetermined price (strike price) by a specific expiry date.
4. Swap Contracts: Swap contracts are customized agreements between two parties with the investment professional acts as a middleman.To exchange cash flows based on underlying assets like bonds, currencies, or even interest rates. It's like a barter system for financial instruments. There's usually no exchange of the principal amount itself, just the cash flow generated by it.
Imagine you have a loan with a floating interest rate (linked to a benchmark rate), but you prefer the stability of a fixed rate. You can enter into an interest rate swap with a bank, where you exchange your floating rate payments for the banks fixed rate payments.
Note:
- Counterparty: The other party involved in the swap contract.
How Derivatives Work:
Let's break it down with an example. Imagine you're a farmer in India, and you're worried about the price of wheat dropping before you can sell your crop. To protect yourself, you could enter into a futures contract to sell your wheat at a set price in the future. That way, even if the price of wheat falls, you're guaranteed to sell it at the agreed-upon price.
Benefits of Derivatives:
Derivatives offer several benefits for investors:
- Hedging: They allow investors to protect themselves against potential losses by offsetting risks.
- Speculation: Investors can try to make money by predicting price movements in the market.
- Diversification: Derivatives provide opportunities to diversify investment portfolios and spread out risk.
- Price Discovery: They help determine the future prices of assets by providing information about market expectations.
Risks of Derivatives:
Of course, derivatives also come with risks:
- Market Risk: Prices can be unpredictable, leading to potential losses if predictions are wrong.
- Leverage Risk: Derivatives often involve borrowing money to make bets, which can magnify both gains and losses.
- Counterparty Risk: There's a risk that the other party in the contract won't hold up their end of the deal.
- Complexity: Derivatives can be complex, so it's essential to understand what you're getting into before you start trading.
Are Derivatives Right for You?
Derivatives can be powerful tools for hedging risks (protecting your investments from price fluctuations) and potentially multiplying returns. However, they are complex instruments and carry \ risks. Here are some things to consider:
- Understanding the Risks: Derivatives can lead to significant losses if not used properly. Ensure you understand the mechanics of each type of contract and the potential risks involved.
- Market Knowledge: Derivatives are sensitive to market movements and can be volatile. A solid understanding of the underlying asset and the factors affecting its price is crucial.
- Risk Management: Derivatives involve leverage, meaning a small movement in the underlying asset can significantly impact your profit or loss. Proper risk management strategies like stop-loss orders are essential.
- Regulation: Derivatives trading in India is regulated by the Securities and Exchange Board of India (SEBI).
- Start Small: If you're new to derivatives, it's wise to start with smaller contracts and gradually increase your activity as you gain experience. Consider consulting a stock market brokerage firm like swastika Investmart for personalized guidance.
Conclusion:
Understanding derivatives is key to becoming a savvy investor. While they offer opportunities for profit and risk management, it's crucial to approach them with caution. By grasping the basics and being aware of the risks, Indian investors can navigate the world of derivatives more confidently and make smart decisions about their finances.

A Beginner's Guide to Futures and Options Trading
If you've ever wondered how investors make money by predicting the future movements of stocks, commodities, or indexes, then you're in the right place. In this beginner's guide, we'll explore what futures and options are, how they work, and how you can get started in trading them.
Understanding Futures:
Let's start with futures. A futures contract is a legal agreement to buy or sell a particular asset at a predetermined price on a specified future date. These assets can include commodities like gold, oil, or agricultural products, financial instruments like stocks or indexes, and even currencies.
How It Works:
- Suppose you believe that the price of gold will increase in the future. You can buy a gold futures contract, agreeing to purchase a specific amount of gold at a predetermined price on a set date.
- If the price of gold goes up before the contract expires, you can sell the futures contract at a profit.
- On the other hand, if the price goes down, you may incur a loss.
Key Features:
- Leverage: Futures trading involves leveraging, meaning you only need to put down a fraction of the contract's total value as a deposit, known as margin.
- Standardized Contracts: Futures contracts are standardized in terms of size, expiration date, and quality of the underlying asset, making them easily tradable on exchanges.
Risks:
While leverage can amplify gains, it can also magnify losses, so it's crucial to manage risk carefully when trading futures.
Exploring Options:
Now, let's dive into options. An option is a contract that gives the buyer the right, but not the obligation, to buy or sell an asset at a predetermined price within a specified time frame.
Types of Options:
- Call Option: Gives the buyer the right to buy the underlying asset at a predetermined price (strike price) before the expiration date.
- Put Option: Gives the buyer the right to sell the underlying asset at a predetermined price (strike price) before the expiration date.
How It Works:
- Suppose you expect the price of a stock to rise. You can buy a call option on that stock, allowing you to purchase it at a predetermined price, known as the strike price, within a specified period.
- If the stock price goes up, you can exercise your option and buy the stock at the lower strike price, selling it at the higher market price for a profit.
- If the stock price falls or remains the same, you're not obligated to exercise the option, limiting your losses to the premium paid for the option.
Key Features:
- Limited Risk: Unlike futures, where losses can be unlimited, options trading comes with limited risk. The maximum loss is limited to the premium paid for the option.
- Versatility: Options can be used for various trading strategies, including speculation, hedging, and income generation.
Risks:
- Time Decay: Options have an expiration date, and as they approach expiration, their value tends to decline due to time decay. This can erode the value of an option position, especially if the underlying asset's price doesn't move as expected.
- Getting Started: Now that you have a basic understanding of futures and options, how can you get started in trading them?
- Educate Yourself: Take the time to learn about the mechanics of futures and options trading, including the terminology, strategies, and risks involved. There are plenty of online resources, courses, and books available to help you deepen your knowledge.
- Open a Trading Account: To trade futures and options, you'll need to open a demat and trading account with a company like Swastika Investmart that offers access to these markets, has a user-friendly platform, and excellent customer support.
- Start Small: As a beginner, it's essential to start small and trade with money you can afford to lose. Begin with paper trading or small position sizes to gain experience without risking significant capital.
- Develop a Trading Plan: Define your trading goals, risk tolerance, and strategy before placing any trades. A well-thought-out trading plan will help you stay disciplined and avoid impulsive decisions.
- Stay Informed: Keep yourself updated on market news, economic indicators, and geopolitical events that can impact the prices of underlying assets. Stay flexible and be prepared to adjust your trading strategy as market conditions change.
Conclusion:
Futures and options trading can be a lucrative venture for those willing to put in the time and effort to learn. While these financial instruments offer opportunities for profit, they also come with inherent risks. By understanding the basics, developing a solid trading plan, and practicing prudent risk management, you can increase your chances of success in the futures and options trading.
Happy trading!

Smart Strategies: Protecting Profits with Stop Loss and Target
Investing in the stock market can be both exciting and daunting, especially for beginners. One of the keys to successful investing is having a clear strategy for managing risk and setting realistic targets. In this blog, we'll discuss two essential concepts for every investor: Stop Loss and Target, and how mastering these can help navigate the market with confidence.
Understanding Stop Loss:
Stop Loss is a risk management tool acts as a safety net to limit your losses. It involves setting a predetermined price level at which a stock will be automatically sold to prevent further losses.
Here's how it works:
Let's say you buy shares of a company at ₹100 per share. You decide to set a Stop Loss at ₹90. If the stock price falls to ₹90 or below, your shares will be sold automatically, helping you minimize losses and preserve capital.
Why is a Stop Loss Important?
The market is unpredictable. A sudden news event or industry shift can send stock prices dropping sharply. A stop loss ensures you don't hold onto a losing position forever.
It helps you:
- Limit Losses: By exiting at a predetermined price, you prevent bigger losses if the stock continues to fall.
- Maintain Discipline: It removes emotions from the equation. You don't panic-sell at rock bottom, but stick to your plan.
- Protect Capital: Preserved capital allows you to invest in other opportunities.
Types of Stop-Loss Orders:
- Market Stop-Loss: This is the most common type of stop-loss order. It triggers a market order to sell your shares at the best available price once the stop-loss price is reached. However, keep in mind that during highly volatile market conditions, you may not always get the exact stop-loss price.
- Limit Stop-Loss: With this order, you specify a minimum price at which you're willing to sell your shares. If the stock price hits your stop-loss price, a limit order is triggered, selling your shares at or above the specified price. This provides more control over the selling price but does not guarantee execution if the price drops too quickly.
Setting Target:
Now, let's talk about the flip side profits! setting a target allows investors to lock in profits and define the desired outcome of a trade. A Target is the price level at which an investor aims to sell a stock to realize gains. It helps investors maintain discipline and avoid getting greedy or holding onto positions for too long.
How it works:
- You buy shares of XYZ Ltd. at ₹150, expecting them to rise.
- You set a target price of ₹200.
- Once the price reaches ₹200 or above, your broker can sell your shares automatically (using a market or limit order).
Why is a Target Price Important?
Greed can be a powerful emotion. You might wait for a higher price, only to see the stock price fall. A target price helps you:
- Book profits: It ensures you don't miss out on gains by waiting too long.
- Plan your next move: Secure profits and use them to invest in other opportunities.
- Manage risk-reward: It balances the potential for higher gains with the risk of missing out if the price dips.
Target Price Explained
- Taking Profits: Selling your shares to realize your gains.
- Profit Target: The specific price point at which you aim to sell for a profit.
Types of Target Orders:
- Limit Target: Similar to a limit stop-loss order, a limit target order allows you to specify a minimum price at which you're willing to sell your shares once the target price is reached. This gives you control over the selling price but may not guarantee execution if the price moves quickly.
- Market Target: This order triggers a market order to sell your shares at the best available price once the target price is reached. While it ensures execution, you may not always sell at your desired price, especially during volatile market conditions.
Setting Stop Loss and Target Prices: A Practical Guide
Now that we understand the basics let's explore some tips for setting effective stop loss and target prices:
- Technical Analysis: Use tools like charts and indicators to identify potential support and resistance levels (areas where the price tends to bounce back or stall). This can help you set realistic stop loss and target prices.
- Risk Tolerance: How much loss are you comfortable with? A conservative investor might set a tighter stop loss, while a more aggressive investor might allow for more wiggle room.
- Reward-to-Risk Ratio: Aim for a target price that offers at least double the potential loss from your stop loss. For example, if your stop loss is ₹10, aim for a target price of at least ₹20 profit.
- Adapt to Market Conditions: Market conditions can change rapidly, so it's essential to adjust your Stop Loss and Target levels accordingly. Stay updated on news, events, and market trends that may impact your investments.
- Stick to Your Plan: Once you've set your Stop Loss and Target levels, stick to your plan. Avoid emotional decision-making and trust your analysis. Remember that losses are a part of investing, and it's crucial to manage them effectively.
- Regularly Review and Reassess: As market conditions evolve, regularly review your Stop Loss and Target levels to ensure they remain relevant. Be flexible and willing to adjust your strategy as needed.
Example
You invest ₹5,000 in 25 shares of PQR Ltd. at ₹200 per share. Here's how to use stop loss and target price:
- Stop Loss: Considering a 10% potential loss, you set a stop loss at ₹180. This protects your capital.
- Target Price: Based on technical analysis and market trends, you set a target price of ₹250. This offers a potential 25% profit.
- Order Types: You choose limit orders for both stop loss and target price. This ensures your shares are sold only at your desired price points or better.
Scenario 1: Profit Taking
The price of PQR Ltd. rises, reaching ₹260. Your limit order for the target price gets triggered, and your shares are sold automatically. Here's the breakdown:
- Selling Price: ₹260 per share
- Profit per Share: ₹260 - ₹200 = ₹60
- Total Profit: ₹60/share * 25 shares = ₹1,500
Scenario 2: Cutting Losses
Unfortunately, the market takes a downturn, and PQR Ltd.'s price falls sharply. Your stop loss order activates at ₹180, limiting your losses. Here's the breakdown:
- Selling Price: ₹180 per share
- Loss per Share: ₹200 - ₹180 = ₹20
- Total Loss: ₹20/share * 25 shares = ₹500
Even though the price dropped, your stop loss prevented a bigger loss. This saved capital can be used for future investments.
- Remember: These are simplified scenarios. Market movements can be unpredictable.
Beyond the Basics: Advanced Techniques
As you gain experience, consider exploring these advanced techniques:
- Trailing Stop Loss: This dynamically adjusts your stop loss as the price goes up, locking in profits while allowing for some price fluctuations.
- Trailing Target: This increases your target price as the stock rises, aiming to capture even higher gains.
Conclusion:
Stop loss and target price are not guarantees, but they are powerful tools for managing risk and maximizing returns. By understanding and applying these concepts, you'll become a more confident and informed investor in the dynamic Indian stock market. Remember, successful investing is a marathon, not a sprint. Discipline, risk management, and continuous learning are key to achieving your financial goals.


.avif)
.avif)

.avif)


