


Tata Gold ETF Share Price: Navigating India's Gold ETF Landscape In 2026


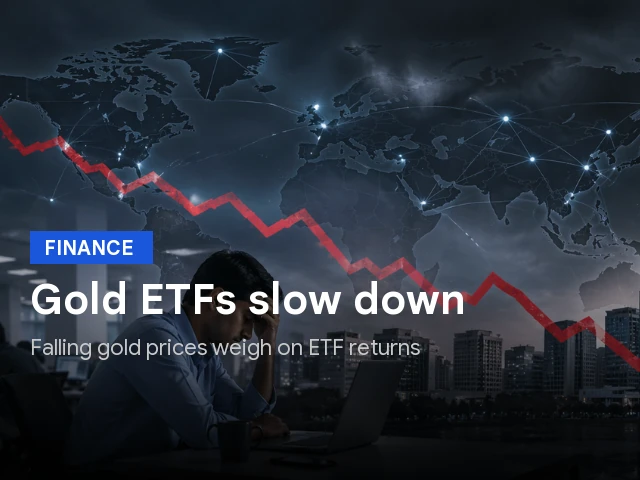

Key Takeaways
- Gold ETFs offer liquidity and diversification despite near-term headwinds.
- January 2026 marked a historic inflow shift, with Indian gold ETFs surpassing equity mutual fund inflows.
- Gold price cooled from ₹1.64 lakh per 10 g to ₹1.40 lakh as May 2026 saw outflow of ₹725 crore.
- Long-term, gold ETFs remain a core exposure for Indian investors.
Retail investors who track the tata gold etf share price are watching a turning point across India’s gold ETF landscape. Gold prices have cooled from a January peak of ₹1.64 lakh per 10 gm to around ₹1.40 lakh today. In the same window, Indian gold ETFs posted a dramatic shift in flows: January 2026 net inflows into Indian gold ETFs surpassed equity mutual fund flows for the first time, laying the groundwork for a new multipath dynamic in 2026. Yet, May 2026 delivered a net outflow of about ₹725 crore, reminding us that the path for gold exposure remains choppy in the near term.
Tata Gold ETF Share Price And The Indian Gold ETF Landscape
To understand the current setup, the key numbers tell a story of price and flow interactions. The gold price per 10 gm compressed from ₹1.64 lakh in January to roughly ₹1.40 lakh today, creating a near-term tailwind for investor appetite but also a price path that keeps ETF yields in check. In terms of flows, the period has delivered a mix of inflows and outflows: FY 2025-26 net inflows rose to ₹68,868 crore, while the past five fiscal years saw inflows totaling ₹30,213 crore. The net flow dynamic in January 2026–where gold ETFs surpassed equity mutual funds in inflows for the first time–suggests a substantial shift in where retail money is going within the broader investment landscape.
Notes: The data points above reflect the primary source figures described in the article. In short, the Tata Gold ETF share price moves in tandem with the bullion price and currency forces, with cross-border demand and domestic policy shaping the flow trajectory. The gold ETFs landscape has benefited from the post-pandemic shift towards alternative assets, while policy steps and currency dynamics continue to influence participation.
January 2026 Inflows Surpass Equity Mutual Funds: What It Means For Retail Investors
The January 2026 milestone signals a structural shift in investor behavior. Net inflows into Indian gold ETFs exceeded equity mutual fund inflows for the first time, reinforcing gold ETFs as a core diversification tool amid a regime of higher rates and currency volatility. The momentum carried into 2025-26, contributing to the year’s robust inflow tally of ₹68,868 crore. But the monthly cadence remains volatile: May 2026 recorded a net outflow of ₹725 crore, underscoring that macro factors (gold prices, USD strength, and rupee movements) can pivot demand quickly.
Macro Drivers Behind The Price Action: Dollar Strength, Inflation, And Import Duties
Several macro forces shape the Indian gold ETF price and flows. Persistent US inflation has kept expectations of rate hikes alive, reinforcing the dollar and making gold relatively less affordable for emerging economies, including India. A stronger dollar tends to restrain gold demand in rupee terms as imported bullion becomes pricier when converted to local currency. At the same time, higher import duties have reduced India’s gold imports, tempering overall demand. The rupee’s trajectory matters too: a stabilizing rupee can cushion downside and support ETF performance, while a weakening rupee can amplify returns for USD-priced gold exposures.
Comparative View Of Major Gold ETF Providers And Their Prices
Investors frequently compare the tata gold etf share price across major providers. Here are the key references that traders often monitor across leading gold ETF products:
- sbi gold etf share price
- hdfc gold etf share price
- axis gold etf share price
- kotak gold etf share price
- nippon india gold etf price
- canara robeco gold etf share price
Note that ETF prices track international bullion movements and currency corridors; the variation among these tickers reflects timing, liquidity, and cost structures. For a retail investor, the practical takeaway is to monitor the Tata Gold ETF share Price trajectory while understanding that the USD/INR dynamic underpins the real-dollar exposure of your Indian gold ETF investment.
Digital Gold, Physical Gold, And Regulatory Developments: What To Watch
Physical gold remains a tangible option, but storage and security costs persist. Digital gold is popular for its low entry thresholds and ease of use, but regulatory risk remains. The November 2025 Sebi warning highlighted significant counterparty and operational risks associated with digital gold products offered through online platforms without robust safeguards. Electronic Gold Receipts (EGR) are available for purchase and trading on BSE and NSE, but they suffer from lower liquidity compared with gold ETFs. Sovereign Gold Bonds were another popular option; no fresh issues have been announced in recent months. These dynamics matter for an investor deciding where and how to gain bullion exposure.
Long-Term Outlook: Why Gold ETFs Remain The Best All-Round Exposure
Looking forward, the case for gold ETFs remains strong as a core all-round exposure in India. The post-pandemic shift has broadened the investor base for gold ETFs, with a mix of younger traders and risk-conscious savers using gold exposure to diversify. The return drivers–gold prices and exchange-rate movements–remain in play, especially since bullion is priced in USD and India imports most of its gold. The expected easing of the current account deficit through restored oil and gas supplies could support rupee stability, reducing downward pressure on the gold price. In the long run, gold ETFs offer liquidity, ease of access, and a credible route to bullion exposure that sits well within a diversified portfolio.
For deeper, data-driven insights that extend beyond price and flows, you can access Swastika's Sarthi AI stock assistant: Swastika's Sarthi AI stock assistant.
Frequently Asked Questions
What is the current trend in gold ETF inflows in India?
FY 2025-26 net inflows into gold ETFs are ₹68,868 crore; January 2026 inflows surpassed equity mutual fund inflows for the first time.
Why did May 2026 gold ETF net outflows occur and how significant were they?
There was a net outflow of about ₹725 crore in May 2026.
How do price movements impact gold ETF returns?
Returns depend on gold prices and exchange rate movements; gold is priced internationally in US dollars, and India imports most of its gold, making exposure effectively a dollar exposure.
What regulatory developments affect digital gold and EGR?
In November 2025, Sebi warned against digital gold products due to counterparty and operational risks; EGR has liquidity concerns and digital gold remains unregulated.
What other gold exposure options exist in India besides ETFs?
Other options include physical gold, digital gold (unregulated), Electronic Gold Receipts (low liquidity), and Sovereign Gold Bonds (no issues announced recently).
Conclusion
In the near term, Gold ETFs in India may test investors with price moves and periodic outflows, but they continue to deliver liquidity, diversification, and a regulated path to bullion exposure. The January 2026 milestone–where gold ETF inflows eclipsed equity mutual fund inflows–signals a structural shift in where retail money is placed within a balanced portfolio. The longer-term case remains intact: traders and investors who can navigate currency and policy wrappers stand to gain from disciplined allocations to Tata Gold ETF Share Price-linked exposure and related gold-based vehicles.
Open your trading and demat account here
Reference: Livemint
Latest Articles
Tata Gold ETF Share Price: Navigating India's Gold ETF Landscape In 2026


Key Takeaways
- Gold ETFs offer liquidity and diversification despite near-term headwinds.
- January 2026 marked a historic inflow shift, with Indian gold ETFs surpassing equity mutual fund inflows.
- Gold price cooled from ₹1.64 lakh per 10 g to ₹1.40 lakh as May 2026 saw outflow of ₹725 crore.
- Long-term, gold ETFs remain a core exposure for Indian investors.
Retail investors who track the tata gold etf share price are watching a turning point across India’s gold ETF landscape. Gold prices have cooled from a January peak of ₹1.64 lakh per 10 gm to around ₹1.40 lakh today. In the same window, Indian gold ETFs posted a dramatic shift in flows: January 2026 net inflows into Indian gold ETFs surpassed equity mutual fund flows for the first time, laying the groundwork for a new multipath dynamic in 2026. Yet, May 2026 delivered a net outflow of about ₹725 crore, reminding us that the path for gold exposure remains choppy in the near term.
Tata Gold ETF Share Price And The Indian Gold ETF Landscape
To understand the current setup, the key numbers tell a story of price and flow interactions. The gold price per 10 gm compressed from ₹1.64 lakh in January to roughly ₹1.40 lakh today, creating a near-term tailwind for investor appetite but also a price path that keeps ETF yields in check. In terms of flows, the period has delivered a mix of inflows and outflows: FY 2025-26 net inflows rose to ₹68,868 crore, while the past five fiscal years saw inflows totaling ₹30,213 crore. The net flow dynamic in January 2026–where gold ETFs surpassed equity mutual funds in inflows for the first time–suggests a substantial shift in where retail money is going within the broader investment landscape.
Notes: The data points above reflect the primary source figures described in the article. In short, the Tata Gold ETF share price moves in tandem with the bullion price and currency forces, with cross-border demand and domestic policy shaping the flow trajectory. The gold ETFs landscape has benefited from the post-pandemic shift towards alternative assets, while policy steps and currency dynamics continue to influence participation.
January 2026 Inflows Surpass Equity Mutual Funds: What It Means For Retail Investors
The January 2026 milestone signals a structural shift in investor behavior. Net inflows into Indian gold ETFs exceeded equity mutual fund inflows for the first time, reinforcing gold ETFs as a core diversification tool amid a regime of higher rates and currency volatility. The momentum carried into 2025-26, contributing to the year’s robust inflow tally of ₹68,868 crore. But the monthly cadence remains volatile: May 2026 recorded a net outflow of ₹725 crore, underscoring that macro factors (gold prices, USD strength, and rupee movements) can pivot demand quickly.
Macro Drivers Behind The Price Action: Dollar Strength, Inflation, And Import Duties
Several macro forces shape the Indian gold ETF price and flows. Persistent US inflation has kept expectations of rate hikes alive, reinforcing the dollar and making gold relatively less affordable for emerging economies, including India. A stronger dollar tends to restrain gold demand in rupee terms as imported bullion becomes pricier when converted to local currency. At the same time, higher import duties have reduced India’s gold imports, tempering overall demand. The rupee’s trajectory matters too: a stabilizing rupee can cushion downside and support ETF performance, while a weakening rupee can amplify returns for USD-priced gold exposures.
Comparative View Of Major Gold ETF Providers And Their Prices
Investors frequently compare the tata gold etf share price across major providers. Here are the key references that traders often monitor across leading gold ETF products:
- sbi gold etf share price
- hdfc gold etf share price
- axis gold etf share price
- kotak gold etf share price
- nippon india gold etf price
- canara robeco gold etf share price
Note that ETF prices track international bullion movements and currency corridors; the variation among these tickers reflects timing, liquidity, and cost structures. For a retail investor, the practical takeaway is to monitor the Tata Gold ETF share Price trajectory while understanding that the USD/INR dynamic underpins the real-dollar exposure of your Indian gold ETF investment.
Digital Gold, Physical Gold, And Regulatory Developments: What To Watch
Physical gold remains a tangible option, but storage and security costs persist. Digital gold is popular for its low entry thresholds and ease of use, but regulatory risk remains. The November 2025 Sebi warning highlighted significant counterparty and operational risks associated with digital gold products offered through online platforms without robust safeguards. Electronic Gold Receipts (EGR) are available for purchase and trading on BSE and NSE, but they suffer from lower liquidity compared with gold ETFs. Sovereign Gold Bonds were another popular option; no fresh issues have been announced in recent months. These dynamics matter for an investor deciding where and how to gain bullion exposure.
Long-Term Outlook: Why Gold ETFs Remain The Best All-Round Exposure
Looking forward, the case for gold ETFs remains strong as a core all-round exposure in India. The post-pandemic shift has broadened the investor base for gold ETFs, with a mix of younger traders and risk-conscious savers using gold exposure to diversify. The return drivers–gold prices and exchange-rate movements–remain in play, especially since bullion is priced in USD and India imports most of its gold. The expected easing of the current account deficit through restored oil and gas supplies could support rupee stability, reducing downward pressure on the gold price. In the long run, gold ETFs offer liquidity, ease of access, and a credible route to bullion exposure that sits well within a diversified portfolio.
For deeper, data-driven insights that extend beyond price and flows, you can access Swastika's Sarthi AI stock assistant: Swastika's Sarthi AI stock assistant.
Frequently Asked Questions
What is the current trend in gold ETF inflows in India?
FY 2025-26 net inflows into gold ETFs are ₹68,868 crore; January 2026 inflows surpassed equity mutual fund inflows for the first time.
Why did May 2026 gold ETF net outflows occur and how significant were they?
There was a net outflow of about ₹725 crore in May 2026.
How do price movements impact gold ETF returns?
Returns depend on gold prices and exchange rate movements; gold is priced internationally in US dollars, and India imports most of its gold, making exposure effectively a dollar exposure.
What regulatory developments affect digital gold and EGR?
In November 2025, Sebi warned against digital gold products due to counterparty and operational risks; EGR has liquidity concerns and digital gold remains unregulated.
What other gold exposure options exist in India besides ETFs?
Other options include physical gold, digital gold (unregulated), Electronic Gold Receipts (low liquidity), and Sovereign Gold Bonds (no issues announced recently).
Conclusion
In the near term, Gold ETFs in India may test investors with price moves and periodic outflows, but they continue to deliver liquidity, diversification, and a regulated path to bullion exposure. The January 2026 milestone–where gold ETF inflows eclipsed equity mutual fund inflows–signals a structural shift in where retail money is placed within a balanced portfolio. The longer-term case remains intact: traders and investors who can navigate currency and policy wrappers stand to gain from disciplined allocations to Tata Gold ETF Share Price-linked exposure and related gold-based vehicles.
Open your trading and demat account here
Reference: Livemint
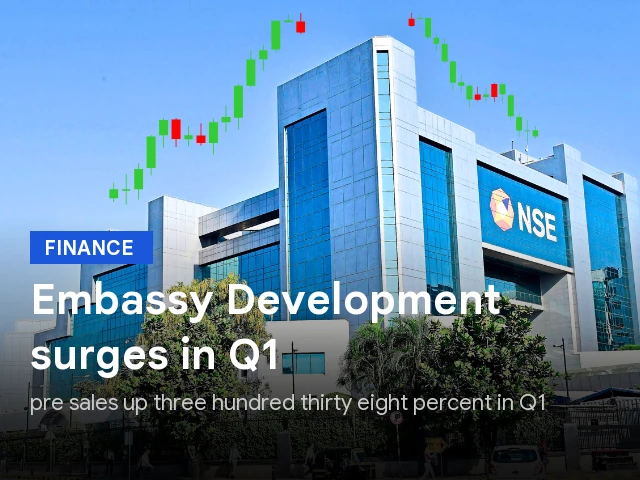
Embassy Developments Share Price: Q1 FY27 Pre-Sales Surge And NCD Funding
Key Takeaways
- embassy developments share price rallied after Q1 FY27 pre-sales jumped 338% to Rs 868 crore.
- Collections rose to Rs 496 crore in Q1 FY27, up 54% year-on-year.
- The board approved up to Rs 1,170 crore in NCD funding, lifting the total issue size to Rs 1,570 crore.
- Q4 FY26 revenue from operations fell 61.5% year-on-year to Rs 342.46 crore, with a net loss of Rs 323.78 crore.
Embassy Developments Share Price And Q1 FY27 Pre-Sales Surge Analysis
What happens when a single quarterly datapoint shifts the narrative around a property developer? The embassy developments share price moved higher as Q1 FY27 pre-sales surged 338% to Rs 868 crore, up from Rs 198 crore in Q1 FY26. This jump signaled robust demand across residential, commercial, and SEZ projects, and it lit up investor screens as market participants debated how much of the momentum would translate into a steadier operating profit in FY27 and beyond. The stock also rose 4.56% to Rs 64.88, reflecting a cautiously optimistic mood around growth prospects and balance-sheet management.
Against this backdrop, the company reported Q1 FY27 data while also revealing a larger financing plan that could shape its balance sheet for quarters to come. Collections rose 54% to Rs 496 crore in Q1 FY27, compared with Rs 322 crore in Q1 FY26, underscoring improving cash receipts that can help sustain project execution. Yet the Q4 FY26 results remind investors of volatility in quarterly earnings: revenue from operations declined 61.5% year-on-year to Rs 342.46 crore, and the consolidated net loss in Q4 FY26 widened to Rs 323.78 crore from a Rs 129.53 crore profit in Q4 FY25.
As of 30 June 2026, Embassy Developments’ net institutional debt stood at around Rs 3,363 crore, after adjusting for cash and cash equivalents of approximately Rs 1,202 crore. In response to funding needs, the board approved raising additional funds of up to Rs 1,170 crore through the issuance of non-convertible debentures (NCDs) on a private placement basis in one or more tranches and/or series. With this approval, the overall issue size has been enhanced from up to Rs 400 crore to up to Rs 1,570 crore. The face value of each NCD is Rs 1 lakh. Embassy Developments is a real estate developer of residential, commercial, and SEZ projects.
Behind these numbers lies a narrative about capital intensity and the path to profitability. A higher debt load paired with new funding commitments can extend the runway for project completion, but it also adds interest and refinancing risk–especially if pre-sales do not convert into sustained collections or yields improve materially. For a retail investor, this is a story of momentum meeting balance-sheet pressure, where the stock’s tide may turn on how effectively the company translates front-end demand into mid-term cash flow and earnings. To dive deeper into this dynamic, consider exploring Swastika’s Sarthi AI stock assistant for institutional-grade stock research: Swastika's Sarthi AI stock assistant.
Embassy Developments Share Price And Cash Flows: Understanding Collections And Revenue
In Q1 FY27, collections rose to Rs 496 crore, up 54% from Rs 322 crore in Q1 FY26, signaling improving near-term cash inflows that can support ongoing development activity across the portfolio.
However, the Q4 FY26 results show revenue from operations standing at Rs 342.46 crore, a 61.5% year-on-year decline, reflecting lingering top-line pressures despite the momentum in front-end bookings. The debt narrative remains a central driver for investors: as of 30 June 2026, the company carried a net institutional debt exposure of Rs 3,363 crore, after accounting for cash and cash equivalents of around Rs 1,202 crore. This backdrop underscores the importance of linking pre-sales momentum to actual revenue realization and cash generation in the quarters ahead.
Debt And Funding Strategy: Embassy Developments Share Price Reacts To NCD Approval
To support growth and working capital, the board approved raising additional funds up to Rs 1,170 crore through non-convertible debentures (NCDs) on a private placement basis in one or more tranches and/or series. This approval expands the total issue size from up to Rs 400 crore to up to Rs 1,570 crore, with the face value of each NCD set at Rs 1 lakh. Such financing moves are common in capital-intensive real estate plays where project execution requires substantial upfront capital, but they also introduce refinancing risk and higher interest costs if revenue delivery lags behind the financing plan.
As of 30 June 2026, the net institutional debt stood at around Rs 3,363 crore after adjusting for cash and cash equivalents of approximately Rs 1,202 crore, highlighting the ongoing need for a disciplined balance between debt levels and cash generation from operations as Embassy Developments pursues its residential, commercial, and SEZ projects. The NCD plan signals a structured approach to fund ongoing or upcoming development, yet it also elevates the importance of tracking how pre-sales, collections, and timely project completions translate into earnings and debt service capacity over the next few quarters.
Q4 FY26 Financials: Revenue Decline And Net Loss Provide Clarity For Long-Term Valuation
Q4 FY26 revenue from operations was Rs 342.46 crore, marking a 61.5% decline year-on-year. The company reported a consolidated net loss of Rs 323.78 crore in Q4 FY26, contrasting with a net profit of Rs 129.53 crore in Q4 FY25. This juxtaposition underscores the ongoing profitability challenges amid a revenue deterioration while the business continues to push larger, capital-intensive projects. For investors, the key takeaway is that pre-sales momentum must be translated into sustainable cash flows and earnings to support a durable improvement in the embassy developments share price over time.
Investment Considerations For Retail Investors: Evaluating Risk, Valuation, And Time Horizon
From a retail investor perspective, the central question is whether the early demand signals can convert into durable profitability. The strong Q1 FY27 pre-sales performance suggests demand resilience across Embassy Developments’ portfolio, but the accompanying rapid debt expansion and the NCD funding plan introduce refinancing and interest-rate risks that could pressure earnings if project execution lags or if market conditions tighten. The embassy developments share price reaction is therefore a function of both demand dynamics and the company’s ability to monetize those demand signals into cash flow, not just paper gains from pre-sales.
Frequently Asked Questions
What caused Embassy Developments share price to move following Q1 FY27 pre-sales data?
The embassy developments share price rose as Q1 FY27 pre-sales surged 338% to Rs 868 crore, up from Rs 198 crore in Q1 FY26, with the stock rallying 4.56% to Rs 64.88.
What were Embassy Developments Q1 FY27 pre-sales figures?
Pre-sales surged 338% to Rs 868 crore in Q1 FY27, compared with Rs 198 crore in Q1 FY26.
What is the debt position for Embassy Developments as of 30 June 2026?
Net institutional debt stood at around Rs 3,363 crore after adjusting for cash and cash equivalents of approximately Rs 1,202 crore.
What funding plan did the board approve for Embassy Developments?
The board approved raising up to Rs 1,170 crore through non-convertible debentures on a private placement basis, expanding the total issue size to up to Rs 1,570 crore; the face value of each NCD is Rs 1 lakh.
What were Embassy Developments Q4 FY26 revenue and profit/loss figures?
Q4 FY26 revenue from operations was Rs 342.46 crore, down 61.5% year-on-year, with a consolidated net loss of Rs 323.78 crore versus Rs 129.53 crore profit in Q4 FY25.
Conclusion
The embassy developments share price currently reflects a tug-of-war between demand signals and the realities of a debt-funded growth agenda. The 338% pre-sales surge to Rs 868 crore in Q1 FY27 is a strong indicator of demand across its residential, commercial, and SEZ ventures, while the Q4 FY26 revenue decline and a Rs 3,363 crore net institutional debt backdrop show that profitability and balance-sheet stability must catch up with momentum.
Open your trading and demat account here
Referred by: Business Standard
Referred by: Business Standard

Icici Bank Share Price Momentum: Upside Signals Across Key Stocks
Key Takeaways
- Nifty earnings are set to grow 10% YoY in Q1FY27, with Large-Cap growth at 17%, Mid-Cap 15%, and Small-Cap 16%.
- Motilal Oswal targets Eternal Rs 380 with 32% upside and includes SBI, icici bank stock, M&M, Titan, InterGlobe Aviation stock price, Bharti Airtel stock price, Shriram Finance stock price, HDFC AMC, and BSE.
- Eternal carries Rs 380 target with 32% upside; SBI Rs 1,300 (26%); InterGlobe Aviation stock price Rs 6,590 (22%); Titan Rs 5,250 (14.4%); Bharti Airtel stock price Rs 2,270 (18%); Shriram Finance stock price Rs 1,230 (16%); HDFC AMC Rs 3,250 (17%); BSE Rs 4,350 (18%).
- icici bank share price could rally up to 27% per the broker's view; M&M 23%; Bharti Airtel 18%; Shriram Finance 16%.
In markets where icici bank share price moves ripple through retail portfolios, the next quarter's earnings will shape the next leg of upside. As Q1FY27 earnings season begins, analysts expect Nifty earnings to grow 10% year-on-year, with revenue growth across segments at 17% for large-caps, 15% for mid-caps, and 16% for small-caps. This backdrop creates a canvas for selective upside in a mix of banks, consumer names, and large diversified players.
Retail investors should read these signals carefully: a broad-based earnings tilt supports upside across a diversified stock universe. Below is a structured look at what the latest forecasts imply for icici bank share price and a handful of related names investors often discuss on earnings days.
Icici Bank Share Price Momentum: What The Latest Upside Signals Mean For Investors
The consensus forecast for Q1FY27 from Motilal Oswal points to a 10% YoY growth in Nifty earnings, with large-cap revenue growth at about 17%, mid-cap at 15%, and small-cap at 16% YoY. This is a supportive backdrop for stocks that carry visible earnings expansion and resilient gross margins. In this framing, several stocks are highlighted with explicit target prices and upside potential.
| Stock | Target Price (Rs) | Upside |
|---|---|---|
| Eternal | 380 | 32% |
| state bank of india stock price | 1300 | 26% |
| icici bank stock | – | Up to 27% |
| M&M | 3910 | 23% |
| titan company stock price | 5250 | 14.4% |
| stock price of interglobe aviation | 6590 | 22% |
| bharti airtel stock price | 2270 | 18% |
| shriram finance stock price | 1230 | 16% |
| HDFC AMC | 3250 | 17% |
| BSE | 4350 | 18% |
Note how the list blends a bank, an insurer/asset manager, a diversified conglomerate, consumer, and an airline-related exposure. The table helps readers compare upside across names in a compact format. The overarching takeaway is that a broad, earnings-led rally could support selective, high-conviction bets beyond just the big-name banks.
For investors seeking a practical way to test ideas, Swastika's Sarthi AI stock assistant can help model scenarios, from upside breakouts to risk-adjusted returns. Swastika's Sarthi AI stock assistant offers institutional-grade insights accessible to retail users and can be a useful complement to your own research process.
Nifty Earnings Outlook For Q1FY27: Revenue Growth Across Large-Cap, Mid-Cap, And Small-Cap Stocks
The consolidated outlook suggests a healthy mix of profitability improvements. Motilal Oswal notes that large-cap firms are expected to drive revenue growth of 17% YoY, while mid-cap and small-cap segments may see 15% and 16% YoY growth, respectively. This implies a fairly broad-based improvement in earnings quality across the market, which in turn can support a constructive price environment for equities across capitalization bands.
Motilal Oswal's Price Targets And Upside Across The Top Stocks
Key targets compiled in the report cover Eternal (Rs 380, 32% upside), SBI (Rs 1,300, 26% upside), icici bank stock (up to 27%), M&M (Rs 3,910, 23%), Titan (Rs 5,250, 14.4%), InterGlobe Aviation stock price (Rs 6,590, 22%), Bharti Airtel stock price (Rs 2,270, 18%), Shriram Finance stock price (Rs 1,230, 16%), HDFC AMC (Rs 3,250, 17%), and BSE (Rs 4,350, 18%). These callouts illustrate a breadth of upside across financials, consumer, energy-adjacent exposure, and market infrastructure.)
In practice, investors should treat these targets as directional guidance rather than guaranteed outcomes. The range of upside highlights an opportunity set that can be selectively exploited with a disciplined risk approach. The broader message is that a well-structured, diversified approach may capture upside across multiple themes rather than concentrating bets on a single stock or sector.
Putting It All Together: Building A Focused, Risk-Managed Portfolio
Given the spread of upside across names, a practical strategy would be to build a focused basket of 3–5 names that align with your risk tolerance and time horizon. Consider weighting around 60–70% in core holdings (such as icici bank stock, state bank of india stock price, and M&M) while reserving room for selective, opportunistic positions in Titan, InterGlobe Aviation stock price, Bharti Airtel stock price, Shriram Finance stock price, HDFC AMC, and BSE. Always anchor positions to explicit price targets and maintain stop-loss discipline to control downside risk in volatile markets.
Frequently Asked Questions
What is Eternal's target price and upside?
Eternal — Target price Rs 380; Upside 32%.
What is the Nifty earnings outlook for Q1FY27 and the revenue growth by segment?
Nifty earnings are expected to grow 10% YoY, with Large-Cap revenue growth at 17%, Mid-Cap 15%, and Small-Cap 16% YoY.
What is the target price and upside for the state bank of india stock price?
state bank of india stock price — Target price Rs 1,300; Upside 26%.
What is the target price and upside for the stock price of interglobe aviation?
stock price of interglobe aviation — Target price Rs 6,590; Upside 22%.
What is the Titan Company stock price target and its upside?
Titan Company — Target price Rs 5,250; Upside 14.4%.
Conclusion
The current set of upside calls across Eternal, SBI, icici bank stock, M&M, Titan, InterGlobe Aviation stock price, Bharti Airtel stock price, Shriram Finance stock price, HDFC AMC, and BSE, together with a credible Nifty earnings backdrop, suggests that well-chosen bets can still yield meaningful returns in the near term. The essential takeaway for a retail investor is to blend price targets with a structured risk framework, using them as guardrails rather than guarantees. One practical mental model you can apply now is to construct a price-target ladder: identify your core, place clearly defined entry points, and incrementally add exposure as price action confirms the upside path. If you want a hands-on way to stress-test theses, consider the Sarthi AI stock assistant as a research partner to validate ideas and refine risk controls before committing capital.
Open your trading and demat account here
Referred by: Zerodha Pulse (economictimes.indiatimes.com)
Referred by: Zerodha Pulse (economictimes.indiatimes.com)

MCX Share Price Insight: Gold And Silver Moves Amid Iran Tensions
Key Takeaways
- Geopolitical risk drives gold and silver futures on MCX.
- MCX gold August futures price stands at Rs 1,45,130 per 10 grams, down 0.1%.
- MCX silver September futures price is Rs 2,30,711 per kg, down 0.06%.
- Retail investors should consider energy prices and Fed outlook when positioning.
On a day when geopolitical risk dominates market chatter, the mcx share price becomes a quick read on investor risk appetite. MCX gold August futures price stands at Rs 1,45,130 per 10 grams, down 0.1%. MCX silver September futures price is Rs 2,30,711 per kg, down 0.06%. The gold price in US dollars is around $4,100 an ounce, after a 1.4% loss in the prior session. At 9:02 am, traders weighed the implications of renewed US strikes on Iran, the escalation in oil prices, and what the Fed’s rate outlook might signal for the rest of the week. All stock exchange data is delayed upto 3 mins and is meant to reflect live MCX trading dynamics rather than settle values.
Understanding The MCX Share Price In A Geopolitical Market
The MCX share price and the prices of precious metals traded on MCX often reflect a single global nervous system: risk sentiment. In this session, the price of gold futures mcx, while the data show MCX gold price movement, stands at Rs 1,45,130 per 10 grams, down 0.1%, and the mcx silver price has moved to Rs 2,30,711 per kg, down 0.06%. The USD price for gold hovered near $4,100 per ounce. These numbers reflect live MCX data and are delayed by up to three minutes, a normal condition for intraday market monitoring. The takeaway for retail investors is that geopolitical risk quickly flows into precious metals and even mcx share price momentum as traders reassess risk and liquidity.
For deeper, scenario-based stock analysis, consider Swastika's Sarthi AI stock assistant for granular research on any stock or index. The rest of this article unpacks what today’s data imply for your portfolio, and how to translate it into practical steps.
Gold Futures MCX: Interpreting The 0.1% Dip In A Risk-On/Risk-Off Environment
The 0.1% dip in the gold futures mcx price signals something about short-term risk appetite. If geopolitical risk persists, gold tends to coalesce as a safe haven; intraday moves can be influenced by currency moves and energy costs. The current price of Rs 1,45,130 per 10 grams acts as a reference level for intraday trading, while the 0.1% decline suggests a momentary pause in the safe-haven bid. In USD terms, gold remains near $4,100 per ounce, reflecting a global risk-off tone that has not turned into a sustained rally.
The 9:02 am data feed indicates fresh momentum from headlines and policy cues. The energy complex has moved higher as crude prices soared on the strikes and the withdrawal of waivers, which can feed inflation risk and support gold in the longer run. For the retail investor, this means watching the next few sessions for a breakout above or below the Rs 1,45,130 level to gauge the next directional bias.
To manage risk in such a volatile environment, consider setting a clear stop-loss on any gold futures mcx position and avoiding overexposure to a single instrument. You can also use a layered approach–holding a core allocation to gold while trading near-term moves in a disciplined manner.
Mcx Silver Price Movement And Its Signals For Diversified Portfolios
The mcx silver price for September futures sits at Rs 2,30,711 per kg, down 0.06%. Silver often tracks gold in risk-off phases but can diverge when industrial demand or currency moves shift the supply-demand balance. In this session, the price is down slightly, with gold near $4,100 per ounce. For a diversified portfolio, silver can provide a hedge against inflation and currency risk, but it also carries higher beta, which means more pronounced swings during geopolitical headlines. The live MCX quotes are delayed by up to three minutes, so use them as intraday guidance rather than a settlement price.
Because energy prices and policy expectations are part of the macro story, some investors use silver as a supplementary hedge to gold rather than a stand-alone anchor. The mcx silver price reacts quickly to changes in the risk environment, so setting alert levels and risk budgets is prudent when adding or trimming positions.
Geopolitical Tensions, Oil Flows, And The Fed Outlook: Implications For Retail Investors
The geopolitical shock waves extend beyond the Iran issue. The US Central Command said it launched powerful strikes in response to Iranian attacks on shipping in the Strait of Hormuz, underscoring a sharp shift in risk perception across commodity markets. At the same time, Washington revoked a waiver that had allowed Tehran to sell oil globally–a move that tends to push crude prices higher and magnify inflation concerns, which can influence precious metals as hedges. In this context, the mcx share price of energy-linked equities and commodity producers may reflect greater volatility in the near term.
The Fed’s rate outlook remains a focal point for investors. Hints from policymakers about the pace of future hikes or pauses can influence gold’s risk-off appeal. If inflation remains firm, gold can strengthen as a hedge, whereas if rate expectations ease and liquidity improves, metal gains may be more measured. The data are a snapshot from MCX quotes and can move with headlines; use them to calibrate risk decisions rather than to project a precise return.
Practical Steps For Retail Investors Balancing MCX Share Price And Precious Metals
Here are practical steps to connect today’s data to a concrete plan. First, set a core exposure to precious metals that matches your risk tolerance and investment horizon. Second, use intraday levels such as Rs 1,45,130 per 10 grams for gold and Rs 2,30,711 per kg for silver as reference points to add or trim risk, recognizing that these are live quotes and may move quickly. Third, consider hedging with MCX-labeled instruments–like gold futures mcx or mcx options–only if you have capital to withstand drawdowns and a clearly defined risk budget. Finally, watch energy prices and the Fed outlook; shifts in crude and dollar strength often precede metal moves.
For deeper scenario planning, Swastika’s Sarthi AI stock assistant provides institutional-grade research on any stock or index. Swastika's Sarthi AI stock assistant can help you explore scenarios, stress tests, and risk-controlled strategies aligned with your goals.
Related Reads
- How the mcx share price Reacted to the 2020 Negative Crude Shock: A Retail Investor's Guide
- Gold Price Today on MCX India: Intraday Moves Confirm Gold at Rs 1,44,825 and Silver at Rs 2,28,235
Frequently Asked Questions
What is the current MCX gold price for August futures?
MCX gold August futures price stands at Rs 1,45,130 per 10 grams, down 0.1%.
What is the MCX silver price for September futures?
MCX silver September futures price is Rs 2,30,711 per kg, down 0.06%.
What was gold's price in USD on this update?
Gold price in US dollars was around $4,100 per ounce, with a prior session loss of 1.4%.
What geopolitical actions affected these moves?
The United States launched powerful strikes in response to Iranian attacks on shipping in the Strait of Hormuz, and Washington revoked a waiver allowing Tehran to sell oil globally; crude prices soared.
What should retail investors consider given this data?
Investors should weigh energy prices, the Fed's outlook on rates, and MCX share price momentum when positioning in gold, silver, or related instruments.
Conclusion
The takeaway for retail investors is simple: today’s gold and silver moves on MCX are not isolated signals but a reflection of energy, inflation, and rate expectations in a volatile geopolitical landscape. Use the data as a trigger to review your risk budgets, adjust hedges if needed, and remain flexible as the global macro story unfolds.
Next-step mental model: frame your decisions around two scenarios–one where geopolitical tensions intensify and energy costs rise, and another where policy signals ease and liquidity remains supportive. In either case, a disciplined plan that combines diversification, clear risk limits, and timely data will help you navigate an uncertain, high-volatility environment.

HPCL Share Price: 301,000 Monthly Searches And One-Month Movement
Key Takeaways
- HPCL share price rose 4.71% in the last month while the BSE Oil & Gas index fell 1.39% to 26081.8.
- The stock price is Rs 390.4 with 65,707 shares traded so far; average daily volumes in the past month were about 3.86 lakh shares.
- HPCL hit a 52-week high of Rs 508.45 on 05 Jan 2026 and a 52-week low of Rs 316.2 on 23 Mar 2026.
- Over the last year, the BSE Oil & Gas index fell 8.66% while the SENSEX fell 7.04%.
HPCL Share Price: 301,000 Monthly Searches And Movement
HPCL share price has become a focal point for investors watching India's energy sector. Over the last month, HPCL share price rose 4.71%, even as the BSE Oil & Gas index declined 1.39% to 26081.8. The SENSEX, by contrast, rose 5.84% in the same period. The stock price today sits around Rs 390.4, and 65,707 shares were traded on the BSE so far this session. Average daily volumes in the past month stood at about 3.86 lakh shares. The stock hit a record high of Rs 508.45 on 05 Jan 2026 and a 52-week low of Rs 316.2 on 23 Mar 2026. These data points set the frame for any HPCL stock price decision today.
- HPCL share price rose 4.71% in the last month while the BSE Oil & Gas index fell 1.39% to 26081.8.
- Stock price around Rs 390.4 with 65,707 shares traded so far; average daily volumes were about 3.86 lakh shares.
- HPCL hit a 52-week high of Rs 508.45 on 05 Jan 2026 and a 52-week low of Rs 316.2 on 23 Mar 2026.
- Over the last year, the BSE Oil & Gas index fell 8.66% while the SENSEX fell 7.04%.
HPCL Share Price Today: Price Dynamics, Volume, And Market Context
The immediate price action shows the hpcl stock price around Rs 390.4 this session. On the BSE, 65,707 shares were traded in the HPCL counter so far; average daily volumes in the past month were 3.86 lakh shares, reflecting steady liquidity. The BSE Oil & Gas index is down 1.39% to 26081.8, and it is down 0.29% over the last one month. The SENSEX has risen 5.84% in the same period, while the oil-and-gas sub-index has tumbled 8.66% over the last year, compared with the SENSEX's 7.04% decline. In the peer group, Bharat Petroleum Corporation Ltd decreased 3.55% and Indian Oil Corporation Ltd lost 2.92% on the day.
In context, HPCL’s price action sits between a long-standing high and low band: a peak near Rs 508.45 seen in January 2026 and a low around Rs 316.2 from March 2026. Such ranges are typical for energy majors that ride refinery margins and crude price volatility. Traders should watch for a volume-led move; a spike above the trailing averages would suggest renewed upward momentum, while waning volumes could signal consolidation.
For deeper stock-specific insights, consider Swastika's Sarthi AI stock assistant.
HPCL Share Price Vs Sector And Peers: Interpreting The Signals
HPCL share price movements should be weighed against sector-wide trends. The BSE Oil & Gas index's -1.39% intraday move and -0.29% month-on-month change contrast with the 5.84% monthly rise in the SENSEX. The year-long view shows the Oil & Gas index down 8.66% versus the SENSEX's 7.04% drop. This divergence suggests stock-specific catalysts–such as refinery margins, marketing margins, or company-specific updates–can drive HPCL stock price apart from broader sector moves.
52-Week Highs And Lows: What The Range Says About HPCL Stock Price
A price corridor is visible when you compare the 52-week high and low. HPCL has hit a high of Rs 508.45 (on 05 Jan 2026) and a low of Rs 316.2 (on 23 Mar 2026). The current price of Rs 390.4 sits in the middle of that range, implying potential for further upside if crude and margins cooperate, while risk persists if the macro environment worsens.
Market Context And Practical Takeaways For Retail Investors
For retail investors, the HPCL share price movement illustrates momentum within a volatile oil and gas market. The month’s gain sits alongside a broader sector pullback in the year, with the BSE Oil & Gas index down 8.66% vs. SENSEX down 7.04%. The stock price around Rs 390.4 must be weighed against the 52-week range and the latest volume signals. The March low of 316.2 and January high of 508.45 serve as reference points for risk control and position sizing.
To navigate these moves with more precision and to access institutional-level research on any stock or index, consider Swastika's Sarthi AI stock assistant.
Related Reads
Frequently Asked Questions
What is the current HPCL share price?
As of the latest update, HPCL share price stands at Rs 390.4 on the BSE.
How did HPCL perform over the last month?
HPCL share price rose 4.71% in the last month, while the BSE Oil & Gas index fell 1.39% and the SENSEX rose 5.84%.
What are the 52-week highs and lows for HPCL?
HPCL hit a 52-week high of Rs 508.45 on 05 Jan 2026 and a 52-week low of Rs 316.2 on 23 Mar 2026.
What was the trading volume for HPCL on the latest session?
On the BSE, 65,707 shares were traded in the HPCL counter so far; average daily volumes in the past month were about 3.86 lakh shares.
How did the BSE Oil & Gas index and SENSEX perform year over year?
The BSE Oil & Gas index is down 8.66% over the last year, while the SENSEX is down 7.04%.
Conclusion
The retail-investor takeaway is that HPCL stock price momentum can coexist with sector-level softness, but sustained moves require confirmation from volume and macro cues. If HPCL can sustain above the Rs 395–400 zone with steady volumes, the path toward the next resistance near Rs 450–480 becomes credible; otherwise, expect consolidation as the market weighs refinery margins and regulatory signals. A disciplined approach–price levels, volumes, and risk controls–helps you decide when to add exposure or wait for a clearer setup.

Hpcl Share Price And Oil Shock: What Indian Retail Investors Should Do Now
Key Takeaways
- Oil prices jumped as geopolitical tensions intensified, and hpcl share price moved lower as oil-sensitive stocks tumbled.
- Brent crude rose to $76 a barrel and WTI stood around $72, lifting energy equities and pressuring related Indian stocks.
- The Strait of Hormuz remains a critical chokepoint, delivering about one-fifth of global energy supply and amplifying risk.
- Retail investors should prioritize risk management and leverage research tools like Swastika's Sarthi AI stock assistant to navigate volatility.
Hpcl Share Price And Oil Surge: What Indian Investors Should Watch
On a day when crude prices climbed on geopolitical risk, hpcl share price moved lower as oil-sensitive stocks tumbled up to 5% after the United States carried out airstrikes on Iran and reinstated sanctions on Iranian crude sales. hpcl stock price fell over 4% to Rs 388 on the BSE, while bpcl stock price plunged 5% to Rs 299 and iocl stock price slid 3.5% to Rs 137. Indigo stock price declined over 3% to Rs 5,220, spicejet stock price dipped over 1%, and interglobe aviation share price came under pressure as the day wore on. The broader market saw sectoral weakness with Nifty FMCG down 1%, Nifty Oil & Gas down 2%, and Nifty Auto down 1.3% as crude benchmarks firmed.
Brent crude futures climbed $1.62, or 2.16%, to $76 a barrel, while U.S. West Texas Intermediate crude gained $1.63, or 2.31%, to $72 a barrel. These moves followed a session where prices had already edged higher after the market had previously priced in the withdrawal of a general license that had allowed Iranian crude sales. The rough linkage between crude prices and stock movements in energy-related names remains vivid: when crude climbs, energy stocks often face pressure, particularly in times of heightened geopolitical risk.
The Strait of Hormuz is a pivotal route for energy shipments from the Middle East to global markets. It handles cargoes equivalent to about one-fifth of global energy supply, underscoring why any disruption there can feed through to prices and volatility across oil-importing economies like India. The latest escalation has reminded markets that shipping through Hormuz remains vulnerable to geopolitical shocks, a reality that can translate into larger swing bands for oil-connected equities.
Analysts had noted that oil price dynamics were already strained by the evolving geopolitical backdrop. The price moves came even as oil prices had retreated to pre-war levels after the United States withdrew the general license that had permitted Iranian crude sales in the prior month. This tug-of-war between sanctions, supply concerns, and market expectations keeps the energy complex in a state of heightened sensitivity, which retail investors should monitor closely as they review their exposure to energy-linked names and the broader market cycle.
According to Amin Nasser of Saudi Aramco, any prolonged disruption in the Strait of Hormuz could delay the return of stability in global oil markets until 2027.
The implications of such commentary ripple through the Indian markets, where energy and transport-linked players often price in longer-term supply risk. For instance, hpcl share price and its peers in the oil and gas space are not just reacting to the latest news; they are reflecting assessments of potential disruption duration, sanctions trajectories, and the pace at which global crude markets might re-stabilize. In Indian markets, this translates into visible price moves in HPCL, BPCL, IOCL, and airlines that rely on fuel cost stability as a core input in their margins.
Oil Prices Rise On Iran Strikes: Macro Backdrop For Indian Markets
The geopolitical event backdrop–the US strikes on Iran and the reimposed sanctions on Iranian crude–has sharpened the focus on energy supply chains, with Hormuz-linked risk entering price formation more decisively. The Brent-WTI spread and the absolute level of crude prices matter for Indian refiners and consumer-connected sectors. Brent at $76 and WTI at $72 supply a narrative where import costs and refining margins could drift, depending on how long elevated supply risks persist and how sanctions evolve. While multiple moving parts drive the market, the core takeaway for Indian investors is that external shocks in energy supply chains can quickly translate into sector rotations, particularly among oil-sensitive stocks and transport-connected equities.
From a sector perspective, the immediate reaction was a tilt away from risk assets in the energy complex and related industries. The Nifty Oil & Gas index showed a fall of around 2%, while the Nifty Auto index slipped about 1.3%. This is consistent with a broad risk-off environment when macro headlines dominate day-to-day price action and investors reassess fuel-related costs, export dynamics, and the potential for higher domestic inflation if crude remains firm.
Indigo Stock Price And Interglobe Aviation Performance On A Turbulent Day
In the same trading session, indigo stock price moved lower as part of the sell-off in airline-linked equities amid higher fuel costs and broader macro jitters. IndiGo’s stock price declined over 3% to Rs 5,220, reflecting how sensitive aviation stocks are to energy price shifts and the wider risk appetite. Interglobe aviation share price, while not revealing a precise intraday level in the report, also faced downward pressure as the travel sector contends with volatile fuel dynamics and the potential for higher operating costs in a higher-crude-price regime.
SpiceJet stock price followed a similar trajectory, dipping over 1% as market participants reassessed the viability of near-term earnings growth in a high-cost environment. The overall mood in aviation and other oil-sensitive equities underscores the spillover effect of crude moves into sectors that are directly or indirectly dependent on fuel costs and macro stability. While some of the larger refiners and downstream players faced more pronounced moves, the broader market’s tone remained tethered to how the energy complex evolves in the weeks ahead.
Oil-Sensitive Stocks In Focus: HPCL, BPCL, IOCL And Airlines
HPCL stock price, one of the most watched oil stocks in India, tumbled over 4% to Rs 388 on the BSE in the session. BPCL stock price bore the brunt with a 5% slide to Rs 299, highlighting how sanctions-related risk and rising crude costs can rapidly feed through to valuations. IOCL stock price did not stay immune, slipping 3.5% to Rs 137, underscoring that even the largest public-sector oil majors can see pressure when macro risk intensifies. Airlines, including indigo stock price and spicejet stock price, also faced selling pressure: indigo stock price fell over 3% to Rs 5,220, while spicejet stock price dipped slightly, off by more than a percent. The combined price action of HPCL, BPCL, IOCL and aviation stocks paints a clear picture: the energy and transport linkages are closely interwoven with macro risk, and any escalation in the Iran-related tension or Hormuz risk is likely to continue pressuring these names in the near term.
For investors tracking the energy complex, the direct link between crude prices, refinery margins, and downstream stock performance is a recurring theme. The stock market’s reaction on this day underscores the importance of monitoring not just company fundamentals but also macro signals–especially those tied to energy supply routes that can influence both pricing and demand dynamics. In such a landscape, a disciplined approach to position sizing, stop losses, and exposure to energy-linked equities becomes critical for retail investors who seek to balance potential gains with downside risk.
Practical Steps For Retail Investors In This Volatile Oil-Driven Market
First, acknowledge the macro backdrop: oil prices can swing rapidly on geopolitical developments, and that swing tends to translate into stock volatility–especially for hpcl share price and other energy-linked equities. Second, consider risk management tools and hedging strategies that align with your time horizon and risk tolerance. Third, emphasize stock-specific research to determine which names can withstand higher energy costs, maintain refining margins, or benefit from resilient domestic demand. Fourth, don’t ignore the value of research and analytical tools that can help you navigate volatility and uncover long-term value in a crowded field of headlines. In times like these, a structured framework helps transform noise into actionable decisions rather than reactive trades.
As you review your portfolio, a practical step is to look at both price action and underlying fundamentals: refinery exposure, balance-sheet strength, and margins in a high-crude-price environment. If you want a deeper, institutional-grade research perspective on any stock or index, you can explore Swastika's Sarthi AI stock assistant – Swastika's Sarthi AI stock assistant – for insights tailored to retail investors. This tool can help translate macro signals into stock-level implications, supporting more informed decision-making rather than reactionary moves.
In short, the key to navigating this volatility is to combine macro awareness with a disciplined stock-picking process. Focus on resilience in cash flows, favorable competitive positioning, and the ability to adapt to higher energy costs without eroding margins. Incorporating a structured framework for assessing hpcl share price and other oil-sensitive stocks will help you stay objective, even as headlines flash across screens.
Frequently Asked Questions
How did hpcl share price move on the day of the Iran-related tensions?
hpcl stock price fell over 4% to Rs 388 on the BSE as oil-sensitive stocks were pressured by the geopolitical event.
Which other Indian oil stocks and airlines moved on the same day, and by how much?
BPCL plunged 5% to Rs 299, IOCL declined 3.5% to Rs 137, and Indigo stock price fell over 3% to Rs 5,220. SpiceJet stock price dipped over 1%, and interglobe aviation share price faced pressure as well.
What were the movements in Brent and WTI crude futures?
Brent crude futures climbed $1.62, or 2.16%, to $76 a barrel, while U.S. West Texas Intermediate crude gained $1.63, or 2.31%, to $72 a barrel.
Why is the Strait of Hormuz so important for global oil supply?
The Strait of Hormuz handles cargoes equivalent to about one-fifth of global energy supply, making it a critical chokepoint for crude shipments from the Middle East to global markets.
What should retail investors consider doing in this volatile environment?
Retail investors should focus on risk management, consider hedging and disciplined stock selection, monitor macro signals related to oil prices, and potentially use research tools like Swastika's Sarthi AI stock assistant to inform long-term decisions.
Conclusion
Geopolitical shocks and renewed energy-supply concerns create a challenging backdrop for retail investors, especially when energy-linked equities swing in tandem with crude prices. The practical takeaway is clear: manage risk with discipline, stay tethered to fundamentals, and use reliable tools to interpret macro signals in the context of stock-level dynamics. If you’re evaluating hpcl share price or any oil-sensitive exposure, framing your approach around resilience, margin protection, and prudent position sizing can help you navigate the volatility ahead. For ongoing research and a smarter, data-driven approach to stock analysis, consider Swastika's Sarthi AI stock assistant as part of your investment toolkit: Swastika's Sarthi AI stock assistant.
Next steps: build a small, well-considered watchlist of refiners and energy-linked flight-related stocks, set predefined risk triggers for hpcl share price and related names, and use research aids to continuously reassess macro-driven upside and downside scenarios. This blended approach can enable you to participate in potential upside while keeping downside risk in check, turning volatility into a pathway for disciplined, informed investing rather than fear-driven moves.
Big Budget


Popular Articles




.avif)
.avif)

.avif)




START YOUR INVESTMENT JOURNEY
Get personalized advice from our experts
- Dedicated RM Support
- Smooth and Fast Trading App
