
IC Electricals Company Limited IPO: Apply, Avoid, or Wait for Listing?


Key Takeaways
- IC Electricals Company Limited's SME IPO opens on 3 July 2026 but price band, lot size, and issue size are not yet announced.
- GMP data is not available yet, so listing gains cannot be expected.
- No financial data or valuation details are provided in the source, making a quick judgment difficult.
- Given the missing details, apply only if you can tolerate SME risk and are prepared to wait for official disclosures before committing.
IC Electricals IPO Background: Business Model And Promoters
The source only confirms that IC Electricals Company Limited is currently open for IPO subscription; no detailed information on the business model or promoter background is provided in the data. Investors should await the RHP for a full picture.
IC Electricals IPO Details At A Glance
| Open Date | 03-Jul-2026 |
|---|---|
| Close Date | 07-Jul-2026 |
| Listing Date | To be announced |
| Exchange | NSE / BSE |
| Issue Type | SME |
| Price Band | To be announced |
| Lot Size | To be announced |
| Issue Size | To be announced |
| Min Investment | To be announced |
| Face Value | To be announced |
| OFS | To be announced |
| Registrar | To be announced |
| Lead Manager | To be announced |
| Business | IC Electricals Company Limited is currently open for IPO subscription. |
GMP Signal And Subscription Status
GMP (gray market premium) data is not available yet for this SME IPO. The data page indicates no GMP. The company states the IPO window is open for subscription, but listing date remains undisclosed. For deeper stock-level insights, please consult Swastika's Sarthi AI stock assistant.
Financial Snapshot And Valuation: What We Know And Don't
No revenue, profit, or margin figures are provided in the source material, so there is nothing to anchor a valuation against. Until RHP disclosures appear, investors should avoid drawing conclusions from imagination rather than data.
Should You Apply To IC Electricals IPO? Pros And Cons
Pros: a small-ticket SME issue could offer an early listing opportunity if the business fundamentals are strong and listing demand is healthy. Cons: price band, lot size, and other key details are not yet announced, and there is no GMP signal. The lack of financials and the SME status increase the risk of mispricing and non-allotment. Investors should align decisions with risk tolerance and capital limits.
How To Apply Via UPI/ASBA: A Quick Guide
To apply via UPI/ASBA, log in to your broker's IPO page, choose IC Electricals IPO, select UPI as the payment mode (or ASBA if offered), enter bid details (lot size and price band when announced), and confirm. Funds will be blocked through ASBA or UPI; in case of allotment, the reserved funds will be adjusted; unallotted funds will be released after the process.
Allotment &Amp Listing Timeline: What To Watch
Open: 03-Jul-2026; Close: 07-Jul-2026; Listing Date: To be announced. Investors should watch for the official Allotment and Listing updates from the issuer and exchange.
Frequently Asked Questions
Is IC Electricals Company Limited IPO worth applying for at the current price band?
The price band has not been announced yet, so a formal assessment cannot be made. Wait for official details to judge value.
What does GMP signal indicate for IC Electricals IPO?
GMP data is not available yet, so listing gain expectations cannot be relied upon at this time.
What are the allotment odds for this SME IPO?
No allotment odds are disclosed in the current data; expect details in the RHP and exchange notices.
When will the listing date be announced?
Listing date is listed as To be announced; updates will be issued by the issuer and stock exchanges.
How do I apply to IC Electricals IPO using UPI/ASBA?
Use your broker's IPO page, select UPI as payment method (or ASBA if offered), enter bid quantity, confirm, and authorize payment. Funds are blocked and released if unallotted.
Conclusion
IC Electricals Company Limited's SME IPO is a high-risk, low-visibility bet right now. With no price band or GMP and no financials disclosed, retail investors should treat it as a watchlist until more details emerge and the RHP is available to evaluate fundamentals.
Watchlist – because key IPO details like price band and GMP are still undisclosed, and you need confirmation before committing.
Latest Articles
IC Electricals Company Limited IPO: Apply, Avoid, or Wait for Listing?


Key Takeaways
- IC Electricals Company Limited's SME IPO opens on 3 July 2026 but price band, lot size, and issue size are not yet announced.
- GMP data is not available yet, so listing gains cannot be expected.
- No financial data or valuation details are provided in the source, making a quick judgment difficult.
- Given the missing details, apply only if you can tolerate SME risk and are prepared to wait for official disclosures before committing.
IC Electricals IPO Background: Business Model And Promoters
The source only confirms that IC Electricals Company Limited is currently open for IPO subscription; no detailed information on the business model or promoter background is provided in the data. Investors should await the RHP for a full picture.
IC Electricals IPO Details At A Glance
| Open Date | 03-Jul-2026 |
|---|---|
| Close Date | 07-Jul-2026 |
| Listing Date | To be announced |
| Exchange | NSE / BSE |
| Issue Type | SME |
| Price Band | To be announced |
| Lot Size | To be announced |
| Issue Size | To be announced |
| Min Investment | To be announced |
| Face Value | To be announced |
| OFS | To be announced |
| Registrar | To be announced |
| Lead Manager | To be announced |
| Business | IC Electricals Company Limited is currently open for IPO subscription. |
GMP Signal And Subscription Status
GMP (gray market premium) data is not available yet for this SME IPO. The data page indicates no GMP. The company states the IPO window is open for subscription, but listing date remains undisclosed. For deeper stock-level insights, please consult Swastika's Sarthi AI stock assistant.
Financial Snapshot And Valuation: What We Know And Don't
No revenue, profit, or margin figures are provided in the source material, so there is nothing to anchor a valuation against. Until RHP disclosures appear, investors should avoid drawing conclusions from imagination rather than data.
Should You Apply To IC Electricals IPO? Pros And Cons
Pros: a small-ticket SME issue could offer an early listing opportunity if the business fundamentals are strong and listing demand is healthy. Cons: price band, lot size, and other key details are not yet announced, and there is no GMP signal. The lack of financials and the SME status increase the risk of mispricing and non-allotment. Investors should align decisions with risk tolerance and capital limits.
How To Apply Via UPI/ASBA: A Quick Guide
To apply via UPI/ASBA, log in to your broker's IPO page, choose IC Electricals IPO, select UPI as the payment mode (or ASBA if offered), enter bid details (lot size and price band when announced), and confirm. Funds will be blocked through ASBA or UPI; in case of allotment, the reserved funds will be adjusted; unallotted funds will be released after the process.
Allotment &Amp Listing Timeline: What To Watch
Open: 03-Jul-2026; Close: 07-Jul-2026; Listing Date: To be announced. Investors should watch for the official Allotment and Listing updates from the issuer and exchange.
Frequently Asked Questions
Is IC Electricals Company Limited IPO worth applying for at the current price band?
The price band has not been announced yet, so a formal assessment cannot be made. Wait for official details to judge value.
What does GMP signal indicate for IC Electricals IPO?
GMP data is not available yet, so listing gain expectations cannot be relied upon at this time.
What are the allotment odds for this SME IPO?
No allotment odds are disclosed in the current data; expect details in the RHP and exchange notices.
When will the listing date be announced?
Listing date is listed as To be announced; updates will be issued by the issuer and stock exchanges.
How do I apply to IC Electricals IPO using UPI/ASBA?
Use your broker's IPO page, select UPI as payment method (or ASBA if offered), enter bid quantity, confirm, and authorize payment. Funds are blocked and released if unallotted.
Conclusion
IC Electricals Company Limited's SME IPO is a high-risk, low-visibility bet right now. With no price band or GMP and no financials disclosed, retail investors should treat it as a watchlist until more details emerge and the RHP is available to evaluate fundamentals.
Watchlist – because key IPO details like price band and GMP are still undisclosed, and you need confirmation before committing.

Asian Paints Share Price Signals A Sector Turnaround For Retail Investors
Key Takeaways
- Paint stocks have tumbled up to 48% from their peaks, driven by margin pressure and raw-material costs.
- Asian Paints share price remains the sector bellwether, down about 10% from its 52-week high of Rs 2,985 (current around Rs 2,715).
- ICICI Securities expects FY27 Q1 revenue growth above 15%, with margins under pressure but improving in Q2.
- Price cuts are likely only after a commodity downcycle, with 3-4 months lag and selective marketing spend to protect margins.
Asian Paints Share Price And Sector Margin Dynamics In FY27
The paint sector faced a tough year as margins contracted under the weight of higher raw-material costs, currency headwinds and supply disruptions from geopolitical tensions. Asian Paints, the sector’s largest listed company by market value, has seen its price correct about 10% from its 52‑week high of Rs 2,985, touched in December 2025; the current price sits near Rs 2,715. The market value for Asian Paints is around Rs 2.60 lakh crore, highlighting its dominance even as the broader sector retrenches.
Shalimar Paints, by contrast, has plummeted nearly 48% from its peak, and its market capitalisation is around Rs 440 crore. Berger Paints, the second-largest listed player by market value, is down about 15% from its annual high. Indigo Paints, Kansai Nerolac, and JSW Dulux have corrected roughly 20% from their respective peaks.
The sector has been navigating a complex mix of headwinds. Paint manufacturers raised prices by 14–16% between March and June 2026 after a sharp surge in crude-linked raw material costs, depreciation in the Indian rupee, and supply disruptions triggered by the Middle East conflict. Since the de-escalation of geopolitical tensions, crude oil prices have corrected sharply–from nearly $120 per barrel in May to below $75 per barrel in June. At the same time, the rupee has strengthened.
How will prices move going forward? ICICI Securities notes that history suggests paint companies pass on a portion of lower input costs to consumers–but not immediately. Three trends persist from previous commodity downcycles: price cuts tend to occur 3–4 months after commodity prices decline, companies pass on less than half of the earlier hikes, and instead channel savings into dealer incentives, influencer marketing, and trade schemes to defend market share. The brokerage expects a similar pattern in FY27, with meaningful price cuts likely after the Diwali season and extra emphasis on trade spend in the July–September quarter.
Margins may improve before price cuts kick in, with sector revenue growth anticipated to be healthy. ICICI Securities expects Q1FY27 revenue growth to exceed 15%, though margins could stay under pressure because raw-material costs stayed elevated for much of the quarter and price hikes were implemented gradually. In Q2FY27, revenue growth could outpace margin expansion as the benefits of higher prices and lower input costs start to flow through; in the second half of FY27, gradual price reductions could weigh on realizations and margins. Dealers are expected to reduce inventory ahead of any potential price reductions.
Brokerage house consensus remains bullish: Asian Paints with a target price of Rs 3,050; Berger Paints with a target price of Rs 550; Kansai Nerolac with a target price of Rs 230; JSW Dulux with a target price of Rs 3,350; Indigo Paints with a Buy rating and a target of Rs 1,200.
For deeper stock-level insights, explore Swastika's Sarthi AI stock assistant: Swastika's Sarthi AI stock assistant.
Raw Material Costs And Currency Movements: How They Shape The Paint Realisations
The March–June 2026 period saw price hikes in the range of 14–16% as input costs rose sharply on crude-linked materials, rupee depreciation, and Middle East disruptions, forcing producers to tweak production schedules and trim trade discounts. The consequence was a temporary improvement in product realisations across the sector, even as margins remained under pressure due to the time-lag before input-cost relief fully translated into lower prices for end-consumers.
With crude slipping from around $120/bbl to sub-$75/bbl and the rupee strengthening, the industry is watching to see how quickly input costs recede and how aggressively companies pass on any savings. In practice, history shows that price cuts arrive after a lag and that the market will favor selective price adjustments supported by promotional activity and dealer incentives to defend market share.
Price Cuts On The Horizon: Timing And The Industry Playbook
Analysts expect paint companies to delay meaningful price reductions until after the Diwali season, mirroring patterns observed in past commodity downcycles. The emphasis is likely to shift toward trade promotions, dealer incentives, and marketing spend rather than aggressive price cuts in the near term. In the meantime, companies may use the savings to bolster distribution strength and expand their share of shelf space, even as realisations are gradually helped by lower raw-material costs.
Stock-Specific Trajectories: Berger Paints Stock Price, Shalimar Paints Stock Price, Asian Paints Stock Price, Kansai Nerolac Stock, Indigo Paints Stock
Among the big names, Shalimar paints stock price has seen a sharper correction–about 48% from its peak–reflecting the challenges faced by smaller players. Berger paints stock price has declined around 15% from its annual high, while Indigo paints stock has corrected roughly 20% from their peaks. Kansai Nerolac stock has also corrected around 20%, and Asian paints stock price has eased about 10% from its 52-week high of Rs 2,985 (December 2025), now trading near Rs 2,715. The overall sector remains sensitive to raw-material costs, currency swings, and supply-chain dynamics, which directly impact pricing, margins, and market share.
Frequently Asked Questions
What caused the paint sector to tumble in 2026?
Rising crude-linked raw material costs, depreciation in the Indian rupee, and supply disruptions from geopolitical tensions pressured margins, while price hikes in 14–16% during March–June 2026 supported realizations.
How has Asian Paints share price moved relative to its 52-week high?
Asian Paints is down about 10% from its 52-week high of Rs 2,985, reached in December 2025; the current price is around Rs 2,715.
When are paint companies likely to implement price cuts?
Historically, price cuts occur about 3–4 months after commodity prices decline, and companies tend to pass on less than half of earlier hikes, while using savings for promotions and dealer incentives.
What is the expected revenue growth for Q1FY27 in the paint sector?
ICICI Securities expects sector revenue growth of over 15% in Q1FY27, with margins likely under pressure but set to improve in Q2FY27.
Which stocks had notable price declines, and by how much?
Shalimar paints stock price fell about 48% from its peak; Berger paints stock price declined around 15%; Indigo paints stock and Kansai Nerolac stock have fallen about 20% from their peaks; Asian paints stock price fell about 10% from its 52-week high.
What are the broker target prices for major paint stocks?
Targets include Asian Paints at Rs 3,050, Berger at Rs 550, Kansai Nerolac at Rs 230, JSW Dulux at Rs 3,350, and Indigo Paints at Rs 1,200.
Conclusion
What this means for the retail investor is to focus on timing and price trajectory rather than just absolute stock moves. The paint sector is likely to see a gradual margin upturn and a more favorable realisation cycle as input costs ease, but price cuts will come with a lag and will be focused on sustaining market share. Your next step could be to monitor the asian paints share price alongside macro signals, and consider a staged entry strategy aligned to the expected Diwali-season price adjustments.

SBI Funds Management IPO: Valuation, Open Date, And Listing Timeline
Key Takeaways
- The SBI Funds Management IPO targets ₹1.17 lakh crore valuation with an OFS of 20.37 crore shares.
- Open is expected during the week of July 13, with listing around July 22, and pre-IPO placement is possible.
- State Bank of India holds 61.76% and Amundi 36.26%, with SBI planning to sell 6.3% and Amundi 3.7%.
- QAAUM stands at ₹12,49,970 crore as of 31 December 2025 (15.4% of the domestic MF market), with 16.05 million investors.
India's mutual fund landscape stands at a pivotal moment as the proposed sbi funds management ipo eyes the public markets with a lofty ₹1.17 lakh crore valuation. The upcoming sbi funds management listing, with an OFS of 20.37 crore equity shares (10% stake), marks a potential turning point for 16.05 million retail investors and the broader asset management industry. As the market digests the numbers, investors ask: what does this mean for valuations, pricing, and long-term performance? This piece breaks down the key facts disclosed in the draft red herring prospectus and what it could signal for the Indian mutual fund space.
As of 31 December 2025, the company's QAAUM stood at ₹12,49,970 crore, representing about 15.4% of the domestic mutual fund industry. Including portfolio management services and advisory mandates, total QAAUM rose to ₹29,04,026 crore. In the passive investment space–encompassing exchange-traded funds and index funds–QAAUM was ₹3,99,953 crore, accounting for 29.6% of the market by December 2025. SBI Funds Management serves 16.05 million unique investors across retail and institutional segments.
The OFS portion comprises 20.37 crore equity shares, representing 10% of the company. Existing shareholders will reduce their holdings through the sale, while SBI Funds Management itself will not receive any proceeds. The draft red herring prospectus shows State Bank of India holding 61.76% and Amundi Group 36.26%. Under the proposed issue, SBI plans to sell 6.3% of its stake, while Amundi will divest 3.7%.
The IPO is being managed by Kotak Mahindra Capital, Axis Capital, Jefferies, ICICI Securities, HSBC Securities, Motilal Oswal, JM Financial, SBI Capital Markets and BofA Securities. The issue is expected to be one of the most closely tracked IPOs in July, given its scale and the prominence of the asset management sector in India. The price per share (the sbi funds management ipo price) has not been disclosed yet, as the final price will be determined through the book-building process.
SBI Funds Management IPO Valuation, Open Date, And Listing Timeline
Per the draft red herring prospectus, the targeted valuation is ₹1.17 lakh crore (roughly $12.3 billion). The public issue is expected to open in the week of 13 July, with listing likely around 22 July. There is also a possibility of a pre-IPO placement, depending on demand and market conditions.
Investors should note that the OFS will be conducted by existing shareholders and SBI Funds Management will not receive proceeds from the sale. The OFS of 20.37 crore equity shares equates to about 10% of the company. The remaining ownership continues to rest with SBI (61.76%) and Amundi (36.26%).
From the governance side, the listing is being conducted with the support of a robust group of investment banks (Kotak Mahindra Capital, Axis Capital, Jefferies, ICICI Securities, HSBC Securities, Motilal Oswal, JM Financial, SBI Capital Markets, and BofA Securities). This lineup underscores the scale of the offering and the confidence of the market in SBI Funds Management's leadership position.
As a practical takeaway, consider how the IPO's scale and the company’s business model could influence your choices as a retail investor. The growth of passive investing and the potential cross-sell opportunities within SBI Mutual Fund could shape product development and fee structures across the sector. For sharper stock-level insights that help align with your goals, you can consult Swastika's Sarthi AI stock assistant.
Key Shareholding Structure: SBI And Amundi Stakes In SBI Funds Management
Ownership in SBI Funds Management is led by State Bank of India (61.76%) and Amundi (36.26%). In the public issue, SBI plans to sell a 6.3% stake, while Amundi will divest 3.7%. Taken together, the OFS represents 10% of the company, with the selling shareholders stepping back from a portion of their holdings and the company not receiving sale proceeds. These percentages are drawn from the draft red herring prospectus and are subject to change, depending on final demand in the book-building process.
Market Position: QAAUM, Passive Investments, And Growth In The Indian Mutual Fund Sector
The SBI Funds Management platform had QAAUM of ₹12,49,970 crore as of 31 December 2025, representing a 15.4% share of the domestic mutual fund industry. When you include portfolio management services and advisory mandates, the total QAAUM comes to ₹29,04,026 crore. The passive investment segment, which includes ETFs and index funds, contributed ₹3,99,953 crore, comprising 29.6% of the market by December 2025. This scale places SBI Funds Management in a leadership role within the Indian mutual fund ecosystem and highlights the growing dominance of passive products in the asset management mix. As of 31 December 2025, the company served 16.05 million unique investors across retail and institutional segments.
MetricValueValuation Target₹1.17 lakh crore (~$12.3 bn)Open Date WindowWeek of July 13Listing DateAround July 22OFS20.37 crore equity shares (10% stake)Shareholding (SBI)61.76%Shareholding (Amundi)36.26%QAAUM (Dec 31, 2025)₹12,49,970 crore (15.4% of domestic MF)Total QAAUM (incl. PMS/Advisory)₹29,04,026 crorePassive QAAUM₹3,99,953 crore (29.6%)Unique Investors16.05 million
In context, this position translates into potential pricing power and the ability to influence product development across the mutual fund landscape in India. Yet, investors should also keep in mind that valuations and market conditions can shift before and after the IPO, and the final price will reflect demand from a wide range of buyers and sellers.
The SBI Funds Management IPO, backed by a robust governance framework and a proven track record as the investment manager for SBI Mutual Fund, sits at the confluence of scale, market leadership, and the evolving dynamics of passive investing. For readers who want to make sense of the implications for their own portfolios, consider how such scale affects your diversification strategy and risk tolerance. For deeper stock-level insights, consult Swastika's Sarthi AI stock assistant.
What Retail Investors Should Watch About The SBI Funds Management IPO Price And Listing
Beyond the headline valuation, investors will monitor the sbi funds management ipo price and how the price band is set during book-building. The final price per share has not yet been disclosed; investors should watch the price discovery process closely on listing day. The OFS portion signals a transfer of ownership by existing shareholders rather than new funds flowing into the company, which can influence post-listing price dynamics. Consider the growth potential of SBI Funds Management against the price you are willing to pay, and align your subscription with your risk tolerance and financial plan.
As you evaluate the opportunity, maintain a disciplined approach and consider how such scale could affect your diversification strategy. The Indian asset management market has undergone rapid growth and continues to evolve with the rise of passive investing and new product structures. If you want sharper, stock-level insights, Swastika's Sarthi AI stock assistant can help you map this listing to your broader investment goals.
Investment Rationale: Why The SBI Funds Management IPO Could Reshape The Indian Asset Management Landscape
The market-leading status of SBI Funds Management within SBI Mutual Fund, combined with its sizable QAAUM and the share of passive assets, suggests the listing could influence the trajectory of the Indian asset management sector. A successful IPO would reinforce the central role of domestic asset managers in a market where passive products are expanding, potentially accelerating product development, distribution reach, and investor education across the sector. But risks exist: market conditions, regulatory changes, and the competitive dynamics of a crowded market can shape returns post-listing.
Frequently Asked Questions
What is the expected valuation of the SBI Funds Management IPO?
₹1.17 lakh crore (~$12.3 billion).
When is the SBI Funds Management IPO expected to open and list?
The public issue is expected to open in the week of July 13 and listing around July 22.
What is the OFS in the SBI Funds Management IPO?
OFS comprises 20.37 crore equity shares (10% stake); existing shareholders will reduce holdings; SBI Funds Management will not receive proceeds.
Who holds the major stakes in SBI Funds Management and what are the percentages?
State Bank of India holds 61.76% and Amundi holds 36.26%.
What is the QAAUM and investor base for SBI Funds Management as of December 31, 2025?
QAAUM stands at ₹12,49,970 crore (15.4% of domestic MF); total QAAUM including PMS/Advisory is ₹29,04,026 crore; Passive QAAUM is ₹3,99,953 crore (29.6%); 16.05 million unique investors.
Conclusion
Viewed through the lens of scale and sector dynamics, the SBI Funds Management IPO represents a potential turning point for Indian mutual funds. The valuation target of ₹1.17 lakh crore, the 10% OFS, and the ownership mix with SBI and Amundi create a framework where the listing could redefine how Indian households access mutual funds and how asset managers compete for flows in a rapidly evolving market. Retail investors should acknowledge the opportunity while weighing valuation against growth prospects, regulatory risk, and the ability of this platform to cross-sell across SBI Mutual Fund and related products.
Epfo Transfer Essentials: A Retail Investor's Guide To Consolidating PF Across Employers
Key Takeaways
- Timely epfo transfer consolidates your PF across multiple employers through UAN.
- PF balances not transferred can become inoperative after 36 consecutive months, reducing compounding.
- Service length matters for taxes and pension: more than 5 years means no TDS on withdrawal; 10+ years unlocks pension benefits.
- EPFO currently offers 8.25% annual returns on PF contributions; keeping accounts updated maximizes compounding.
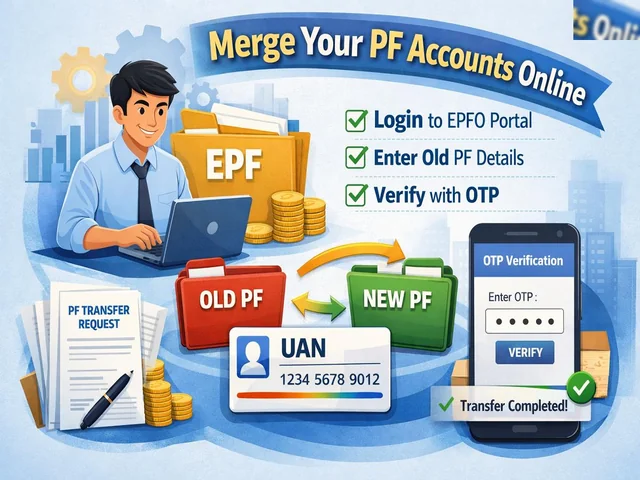
After switching jobs, your PF can either rest in silos across employers or grow as a single, compounding corpus. The difference is epfo transfer, a process that consolidates all PF balances under one UAN and keeps your retirement corpus growing. This guide explains why consolidation matters for retail investors and how to navigate the steps using the online transfer process, UAN features, and simple checks to avoid common mistakes.
EPFO stands for Employees' Provident Fund Organisation; Provident Fund is a long-term savings scheme designed to provide financial security after retirement. Provident Fund is managed by EPFO and helps salaried employees build a corpus through monthly contributions from salary, which are matched by the employer. The accumulated amount earns interest over time, encouraging disciplined saving habits. A strong PF discipline, reinforced by a timely epfo transfer, can keep your retirement plan on track even as you switch jobs.
Transferring PF after switching jobs is not just about moving money. It is about ensuring seamless service history, continuous compounding, and eligibility for pension and insurance benefits. The UAN (Universal Account Number) becomes essential here, acting as a single umbrella for all PF accounts linked to different employers. With UAN, you can connect multiple PF MIDs to one member, making it easier to manage your corpus across career moves. The benefits extend beyond keeping records tidy: UAN provides an updated PF passbook, an UAN card, and SMS alerts for contributions. It also enables linking past accounts and automates transfer requests when you change jobs. This ensures better tracking and management of the PF corpus when you start a new job.
What Happens If You Don’t Transfer? Not transferring provident funds can lead to many complications for employees. If you have multiple PF Member IDs (MIDs) and balances are not consolidated into the latest MID, you could miss out on long-term benefits. For one, if the total service across all roles is more than 5 years, TDS is not charged on PF withdrawal. Without transferring PF with the current employer, you may be liable for additional taxes and may lose the compounding benefits in older accounts after the 3-year period. Clubbing all PF accounts helps you qualify for pensionary and insurance benefits of the EPFO. For example, a service of more than 10 years makes the member eligible for pensionary benefits. That is why transferring PF with the latest employer is necessary to ensure past services do not get lapsed. Overall, keeping your account updated will ensure seamless access to all EPFO benefits and help you avoid unnecessary paperwork when claiming funds after retirement.
To make epfo transfer and PF consolidation easier, remember the following key facts: EPFO currently offers 8.25% annual returns on PF contributions; a separate member ID setup can reduce compounding; an EPFO account becomes inoperative when no contributions are credited for 36 consecutive months; and consolidating PF balances helps you maximize the final corpus value upon retirement. If you want a practical way to approach investing decisions as you consolidate, consider Swastika's Sarthi AI stock assistant for stock research while you plan your long-term financials.
Meanwhile, you can verify your current PF activity via epfo balance check and epfo uan login to view the updated passbook and contributions. For those seeking a direct path to PF consolidation, the epfo online transfer process offers a structured workflow: verify your UAN status, link all past accounts, submit the transfer request, and monitor the status until completion. Steps are designed to be intuitive, with automatic prompts at the step where you must approve from HR or your current employer. If you prefer a hands-on walkthrough, these steps can be completed from the EPFO portal using any browser or a mobile device with a stable internet connection. Remember to keep your KYC and contact details updated in the UAN profile to avoid any mismatch during the transfer process.
Table: Key PF Transfer Facts
| Key PF Fact | What It Means |
|---|---|
| 8.25% | Annual returns offered by EPFO on PF contributions |
| 36 months | Period after which an EPFO account becomes inoperative if no contributions are credited |
| 5+ years | No TDS on PF withdrawal for service longer than five years |
| 10+ years | Eligibility for pensionary benefits |
Note: In the broader financial ecosystem, large settlements illustrate the scale of transactions and the importance of clear records. For instance, Rs 5,700 crore was settled in a dispute where a bank’s Abu Dhabi arm paid $600 million to resolve insolvency claims without admission of liability. This context underscores why keeping PF data consistent matters for individuals as well.
Additionally, you can perform epfo balance check and epfo uan login to review the updated passbook and contributions. The epfo online transfer process is designed to be user-friendly: confirm your UAN status, link past PF accounts, submit the transfer request when you change jobs, and monitor the transfer status until completion. If HR or your employer requires approval, you will receive prompts to finalize the transfer. Keeping your contact details current in the UAN profile helps avoid delays and ensures a smooth PF consolidation experience.
Frequently Asked Questions
What Is Epfo Transfer And Why Is It Important For PF Accounts?
EPFO transfer means moving PF balances from old employers to your current EPF account under one UAN to ensure continuous accrual and eligibility for benefits.
How Does UAN Help With PF Consolidation And Epfo Transfer?
UAN acts as a single umbrella for all PF accounts linked to different employers, connects multiple MIDs to one member, and enables automatic transfer requests when you change jobs.
What Happens If You Don’t Transfer PF After Switching Jobs?
Not transferring PF can lead to multiple PF accounts, potential inoperative status after 36 months of no contributions, and reduced compounding benefits and pension eligibility over time.
What Is The Tax Impact On PF Withdrawal Based On Service Years?
If service exceeds 5 years, TDS is not charged on PF withdrawal; long service can also influence pension eligibility after 10 years.
What Is The Epfo Online Transfer Process?
Epfo Online Transfer Process involves verifying your UAN, linking past PF accounts, submitting the transfer request when you switch jobs, and monitoring the transfer status using epfo balance check and epfo uan login.
Conclusion
For the retail investor, epfo transfer is not just an administrative task; it is a strategic move that safeguards retirement savings as you switch jobs. Consolidating PF under one UAN reduces fragmentation, enhances compounding, and keeps you eligible for pension and insurance benefits tied to long service. It is a practical, evidence-based approach to maintain a clean PF history and minimize tax friction at withdrawal.
Next steps: log into the EPFO portal to confirm UAN status, link past PF accounts, and initiate the epfo online transfer process whenever you change jobs. Use epfo balance check or epfo uan login to monitor your updated passbook and contributions, and consider Swastika's Sarthi AI stock assistant to align your broader financial plan with your stock investments.

BPCL Share Price Momentum As Crude Oil Falls To Four-Month Low
Key Takeaways
- BPCL share price rose 2.4% as crude oil slid to a four-month low.
- Oil marketing and tyre stocks climbed on lower crude prices.
- Sensex and Nifty advanced while India VIX cooled.
- Stock movers included CEAT, JK Tyre, Apollo Tyres, IOC, InterGlobe Aviation, and Asian Paints.
Crude oil slid to a four-month low, and bpcl share price responded with a modest gain as investors priced in improved marketing margins for oil marketing companies. The session also reflected a broader risk-on move as the Sensex and Nifty rose, while volatility cooled. With Brent crude at $70.80 a barrel and WTI near $67.74, the energy complex shifted away from supply fears toward demand optimism, nudging bpcl share price higher in the session. Retail traders should watch how the macro backdrop translates into stock-specific signals for oil-linked names.
BPCL Share Price Movements Amid Crude Oil Decline
By around 10:00 am, bpcl share price advanced 2.4% on the day. The fall in crude oil helped improve working capital dynamics for oil marketing companies and potentially widened marketing margins in the near term. Brent crude price fell 77 cents, or 1.1%, to $70.80 a barrel, while WTI declined $0.84, or 1.2%, to $67.74. Both benchmarks had already dropped in the previous session, underscoring a risk-on tone as positive progress in indirect discussions between the U.S. and Iran about the Strait of Hormuz reduced supply disruption fears. The crude-linked sector moved higher on the strength of this backdrop.
In this environment, oil marketing companies like BPCL typically benefit from lower oil prices on two counts: lower working capital needs and the prospect of improved marketing margins. The broader market context that day reinforced the risk-on mood, setting a backdrop for sector rotation into cyclical bets and value plays that could sustain the momentum beyond a single session.
Ceat Share Price And Other Tyre Stocks In A Crude-Oil Rally
The tyre segment saw notable gains as raw materials tied to petroleum derivatives softened. ceat share price climbed 4.4% by around 10:00 am, while jk tyre stock price rose more than 3%. Apollo tyres stock price gained over 2% during the session, as investors priced in relief from higher crude costs and potential for margin improvement in the tyre supply chain.
The broader tyre universe benefited from the general uptick in risk appetite, highlighting how commodity-linked costs feed into downstream margins. As the market digested the signals from crude markets, investors assessed which tyre manufacturers were best positioned to translate input-cost relief into earnings quality.
Stock Price Of Interglobe Aviation And Asian Paints In The Oil-Linked Rally
The move extended beyond energy and tyres to other consumer and services stocks. stock price of interglobe aviation rose 0.65% in early trade, while asian paints stock price gained on the day as the paint sector found traction in the risk-on environment. Berger Paints stock price also recorded gains, and kansai nerolac stock price logged higher levels as traders priced in a slight improvement in discretionary durability demand alongside margins in commodity-linked sectors.
On the energy side, Oil India stock price declined 0.9%, and ongc stock price slipped 0.2%, underscoring that not all oil-linked names benefited from the crude slide. These mixed moves remind investors to consider company-specific dynamics beyond the macro backdrop when building a portfolio in crude-linked themes.
Market Backdrop: Sensex, Nifty, And VIX On July 2, 2026
The broader market followed crude-linked optimism with the Sensex up 407 points, or 0.5%, to 77,330. The Nifty 50 climbed 123 points to 24,129, while the India VIX fell 3.6%. The Nifty Midcap 100 rose 0.4% and the Nifty Smallcap 100 rose 0.5%, signaling a broad-based risk-on tilt that supported cyclicals and sensitive sectors including oil marketing and tyre manufacturers.
These breadth measures suggest that the market was discounting a constructive macro scenario in the near term, with liquidity conditions and global oil supply expectations playing a central role. For retail investors, this is a reminder to tether stock ideas to credible drivers such as cost structure, margins, and price sensitivity relative to crude dynamics.
Practical Takeaways For Retail Investors: Navigating Crude-Oil Moves In Indian Markets
For investors with exposure to bpcl share price and other crude-linked stocks, a few takeaways emerge from this session. First, lower crude prices can relieve working capital pressures for oil marketing companies and widen marketing margins, but the exact impact depends on refining stock levels, marketing costs, and government policy considerations. Second, tyre stocks can benefit from lower feedstock costs, but inputs like carbon black and synthetic rubber remain linked to petroleum derivatives, so diversifying within the sector can help manage risk. Third, while some high-beta names like InterGlobe Aviation and Asian Paints highlighted gains, others such as Oil India and ONGC showed selective pressure; this paints a picture of granular stock-specific responses even within a crude-linked theme. Investors should consider combining macro signals with company-level fundamentals and a disciplined risk framework.
For deeper, stock-level analysis and tailored investment ideas, Swastika's Sarthi AI stock assistant can help you navigate these complex moves. Swastika's Sarthi AI stock assistant
Frequently Asked Questions
What caused the BPCL share price move on July 2, 2026?
BPCL share price moved higher as crude oil price fell to a four-month low, improving marketing margins and working capital dynamics for oil marketing companies.
Which other stocks moved on the day with BPCL?
CEAT share price rose 4.4%, JK Tyre stock price rose over 3%, Apollo tyres stock price gained over 2%, IOC added nearly 2%, InterGlobe Aviation stock price traded 0.65% higher, and asian paints stock price gained, among others.
How does lower crude oil price affect oil marketing margins?
Lower crude prices generally reduce working capital requirements and can improve marketing margins for oil marketing companies, supporting stocks like BPCL in the near term.
What was the broader market backdrop on that day?
Sensex rose by 407 points to 77,330; Nifty 50 gained 123 points to 24,129; India VIX fell 3.6%; Nifty Midcap 100 up 0.4%; Nifty Smallcap 100 up 0.5%.
Where can I get deeper stock insights for BPCL and other crude-linked stocks?
You can use Swastika's Sarthi AI stock assistant for institutional-level research on any stock or index.
Conclusion
Crude oil dynamics continue to influence a broad swath of Indian equities, and this session shows bpcl share price can move in tandem with a favorable price environment for oil-linked sectors. Retail investors should focus on margin dynamics, sector breadth, and stock-specific catalysts to translate macro moves into durable returns. Use a disciplined framework to manage risk and consider a balanced allocation across oil marketing, tyre, and consumer-related plays as crude conditions evolve.

Canara Bank Share Price And Q1 FY27 Growth: A Retail Investor's Guide
Key Takeaways
- Canara Bank global business grew 14.40% YoY to ₹29,05,820 crore as of 30 June 2026.
- Global deposits rose 11.69% YoY to ₹16,12,604 crore and global advances rose 17.96% to ₹12,93,216 crore.
- Domestic deposits grew 10.06% YoY to ₹14,73,447 crore; RAM advances rose 21.27% YoY to ₹7,65,061 crore.
- The scrip traded around ₹126.10 on the BSE, marking a marginal move post Q1 FY27 data release.
Canara Bank share price watchers get a fresh signal from the bank's Q1 FY27 numbers. For canara bank share price watchers, the new data shows global business up 14.40% YoY to ₹29,05,820 crore as of 30 June 2026. Global deposits climbed 11.69% YoY to ₹16,12,604 crore, while global advances rose 17.96% to ₹12,93,216 crore. Domestic deposits grew 10.06% YoY to ₹14,73,447 crore; domestic advances increased 16.93% to ₹12,06,875 crore; RAM advances rose 21.27% YoY to ₹7,65,061 crore.
What does this mean for canara bank stock price? The expansion is broad based: canara bank global business is accompanied by a robust domestic book, with RAM advances supporting higher credit off-take in retail and SME segments. By geography, the bank has four overseas branches, located in London, New York, Dubai and IBU Gift City Gujarat, deepening cross-border funding and remittances. The bank reports a diversified and resilient funding mix that should support steady NIMs and loan growth in the coming quarters.
Numerical highlights show global deposits up 11.69% YoY to ₹16,12,604 crore and global advances up 17.96% YoY to ₹12,93,216 crore, while domestic deposits grew 10.06% YoY to ₹14,73,447 crore and domestic advances rose 16.93% to ₹12,06,875 crore. RAM advances rose 21.27% YoY to ₹7,65,061 crore, underscoring a strong retail mortgage and card loans pipeline. Canara Bank maintained a wide footprint with 10,097 branches as of 31.03.2026 and 11,306 ATM & Recycler across rural, semi-urban, urban and metro locations. The Q4 FY26 standalone net profit declined 9.93% to ₹5,002.66 crore on a 1.84% decrease in total income to ₹36,662.21 crore, reflecting a softer quarter for the standalone performance.
Share price context remains nuanced; the scrip shed 0.04% to ₹126.10 on the BSE in the cited period. The ongoing trajectory is supported by a 14.40% YoY expansion in canara bank global business, with a 21.27% YoY rise in RAM advances and double-digit growth in both domestic and international deposits. For retail investors, the question is not only the headline numbers but the quality of loan growth, asset quality, and capital ratios that drive canara bank stock price over time. If you want deeper stock-level research, consider Swastika's Sarthi AI stock assistant to tailor the analysis to your holdings.
Canara Bank Share Price Drivers From Q1 FY27 Highlights
The quarter brings clarity on what moves the canara bank share price. The 14.40% YoY rise in canara bank global business is a key anchor, reflecting strength in both domestic and international lending and fee income. Investors should watch not only the absolute size of the book but the mix: retail, SME and corporate lending can affect spreads and risk-weighted assets. The healthy deposit growth supports stable funding costs, which in turn can help sustain margin protection even as credit demand normalizes.
RAM advances, which grew by 21.27% YoY to ₹7,65,061 crore, suggest an improved retail credit pipeline and potential cross-sell opportunities through digital channels. The overseas footprint–4 overseas branches in London, New York, Dubai and IBU Gift City Gujarat–adds a cross-border dimension to both funding and remittances. The net takeaway for canara bank share price is that a diversified growth trajectory across geographies and segments tends to translate into a steadier long-run valuation, even if short-term price moves can be volatile.
Canara Bank Global Business Growth And Investor Implications
Global business, the aggregate metric for both domestic and overseas operations, rose 14.40% YoY to ₹29,05,820 crore. This broad growth supports stronger balance-sheet resilience and a larger fee pool, which can help the bank sustain higher returns in a rising rate environment. For investors, the key question becomes how the bank can translate this top-line momentum into durable earnings growth and return on equity. For canara bank stock price enthusiasts, the path forward will depend on management actions around cost control, asset quality and capital adequacy. The simultaneous strength in deposits and lending bodes well for the stock's price trajectory over the medium term.
Q1 FY27 results also reveal a solid domestic base with domestic deposits at ₹14,73,447 crore and domestic advances at ₹12,06,875 crore, while RAM advances grew 21.27% YoY to ₹7,65,061 crore. A stable funding mix supports margin resilience and could enable more sustainable returns even if external conditions remain volatile. Investors should monitor asset quality, provisioning coverage and capital adequacy so that canara bank stock price can reflect earnings quality rather than only price momentum.
Canara Bank Overseas Branches And Domestic Performance Analysis
Canara Bank's four overseas branches extend its global reach into London, New York, Dubai and IBU Gift City Gujarat, supporting cross-border lending, remittances and correspondent banking relationships. Domestically, the bank maintains 10,097 branches across rural, semi-urban, urban and metro segments and 11,306 ATMs & Recycler. This expansive network underpins the 14.40% YoY growth in global business and the 11.69% YoY rise in global deposits, while supporting 16.93% YoY growth in domestic advances and 21.27% YoY RAM advances.
In canara bank quarterly results for Q4 FY26, standalone net profit declined 9.93% to ₹5,002.66 crore on a 1.84% decrease in total income to ₹36,662.21 crore. This highlights the importance of quality earnings and a stable funding base as the bank navigates macro headwinds. For a retail investor, the key takeaway is to watch for improvements in margins and the cost of funds as the bank continues to expand its balance sheet and maintain asset quality.
Canara Bank Quarterly Results And The Profit Trend
The canara bank quarterly results show a mixed picture: profitability softened in Q4 FY26 while the loan book grew steadily, supported by broad-based domestic and overseas activity. The 9.93% YoY decline in net profit occurs alongside a 1.84% reduction in total income, which is a reminder that quarterly profitability can differ from medium-term trajectory. Investors should monitor quarterly trends in net interest income, non-interest income, and cost-to-income ratio to gauge how the bank can sustain earnings growth amid rising competition and evolving regulatory norms.
Despite the near-term softness, the bank's growth drivers are intact: global business growth, deposit franchise strength and an expanding RAM loan book. These factors can influence canara bank stock price as conditions improve and risk costs stabilize. The price action in the near term will likely reflect both fundamental news and broader market sentiment; patient investors may find it prudent to observe price levels around key support and resistance zones while maintaining a diversified portfolio and a disciplined risk plan. If you want deeper stock-level research, consider Swastika's Sarthi AI stock assistant to tailor the analysis to your holdings.
Frequently Asked Questions
What is Canara Bank's global business value as of 30 June 2026?
Canara Bank global business stood at ₹29,05,820 crore, up 14.40% YoY as of 30 June 2026.
How did Canara Bank's global deposits perform in the same period?
Global deposits rose 11.69% YoY to ₹16,12,604 crore.
What happened to Canara Bank's global advances and RAM advances?
Global advances rose 17.96% YoY to ₹12,93,216 crore, while RAM advances rose 21.27% YoY to ₹7,65,061 crore.
What is Canara Bank's Q4 FY26 standalone net profit and total income?
Standalone net profit declined 9.93% to ₹5,002.66 crore, with total income down 1.84% to ₹36,662.21 crore in Q4 FY26 over Q4 FY25.
How many overseas branches does Canara Bank have and what is its current stock price on BSE?
Canara Bank has 4 overseas branches. The scrip traded around ₹126.10 on the BSE, a marginal move in the period.
Conclusion
Retail investors should translate these numbers into a practical framework: growth drivers, profitability, and capital adequacy together shape the canara bank share price trajectory over the medium term. The bank's Q1 FY27 updates show a balanced mix of global expansion and domestic resilience, which could support steady valuation despite near-term volatility. Consider using a structured framework–evaluate loan growth quality, deposit franchise strength, and cost management–and use tools like Swastika's Sarthi AI stock assistant to tailor research to your portfolio.
Taking the next step, map out scenarios where the canara bank stock price could move on credit cycles, regulatory developments, and macro shifts. If the data suggests continued momentum, a disciplined rebalance or dollar-cost averaging strategy across a defined price band could be prudent for a retail investor seeking to participate in Canara Bank's growth while controlling downside risk.
Big Budget


Popular Articles


.avif)
.avif)

.avif)


START YOUR INVESTMENT JOURNEY
Get personalized advice from our experts
- Dedicated RM Support
- Smooth and Fast Trading App
