


Infosys Share Price Momentum And The Q1 FY27 Earnings Wave



Key Takeaways
- Q1 FY27 earnings season gathers momentum with 256 companies set to announce June-quarter results.
- infosys quarterly results and major names drive early market sentiment as results flow in.
- Goldman Sachs expects the Nifty 50 to rebound to 26,500 by June 2027, signaling macro optimism for Indian equities.
- Swastika's Sarthi AI stock assistant offers deeper insights for retail investors.
The Q1 FY27 earnings season is gathering momentum as 256 companies are set to announce their April-June quarter results this week. For retail investors, that cadence matters: the direction of key names can tilt the broader market mood and inject volatility into swing trades. The infosys share price is particularly watched as a barometer of IT and market sentiment, given Infosys is one of the most prominent IT services names in the calendar. The first wave of results has already begun with Tata Consultancy Services reporting earlier this month, and now the rest of the calendar will reveal how demand and margins are tracking across sectors.
Infosys Share Price Outlook For Q1 FY27 And Market Momentum
Investors monitor the infosys share price as a bellwether for IT services and overall risk appetite. The IT-heavy portion of the market has been a leading indicator in recent sessions, and the current earnings cadence could either reinforce that leadership or expose pockets of weakness. TCS results provided early directional cues, and now traders will look for consistency in quarterly updates that feed into margins and guidance across peers. The market outlook remains cautiously constructive, with fresh updates from the earnings calendar shaping sector leadership and potential sector rotation.
The earnings calendar underscores a broad mix of names across sectors: Infosys, Eternal, Bajaj Auto, UltraTech Cement, Nestlé India, Adani Power, Paytm and TVS Motor are among the key names on the docket. As results flow in, price action in sub-sectors tied to IT, cement, consumer staples, energy, and financials will offer clues about the breadth of the recovery. The bajaj auto stock price and tvs motor stock price will be watched for autos-cycle signals and demand trends, while ultratech cement share price will reflect the health of the construction and infrastructure cycle. The nestlé india stock will provide a test of consumer staples resilience in a fluctuating macro backdrop. Investors should also keep an eye on infosys quarterly results as a potential trigger for IT peers and sentiment across risk assets.
According to Vinod Nair of Geojit Investments, market sentiment continues to be supported by encouraging Q1 FY27 business updates and growing optimism over a healthy earnings season.
Reference :
1 : Economictimes
The calendar also highlights a tight schedule of big names reporting through the week. On Monday, July 20, UltraTech Cement is set to report its Q1 FY27 results, with Paytm and Indian Overseas Bank also announcing their June-quarter earnings, along with Karur Vysya Bank, Shyam Metalics and Sobha. Tuesday, July 21, brings Bajaj Auto, Adani Energy Solutions, TVS Motor Company, Indian Hotels Company, JSW Infrastructure, Adani Gas, Mahindra & Mahindra Financial Services and Anthem Biosciences. On Wednesday, July 22, Eternal will report its June-quarter results, followed by Nestlé India, Adani Power, Adani Green Energy, BPCL, Oracle Financial Services Software, Dr. Reddy's Laboratories and United Spirits. Thursday, July 23, features Infosys, IndiGo, Cipla, Motilal Oswal Financial Services, Mphasis, Sona BLW Precision Forgings, Go Digit General Insurance and Chennai Petroleum Corporation. Finally, Friday, July 24, sees Shriram Finance, CG Power, Bank of Baroda, Jindal Steel & Power, Laurus Labs, Apar Industries, Welspun Corp and Container Corporation of India (CONCOR) announce results. These timings provide a framework for how the infosys share price and other major names may respond in the near term.
To put the calendar into perspective, market watchers also note the evolving macro narrative. Goldman Sachs expects the Nifty 50 to rebound to 26,500 by June 2027, a signal of growing constructive thinking around India’s macro backdrop as earnings settle in and macro indicators improve. Looking ahead, investors will closely track Japan's inflation data and India’s PMI readings for fresh glimpses into economic activity and business confidence–factors that can influence sector leadership and valuations across the market. Vinod Nair’s commentary underscores that broader optimism remains tethered to solid earnings progress and improving macro momentum.
Where does that leave the retail investor? The immediate takeaway is to align risk with the earnings calendar and keep a close watch on IT, cement, and consumer staples themes as results flow in. As price action unfolds around the infosys share price and related names, it’s important to separate macro-driven moves from stock-specific catalysts. For those seeking deeper, institution-grade research on any stock or index, Swastika's Sarthi AI stock assistant can help you interpret earnings signals and price action in real time. Swastika's Sarthi AI stock assistant can be a useful companion as you navigate this earnings-heavy week.
Market Outlook And The Nifty Target: A Global And Local Lens
The market’s direction in this earnings-heavy cycle will reflect both domestic earnings momentum and global macro cues. The first-quarter updates have implications for multiple sectors, including IT services, capital goods, and consumer staples. The consensus around a constructive path for Indian equities is supported by improving macroeconomic signals and a growing sense that earnings quality will be resilient enough to sustain multiple expansion, even as some firms show mixed margins. The Nifty’s path in the months ahead will likely hinge on the balance between corporate guidance, macro data, and external risk sentiment from global markets. Investors should be prepared for volatility around policy commentary, PMI prints, and quarterly results that reshape sector leadership narratives.
For those who want to calibrate price-action with more granular context, the Sarthi AI stock assistant can help parse earnings surprises, price-action patterns, and cross-asset signals to inform entry and exit decisions. The assistant provides institutional-grade research on any stock or index to retail investors, and you can explore it here: Swastika's Sarthi AI stock assistant.
Related Reads
- Infosys Share Price: A Retail Investor's Comprehensive Guide To Market Movements, Dividends, And Strategy
- Infosys Share Price Watch: Q1FY27 Earnings Week Across 260+ Indian Companies
- Infosys Share Price Trends And July 2026 Nifty F&O: A Retail Investor's Guide
Frequently Asked Questions
What is the Q1 FY27 earnings calendar?
256 companies are scheduled to announce their April-June quarter results, covering a wide mix of sectors and including names like Infosys, Eternal, Bajaj Auto, UltraTech Cement, Nestlé India, Adani Power, Paytm and TVS Motor.
Which major names are on the earnings calendar this week?
Key names include Infosys, Eternal, Bajaj Auto, UltraTech Cement, Nestlé India, Adani Power, Paytm and TVS Motor.
What is the market outlook for Q1 FY27?
Market sentiment is supported by encouraging Q1 FY27 business updates and growing optimism over a healthy earnings season, with macro cues remaining favorable.
What does Goldman Sachs say about the Nifty 50?
Goldman Sachs expects the Nifty 50 to rebound to 26,500 by June 2027, signaling constructive sentiment as macro conditions improve.
How can retail investors use Swastika's Sarthi AI stock assistant?
Swastika's Sarthi AI stock assistant provides institutional-grade research on stocks and indices to retail investors, helping interpret earnings signals and price moves. Visit the tool here:Swastika's Sarthi AI stock assistant.
Conclusion
In practice, this means structuring trades around verified price reactions to earnings data, rather than chasing headlines. If you want a more disciplined, data-driven approach, consider using price channels, earnings momentum scores, and cross-sector validation. The week ahead is a test of earnings resilience, macro-inflation dynamics, and investor appetite for growth versus value. With the right framework, you can translate the earnings cadence into a navigable path for your portfolio.
Latest Articles
Infosys Share Price Momentum And The Q1 FY27 Earnings Wave


Key Takeaways
- Q1 FY27 earnings season gathers momentum with 256 companies set to announce June-quarter results.
- infosys quarterly results and major names drive early market sentiment as results flow in.
- Goldman Sachs expects the Nifty 50 to rebound to 26,500 by June 2027, signaling macro optimism for Indian equities.
- Swastika's Sarthi AI stock assistant offers deeper insights for retail investors.
The Q1 FY27 earnings season is gathering momentum as 256 companies are set to announce their April-June quarter results this week. For retail investors, that cadence matters: the direction of key names can tilt the broader market mood and inject volatility into swing trades. The infosys share price is particularly watched as a barometer of IT and market sentiment, given Infosys is one of the most prominent IT services names in the calendar. The first wave of results has already begun with Tata Consultancy Services reporting earlier this month, and now the rest of the calendar will reveal how demand and margins are tracking across sectors.
Infosys Share Price Outlook For Q1 FY27 And Market Momentum
Investors monitor the infosys share price as a bellwether for IT services and overall risk appetite. The IT-heavy portion of the market has been a leading indicator in recent sessions, and the current earnings cadence could either reinforce that leadership or expose pockets of weakness. TCS results provided early directional cues, and now traders will look for consistency in quarterly updates that feed into margins and guidance across peers. The market outlook remains cautiously constructive, with fresh updates from the earnings calendar shaping sector leadership and potential sector rotation.
The earnings calendar underscores a broad mix of names across sectors: Infosys, Eternal, Bajaj Auto, UltraTech Cement, Nestlé India, Adani Power, Paytm and TVS Motor are among the key names on the docket. As results flow in, price action in sub-sectors tied to IT, cement, consumer staples, energy, and financials will offer clues about the breadth of the recovery. The bajaj auto stock price and tvs motor stock price will be watched for autos-cycle signals and demand trends, while ultratech cement share price will reflect the health of the construction and infrastructure cycle. The nestlé india stock will provide a test of consumer staples resilience in a fluctuating macro backdrop. Investors should also keep an eye on infosys quarterly results as a potential trigger for IT peers and sentiment across risk assets.
According to Vinod Nair of Geojit Investments, market sentiment continues to be supported by encouraging Q1 FY27 business updates and growing optimism over a healthy earnings season.
Reference :
1 : Economictimes
The calendar also highlights a tight schedule of big names reporting through the week. On Monday, July 20, UltraTech Cement is set to report its Q1 FY27 results, with Paytm and Indian Overseas Bank also announcing their June-quarter earnings, along with Karur Vysya Bank, Shyam Metalics and Sobha. Tuesday, July 21, brings Bajaj Auto, Adani Energy Solutions, TVS Motor Company, Indian Hotels Company, JSW Infrastructure, Adani Gas, Mahindra & Mahindra Financial Services and Anthem Biosciences. On Wednesday, July 22, Eternal will report its June-quarter results, followed by Nestlé India, Adani Power, Adani Green Energy, BPCL, Oracle Financial Services Software, Dr. Reddy's Laboratories and United Spirits. Thursday, July 23, features Infosys, IndiGo, Cipla, Motilal Oswal Financial Services, Mphasis, Sona BLW Precision Forgings, Go Digit General Insurance and Chennai Petroleum Corporation. Finally, Friday, July 24, sees Shriram Finance, CG Power, Bank of Baroda, Jindal Steel & Power, Laurus Labs, Apar Industries, Welspun Corp and Container Corporation of India (CONCOR) announce results. These timings provide a framework for how the infosys share price and other major names may respond in the near term.
To put the calendar into perspective, market watchers also note the evolving macro narrative. Goldman Sachs expects the Nifty 50 to rebound to 26,500 by June 2027, a signal of growing constructive thinking around India’s macro backdrop as earnings settle in and macro indicators improve. Looking ahead, investors will closely track Japan's inflation data and India’s PMI readings for fresh glimpses into economic activity and business confidence–factors that can influence sector leadership and valuations across the market. Vinod Nair’s commentary underscores that broader optimism remains tethered to solid earnings progress and improving macro momentum.
Where does that leave the retail investor? The immediate takeaway is to align risk with the earnings calendar and keep a close watch on IT, cement, and consumer staples themes as results flow in. As price action unfolds around the infosys share price and related names, it’s important to separate macro-driven moves from stock-specific catalysts. For those seeking deeper, institution-grade research on any stock or index, Swastika's Sarthi AI stock assistant can help you interpret earnings signals and price action in real time. Swastika's Sarthi AI stock assistant can be a useful companion as you navigate this earnings-heavy week.
Market Outlook And The Nifty Target: A Global And Local Lens
The market’s direction in this earnings-heavy cycle will reflect both domestic earnings momentum and global macro cues. The first-quarter updates have implications for multiple sectors, including IT services, capital goods, and consumer staples. The consensus around a constructive path for Indian equities is supported by improving macroeconomic signals and a growing sense that earnings quality will be resilient enough to sustain multiple expansion, even as some firms show mixed margins. The Nifty’s path in the months ahead will likely hinge on the balance between corporate guidance, macro data, and external risk sentiment from global markets. Investors should be prepared for volatility around policy commentary, PMI prints, and quarterly results that reshape sector leadership narratives.
For those who want to calibrate price-action with more granular context, the Sarthi AI stock assistant can help parse earnings surprises, price-action patterns, and cross-asset signals to inform entry and exit decisions. The assistant provides institutional-grade research on any stock or index to retail investors, and you can explore it here: Swastika's Sarthi AI stock assistant.
Related Reads
- Infosys Share Price: A Retail Investor's Comprehensive Guide To Market Movements, Dividends, And Strategy
- Infosys Share Price Watch: Q1FY27 Earnings Week Across 260+ Indian Companies
- Infosys Share Price Trends And July 2026 Nifty F&O: A Retail Investor's Guide
Frequently Asked Questions
What is the Q1 FY27 earnings calendar?
256 companies are scheduled to announce their April-June quarter results, covering a wide mix of sectors and including names like Infosys, Eternal, Bajaj Auto, UltraTech Cement, Nestlé India, Adani Power, Paytm and TVS Motor.
Which major names are on the earnings calendar this week?
Key names include Infosys, Eternal, Bajaj Auto, UltraTech Cement, Nestlé India, Adani Power, Paytm and TVS Motor.
What is the market outlook for Q1 FY27?
Market sentiment is supported by encouraging Q1 FY27 business updates and growing optimism over a healthy earnings season, with macro cues remaining favorable.
What does Goldman Sachs say about the Nifty 50?
Goldman Sachs expects the Nifty 50 to rebound to 26,500 by June 2027, signaling constructive sentiment as macro conditions improve.
How can retail investors use Swastika's Sarthi AI stock assistant?
Swastika's Sarthi AI stock assistant provides institutional-grade research on stocks and indices to retail investors, helping interpret earnings signals and price moves. Visit the tool here:Swastika's Sarthi AI stock assistant.
Conclusion
In practice, this means structuring trades around verified price reactions to earnings data, rather than chasing headlines. If you want a more disciplined, data-driven approach, consider using price channels, earnings momentum scores, and cross-sector validation. The week ahead is a test of earnings resilience, macro-inflation dynamics, and investor appetite for growth versus value. With the right framework, you can translate the earnings cadence into a navigable path for your portfolio.
Kobo Biotech Share Price Sparks A 363% Six-Month Rally Among Penny Stocks
Key Takeaways
- Nine penny stocks delivered up to 363% returns in six months, led by Kobo Biotech.
- The kobo biotech share price is part of a broader low-cap rally identified by ACE Equity.
- Investors must beware liquidity, volatility, and limited transparency in penny stocks.
- Discipline, thorough research, and robust risk controls are essential for success.
Nine penny stocks rallied in the last six months, delivering returns from 16% to 363% and turning small price bets into outsized moves. The standout is the kobo biotech share price, which surged as part of a disciplined, low-cap rally flagged by ACE Equity. For retail investors across India, this story begs a critical question: how do you identify winners in a space known for liquidity gaps and sharp volatility, and what risk controls keep you from getting burned? This article disentangles the data, explains the underlying drivers, and offers a framework you can apply to similar opportunities without losing sight of risk.
At the core of this discussion are nine penny stocks with market capitalisations below Rs 1,000 crore, share prices under Rs 20, and a minimum average trading volume of 5 lakh shares. The results show a spectrum: from multibaggers to modest gainers. The numbers are sourced from ACE Equity, and they provide a concrete sense of how quickly a low-priced market segment can move if liquidity and momentum align. The essential takeaway for retail investors is not just which names moved, but how to replicate disciplined screening, risk management, and exit discipline in real-time.
Kobo Biotech Share Price And The Six-Month Penny Stock Rally
The highlight within the group is the Kobo Biotech share price, which surged by an impressive 363% over six months. This isn’t a one-off blip; it represents a broader pattern where low-priced names with decent trading volume and specific sector catalysts can deliver outsized gains. In other words, the Kobo Biotech share price didn’t rise in isolation. It rode a wave created by a combination of liquidity filters (market cap under Rs 1,000 crore), price thresholds (under Rs 20), and sustained trading interest (minimum 5 lakh shares on average). When you see a move like this, it’s useful to ask: what exactly changed in the fundamentals or sentiment to sustain momentum, and where could liquidity fall away? The data suggests the rally was data-driven rather than purely speculative, but it also underscores that the window can close quickly.
For readers who want to quantify exposure, a simple takeaway is to track not just price action, but volume and spread. Penny stocks often exhibit thin liquidity outside of brief surges; if buyers evaporate, even a 100% gain can reverse rapidly. That’s why a pre-defined exit plan is essential: know your stop-loss level, estimate a reasonable downside, and avoid chasing momentum into illiquid traps. The Kobo Biotech share price story, while inspiring, should be viewed through the lens of risk discipline rather than pure return chasing.
To bolster your screening, consider the three core filters that helped identify these names: market capitalisation below Rs 1,000 crore, share price under Rs 20, and a minimum average trading volume of 5 lakh shares. These criteria help separate genuine interest from speculative noise, but they’re not a free pass. Always corroborate with on-ground checks of business fundamentals, news flow, and corporate actions that could affect liquidity–such as fund-raising, debt repayment, or change in management. And when you spot a move you like, implement a staged entry rather than a full allocation, preserving headroom to add on pullbacks rather than chasing a breakaway rally.
As you consider the Kobo Biotech share price and its peers, a practical framework emerges: a disciplined entry triggered by concrete liquidity signals, a predefined risk budget per position, and a structured exit strategy that protects profits while allowing for continued participation in the trend. If you’re seeking a structured approach to these dynamics, Swastika’s Swastika's Sarthi AI stock assistant can help translate market signals into actionable research notes and risk controls.
Which Stocks Turned Multibaggers And What It Means For Your Portfolio
Beyond Kobo Biotech, several other names delivered notable six-month gains. Gujarat Inject (Kerala) posted a 218% return, while Panafic Industrials delivered 167%. RGF Capital Markets rose 136%. These figures illustrate that a handful of low-priced stocks can outperform the broader market meaningfully over a six-month horizon, but they also remind us that not all names will follow suit. For every multibagger, there are names that merely move sideways or fade after the initial spark. The lesson for investors is clear: diversify within a disciplined framework, and avoid concentrating bets in a single slug of momentum with uneven liquidity and opaque fundamentals.
The list also includes Quadrant Televentures at 50%, NCL Research & Financial Services at 36%, and ontic finserve stock at 36%. The tone across these results remains consistent: strong short-term moves can occur in clusters, driven by liquidity and micro-market dynamics rather than broad, fundamental changes in the business environment. Then there are nhc foods stock at 34% and Consecutive Commodities at 16%, which show the more modest tail of the distribution–yet even these smaller gains can be meaningful when part of a balanced, well-managed portfolio. This spectrum underscores why time-tested risk practices–position sizing, diversification, and disciplined exits–are your best defense in penny stocks.
In discussing these movements, it is important to anchor the data with a sense of market structure. The occupation of price levels below Rs 20, coupled with liquidity cycles, can produce outsized returns for a window of time. After a surge, a pullback often follows as participant interest normalizes. The presence of multiple names with double-digit gains in a six-month frame signals momentum but also invites heightened scrutiny on the durability of earnings, corporate actions, and macro drivers that can feed or drain liquidity. As always, a careful, evidence-based approach helps you separate signal from noise and reduces the risk of emotional decision-making during choppy trading sessions.
Risk Factors, Liquidity, And The Importance Of A Disciplined Approach
Penny stocks can be seductive due to their low price and potential for rapid gains, but they come with meaningful downsides. Liquidity can be inconsistent, making it difficult to enter or exit positions without impacting price. Volatility can swing on a moment’s notice, driven by thin order books and episodic news. Transparency can be limited, with cash flows and financials sometimes less robust than investors expect. The six-month data set we’re reviewing makes these risk characteristics explicit: even the top performer registered a volatility profile that could have banked a heavy downside if a market shift occurred. The practical implication for retailers is to structure a framework where risk is understood upfront and managed through position sizing, hedging, and exit discipline.
In practice, you should treat penny stock exposure as a satellite portion of your overall portfolio rather than a core holding. The recommended approach is to allocate a small percentage of capital to this segment, apply strict stop losses, and maintain ample liquidity to manage contingencies. Always validate the qualitative story behind the quantitative signal–revenue trends, product traction, competitive dynamics, and regulatory considerations–before committing capital. By maintaining a risk-aware posture and leveraging disciplined screening criteria, you can potentially benefit from the upside while limiting downside, even in a volatile space like penny stocks.
Frequently Asked Questions
Which penny stock yielded the highest six-month return in the list?
Kobo Biotech delivered the highest six-month return at 363%.
What is the six-month return for ontic finserve stock?
ontic finserve stock had a 36% six-month return.
What is the six-month return for nhc foods stock?
nhc foods stock had a 34% six-month return.
What filters were used to identify these penny stocks?
Market capitalisation below Rs 1,000 crore; share price under Rs 20; minimum average trading volume of 5 lakh shares.
What are the main risks of investing in penny stocks like these?
Low liquidity, sharp volatility, and limited transparency.
Conclusion
What these six months teach a patient, prudent retailer is that penny stocks can deliver compelling upside, but only when pursued with a disciplined framework that emphasizes liquidity, risk management, and credible research. The Kobo Biotech share price narrative illustrates both the excitement and the risk–the kind of story that rewards methodical, repeatable investing rather than impulsive bets. If you take away one mental model from this piece, let it be this: treat every low-price opportunity as a potential trade that must meet your predefined risk thresholds and exit rules before you ever enter. The practical upshot is clear: build a small, well-researched watchlist, test ideas in a simulated or small-scale manner, and rely on a structured process rather than a single jaw‑dropping anecdote.
Open your trading and demat account here
Reference :
1 : Economictimes
HDFC Bank Share Price And Onboarding Reforms: A Retail Investor’s Guide
Key Takeaways
- HDFC Bank slowed new account openings to improve quality, not due to demand or rates.
- The bank used algorithms and rule-based screening to curb mule accounts and strengthen onboarding.
- With over 100 million customer relationships, deposits remain a crucial funding source even as systemwide growth stays weak.
- A re-acceleration in customer additions is expected after onboarding reforms are completed.
HDFC Bank Share Price: How Onboarding Reforms Could Shape The Near-Term Trend
Retail investors are watching hdfc bank share price as one of the most liquid signals in India’s financial landscape. As India’s largest private lender by assets and reach, HDFC Bank is a focal point for retail money and the broader system's health. Recently, the bank disclosed a deliberate slowdown in the pace of opening new accounts during FY24, FY25 and FY26. The intent was not a response to weak demand or higher rates; instead, it was a controlled tightening of the onboarding process designed to improve the quality of new relationships. This distinction matters for investors because it reframes the narrative from growth-at-any-cost to growth-with-guardrails. The bank argues the changes are a correction to ensure risk controls are robust in a digital onboarding world, rather than a retreat from growth.
What exactly changed? The bank said it turned to algorithms and rule-based systems to screen applicants more thoroughly before opening accounts. In the bank’s own framing, this is about moving to the new realm of better quality acquisitions. As a result, the pace of customer additions slowed across FY24, FY25 and FY26, even as the bank continued to accumulate more than 100 million customer relationships. The leadership emphasizes that the objective was to ensure that new accounts met internal standards of quality, not simply to chase faster growth. We were gearing ourselves to the new realm of better quality acquisitions. This is a reflection of a broader shift in risk management for a digitized onboarding environment, where the guardrails are meant to prevent unwanted accounts while preserving long-run growth potential.
Beyond onboarding, the bank highlights that deposits remain a lifeblood of funding. Savings and current accounts deposits (CAS) are among the lowest-cost sources of funding for lenders, which underscores why the bank’s emphasis on acquisition quality is important for profitability. It is also critical to monitor the systemwide context: deposits across the Indian banking system have shown relatively weak growth in recent years. In this environment, the credit-deposit ratio–a key measure of lending against deposits–will be watched closely by investors and regulators alike. As the bank completes onboarding changes, it has signaled that customer additions should improve, which could translate into a healthier momentum for the hdfc bank share price over time.
The path to a meaningful re-acceleration is not guaranteed, but management has framed the changes as a “correction to ensure guardrails” rather than an attempt to curb growth. In the near term, the stock may remain sensitive to any shifts in onboarding velocity, fraud-control metrics, and the pace of new customer openings relative to overall loan growth. The leadership has stated that they are now ready to press the pedal, suggesting an upcoming period of improved momentum once the onboarding changes stabilize. For investors, this sets up a scenario where the hdfc bank share price could reflect not just deposits and loan growth, but the quality of new customers and risk management discipline in a fast-evolving digital landscape.
For readers seeking more granular stock-level insight, Swastika’s Sarthi AI stock assistant offers further analysis and model-driven scenarios. Swastika's Sarthi AI stock assistant can help translate these onboarding reforms into actionable investment ideas that align with your risk tolerance and horizon.
Why The Onboarding Reforms Are A Big Deal For Deposits And Growth Quality
The relationship between onboarding quality, deposit growth, and profitability is a fundamental signal for the health of any bank. HDFC Bank’s emphasis on stronger screening at the time of onboarding is designed to improve the mix of new customers, which–over time–could translate into better asset quality and a more durable funding base. While the bank’s credit-deposit ratio is a metric to watch, the broader narrative is about a shift toward quality over rapid accumulation. The bank notes that the changes were designed to ensure guardrails to prevent mule accounts, a risk that digital payments and online scams have magnified in recent years. In other words, the bank’s action is a defensive measure to maintain trust and stability at a time when digital onboarding is expanding rapidly across India.
As of now, the bank has more than 100 million customer relationships, a scale that underscores why even small improvements in account quality can compound into meaningful long-run value. The emphasis on CAS deposits as a low-cost funding source is particularly important in a system where deposit growth has been tepid. If onboarding reforms successfully improve the quality of new customers while preserving or expanding the deposit base, HDFC Bank could sustain healthy profitability while also supporting a higher-quality growth trajectory for the hdfc bank share price. Investors should watch for several qualitative signals: the pace of customer additions once onboarding reforms have matured, trends in non-performing assets (NPAs) or stressed assets, and the bank’s ability to manage costs while investing in digital infrastructure inspired by the onboarding changes.
In sum, the onboarding reforms are less about slowing growth and more about aligning growth with risk-adjusted profitability. The bank’s leadership has framed the changes as a step toward better quality acquisitions, not a strategic retreat. As the market digests this message, the hdfc bank share price will likely respond to two interrelated factors: (1) the speed at which high-commitment customers are added, and (2) the training and performance of the bank’s digital onboarding systems that prevent mule accounts and ensure compliance with evolving regulatory standards. For retail investors, the key takeaway is to look beyond a headline number on account openings and focus on what the onboarding reforms mean for deposit quality, loan growth, and the economics of the bank’s funding mix.
What The Mule Account Challenge Means For Deposits And The Credit-Deposit Ratio
The mule account phenomenon, as described by the bank’s leadership, is a risk in the digital onboarding era. Mule accounts are bank accounts used to receive or move money obtained through fraud; their presence invites illicit capital flows and raises compliance costs. The bank’s approach–algorithmic screening and rule-based checks–aims to reduce this risk by tightening onboarding. For investors, the critical implication is that the quality of new accounts matters as much as volume. A higher-quality onboarding pipeline can enhance the stability of CAS deposits, which remain a low-cost funding source for lenders. But it can also slow the rate at which new customers are added, at least in the near term, until the onboarding systems are perfected and scalable across the entire customer base.
The system-wide context matters here: deposit growth across the banking system has remained relatively weak in recent years. In such an environment, banks with a robust onboarding process and strong risk controls may enjoy a better quality growth story than those chasing volume. The credit-deposit ratio, which measures how much a bank lends relative to its deposits, remains a critical watch point for analysts and investors. If HDFC Bank can sustain a high-quality growth path while stabilizing or improving its deposit base, the long-run trajectory of the hdfc bank share price could reflect both improved asset quality and better profitability metrics.
Historically, the bank has indicated that it has more than 100 million customer relationships, which provides a large base from which to grow through targeted cross-selling, digital services, and financial products. The onboarding changes are designed to reduce the risk of unwanted accounts while still enabling responsible growth. The bank notes that its long-run objective is to balance the pace of customer additions with the quality of onboarding to achieve sustainable, profitable growth. The lessons extend beyond HDFC Bank, offering a template for other Indian banks navigating the twin pressures of digital onboarding and fraud risk in a rapidly expanding payments ecosystem.
In sum, the onboarding changes are a signal that the bank is prioritizing risk-adjusted profitability over sheer volume. The 100 million customer relationships anchor the potential for cross-sell and more stable deposit growth, even as near-term growth pace remains a focal point for investors. The emphasis on guardrails to prevent mule accounts highlights a broader industry trend toward resilient, compliant digital onboarding that can support long-run value creation for shareholders.
How The 100 Million Customer Relationships Shape Growth, Deposits, And Pricing
Having more than 100 million customer relationships creates a solid platform for deposit-based funding and cross-sell opportunities. The bank’s deposit base is a critical source of low-cost funds, and the emphasis on onboarding quality aims to protect this advantage while pursuing growth opportunities. With CAS deposits among the lowest-cost sources of funding, the profile of new customers matters more than ever to sustain profitability in a high-competition environment. The onboarding changes should help the bank maintain a stable deposit mix while improving loan origination quality and asset quality–two pillars of a durable return profile for the hdfc bank share price. Investors should monitor the accuracy of the bank’s customer data, the rate of de-duplication across digital onboarding, and the cost-to-income ratio as indicators of the program’s effectiveness.
The bank’s leadership has highlighted the upcoming phase with optimism: I think we are now ready to press the pedal, suggesting an acceleration in customer additions once the onboarding changes have matured. The 100 million-plus customer relationships are a base for the bank to leverage for cross-sell and deposit growth while maintaining a prudent risk stance. In a semi-automated onboarding environment, the integrity of customer data becomes a critical asset, supporting a more resilient funding structure and a more efficient operation overall. This is the kind of growth profile that can support a healthier, more sustainable hdfc bank share price trajectory, provided the onboarding and risk-management levers work in unison with a rising economy and favorable rate environment.
As a retail investor, it’s essential to see onboarding reform not as a sign of trouble but as a risk-managed upgrade to the bank’s customer base. The long-run value is not a one-quarter spike in new accounts, but a durable improvement in asset quality, funding stability, and cross-sell opportunities. With the 100 million customer relationships as a backbone, HDFC Bank could accelerate growth through higher-quality customers and an expanded digital services suite–provided the regulatory environment remains stable and the bank’s digital platform scales smoothly.
What Could Drive A Re-Acceleration In Customer Additions And Revenues
With onboarding reforms behind them, the bank signaled a path toward increased customer additions. The management’s language–We are reasonably confident that we should reach reasonably healthy numbers in terms of annual momentum... at the quality that one would necessarily need in this kind of a digital environment–frames an optimistic outlook for the next phase. The near-term narrative is likely to hinge on how quickly the onboarding controls can be scaled across the bank’s vast customer acquisition apparatus and how they translate into higher-quality growth. For investors, the key is to monitor the rate at which customer additions reaccelerate, the consistency of cross-sell metrics, and the performance of the funding mix in a higher-growth scenario. A clear reading is that the bank believes the guardrails have done their job and that the quality of new accounts is ready to improve.
The broader context–systemwide deposit growth remains tepid–makes this threshold critical. If the bank can deliver a higher-quality growth trajectory while maintaining or modestly expanding CAS deposits, the hdfc bank share price could reflect a more durable earnings trajectory that is less sensitive to short-term demand fluctuations. In the current environment, profitability hinges on efficient cost management, risk controls, and the ability to convert digital onboarding investments into meaningful revenue streams. This is exactly the kind of narrative that long-term value investors should weigh when evaluating the stock’s risk-reward in the next cycle.
Risk, Regulation, And The Broader Indian Banking Sector: Lessons For Retail Investors
The onboarding changes at HDFC Bank reflect a broader tension in India's banking sector: the need to guard against fraud and mule accounts in an era of rapid digital payments and online onboarding. Regulators are increasingly vigilant about the integrity of new account openings, and banks are being asked to demonstrate robust risk controls while sustaining growth. This context matters for investors, because perceived risk shifts can influence both the stock's multiple and the bank's funding costs over time. The bank’s emphasis on guardrails and high-quality acquisitions signals a commitment to sustainable growth, albeit with a near-term slower pace. The challenge is to balance customer acquisition momentum with risk controls and the costs of compliance in a digital environment that is rapidly evolving.
Retail investors should also consider the resilience of HDFC Bank’s deposit base relative to the cycle. Despite weak system-wide deposit growth, the bank emphasizes deposits from CAS as a low-cost source of funding. If onboarding reforms yield a higher quality deposit base, it could support a stronger profitability profile even if loan growth remains measured in the near term. However, the risk is that the onboarding changes could dampen growth momentum in the short term, potentially putting some pressure on near-term earnings growth and, by extension, the share price. These dynamics underscore the importance of a long-horizon perspective when evaluating the hdfc bank share price and the bank’s ability to translate onboarding into durable returns.
Related Reads
- HDFC Bank Share Price And Q1 Earnings Preview: NII, NIM, GNPA And Provisions Across Major Banks
- HDFC Bank Share Price: Q1 Earnings Preview And Sector Trends
- Hdfc Bank Share Price: Q1 FY27 Highlights, NII Growth, And Outlook
Frequently Asked Questions
Why did HDFC Bank slow new account openings?
The bank slowed new account openings to improve quality, citing the need to screen applicants to curb mule accounts and fraud; the move aimed at better-quality acquisitions.
How many customer relationships does HDFC Bank have?
The bank has more than 100 million customer relationships.
What did Sashidhar Jagdishan say about onboarding reforms?
We were gearing ourselves to the new realm of better quality acquisitions.
What is the current trend in systemwide bank deposits?
Systemwide deposit growth across the banking system has remained relatively weak in recent years.
When does the bank expect to increase customer additions again?
The bank expects customer additions to improve after completing onboarding changes.
Conclusion
In sum, the HDFC Bank onboarding reforms illustrate a strategic shift to risk-aware growth, with a clear emphasis on quality, compliance, and digital-enhanced processes. The bank’s communications suggest that the guardrails are now in place and that the firm expects a re-acceleration in customer additions as the new systems scale. For retail investors, this is a story about how a large bank can retain growth potential while strengthening its risk profile–an outcome that could be favorable for the stock’s long-run trajectory, even as the near term remains nuanced.
Open your trading and demat account here
Reference :
1 : Ndtvprofit
Infosys Share Price Outlook Amid Q1 Earnings, Global Tensions, And FII Flows
Key Takeaways
- Six factors–Q1 earnings, Iran-US conflict, oil prices, global tech selloff, rupee, and FII behaviour–are likely to steer D-Street this week.
- Sensex rose over 582 points for the week, and Nifty 50 settled at 24,334, signaling a cautious but constructive tone.
- Friday's rally was led by several large-cap and IT stocks, while some sectors slipped about 1%.
- The rupee weakened to 96.28 per USD as FIIs turned net sellers for the week while DIIs bought.
Infosys Share Price Outlook After Q1 Earnings And Market Sentiment
The infosys share price continues to draw attention as the June-quarter earnings season accelerates and macro headwinds persist. Sensex rose by 582 points over the week, a gain of 0.75%, while Nifty 50 advanced more than 127 points to settle at 24,334. Friday's rally was led by Tech Mahindra, kotak mahindra bank stock price, TCS, Reliance Industries limited stock price, ICICI Bank, Hindustan Unilever, Mahindra & Mahindra, Axis Bank, Bajaj Finance, HDFC Bank, and Infosys, with these stocks advancing 1-4%. In contrast, Sun Pharma, Trent, Bharti Airtel, and UltraTech Cement slipped around 1% apiece. The focus on infosys share price sits amid this broad market action and a strengthening IT leadership in a choppy backdrop.
Investors will watch the six key factors for the week: 1) Q1 earnings; 2) Iran-US conflict; 3) Oil prices; 4) Global tech selloff; 5) Rupee; 6) FII behaviour. The June-quarter earnings season will gather pace in the coming week, with 256 companies set to announce their Q1 results. Key companies on the earnings calendar include Paytm; Bajaj Auto; TVS Motor; Adani Power; BPCL; Eternal; IndusInd Bank; HPCL; UltraTech Cement; Infosys; Bank of Baroda. This mix suggests a rotation across sectors and a potential tilt toward largecaps, with IT stocks leading gains and realty and metal stocks under pressure. The infosys stock price path will be heavily influenced by how Infosys, the IT heavyweight, and other large IT peers perform.
Six Key Factors Likely To Steer D-Street This Week
The political and macro backdrop remains a touchline for traders. Here are the six factors that could drive sentiment over the coming days:
- Q1 earnings: The June-quarter earnings season will gather pace in the coming week, with 256 companies set to announce their Q1 results. Key companies on the earnings calendar include Paytm; Bajaj Auto; TVS Motor; Adani Power; BPCL; Eternal; IndusInd Bank; HPCL; UltraTech Cement; Infosys; Bank of Baroda. This batch will shape relative valuations and the infosys stock price reaction among IT peers.
- Iran-US conflict: The conflict continues to escalate, with recent strikes and counterstrikes that affect energy markets and risk sentiment.
- Oil prices: Brent crude futures climbed around 5% to $88.10 a barrel, while US WTI rose over 4% to $82.49, both marking their highest levels since mid-June. For the week, Brent and WTI gained about 16%.
- Global tech selloff: In the U.S., the Nasdaq fell more than 2% on Friday; the S&P 500 and Nasdaq posted weekly losses, signaling risk-off sentiment that could impact IT heavyweights including infosys stock price and tcs earnings.
- Rupee: The Indian rupee posted its sharpest weekly decline since May, settling at 96.28 against the greenback. The broader bias remains weak given elevated crude prices and cautious FII flows; the 96.00–96.55 band may govern near-term action.
- FII behaviour: After earlier inflows, FIIs largely turned net sellers last week, pulling Rs 8,743.35 crore from Indian equities, while DIIs remained net buyers at Rs 8,790.75 crore.
According to Nair of Geojit, Despite concerns over escalating tensions in West Asia, which pushed crude oil prices above $85 a barrel and pressured the rupee, market sentiment remained supported by encouraging Q1 FY27 business updates and growing confidence in a healthy earnings season. He also noted a rotation towards largecaps, with IT stocks leading gains and realty and metal stocks under pressure.
Reference :
1 : Economictimes
Rising rotation into largecaps has brought IT leadership back into focus, with infosys share price closely watching how tcs earnings and other tech peers perform in the quarter. Rupak De, Senior Technical Analyst at LKP Securities, said the index is likely to remain firm, with the potential to move towards 24,800; immediate support at 24,200; a decisive break below this level could trigger a phase of consolidation.
As the week unfolds, investors should consider a mix of stock-level and macro signals. For instance, the rally on Friday showed strength among names like mahindra tech stock price, kotak mahindra bank stock price, and hdfc bank stock price alongside the IT heavyweights and financials. Watch how the infosys stock price moves in response to broader IT sector performance and how the rupee and oil dynamics shape near-term risk appetite. For more granular stock analysis, you can explore Swastika's Sarthi AI stock assistant for institutional-level research on any stock or index.
Technical View: Nifty’s Path And Support Levels
The technical setup suggests a firm bias with a potential upside toward 24,800 if buyers defend 24,200 on the downside. Rupak De notes that 24,200 is a crucial near-term guard; a decisive move below may lead to a consolidation phase. In this framework, infosys stock price could mirror IT sector strength or lag if global tech momentum remains weak. Traders should calibrate risk by watching global cues such as oil prices and US tech sector rotations while keeping a close eye on FII flows.
Stock-Specific Signals: Infosys Share Price And The IT Heavyweights
The IT sector has been a bright spot in the recent risk-off mood, with Infosys and other large IT names showing resilience. The infosys share price is likely to react to quarterly performance from Infosys and peers, while tcs earnings will also influence sentiment around the top-tier IT pack. Investors should also relate Infosys' trend to the wider IT ecosystem, where rotation toward largecaps continues to unfold, even as realty and metal spaces show pressure. In this context, the infosys stock price becomes a focal point for discerning whether value is re-emerging in the IT space or if earnings growth remains the key driver.
Meanwhile, a broader market tone may tilt toward "risk-on" for big names like reliance industries limited stock price and kotak mahindra bank stock price when earnings and macro cues align. The next phase of earnings releases, including tcs earnings and other IT results, could reaffirm or recalibrate the rotation among sectors and the price path for Infosys and other IT leaders. The market's reaction to Q1 may hinge on guidance and margin discipline, with the infosys stock price acting as a proxy for the IT sector’s broader health.
For investors seeking a structured approach to stock selection in this environment, Swastika’s Sarthi AI stock assistant can help you analyze a stock’s intrinsic traits, compare peers, and map risk-reward in real-time. Swastika's Sarthi AI stock assistant can be a useful companion as you interpret earnings updates and macro signals.
Related Reads
- Infosys Share Price And The Inverse AI Trade: Jefferies Sees India As The Big Beneficiary
- Infosys Share Price Trends And July 2026 Nifty F&O: A Retail Investor's Guide
- Infosys Share Price Outlook As Nifty IT Rebounds: A Retail Investor Guide
Frequently Asked Questions
What are the six factors likely to steer D-Street this week?
Q1 earnings; Iran-US conflict; Oil prices; Global tech selloff; Rupee; FII behaviour.
How did Sensex and Nifty perform last week?
Sensex rose over 582 points (0.75%) for the week; Nifty 50 gained more than 127 points to settle at 24,334.
Which stocks led Friday's rally and which slipped?
Rally led by mahindra tech stock price, kotak mahindra bank stock price, TCS, Reliance Industries limited stock price, ICICI Bank, Hindustan Unilever, Mahindra & Mahindra, Axis Bank, Bajaj Finance, HDFC Bank, and Infosys (gains 1-4%). Slipped: Sun Pharma, Trent, Bharti Airtel, UltraTech Cement (about 1%).
What is the rupee trend and how did FIIs behave?
The rupee settled at 96.28 per USD for the week, with a weak bias. FIIs pulled out Rs 8,743.35 crore; DIIs bought Rs 8,790.75 crore.
How many companies will declare Q1 results and which names should investors watch?
256 companies will declare Q1 results; key names include Paytm, Bajaj Auto, TVS Motor, Adani Power, BPCL, Eternal, IndusInd Bank, HPCL, UltraTech Cement, Infosys, and Bank of Baroda.
Conclusion
Retail investors should recognise that the Infosys share price and the broader market are being shaped by a complex blend of earnings momentum, macro risk, and capital flows. The six drivers–Q1 earnings, Iran-US conflict, oil prices, global tech selloff, the rupee, and FII behaviour–will likely decide the near-term trajectory, with IT leadership offering a potential cushion even as macro headwinds persist. The prudent approach this week is to build a balanced view: validate stock picks with earnings visibility, monitor rupee and oil dynamics, and avoid over-concentration in any single theme. A measured, high-conviction plan will help you navigate a market where rotation to largecaps and IT names could continue to define the path for Infosys share price and the broader IT universe.
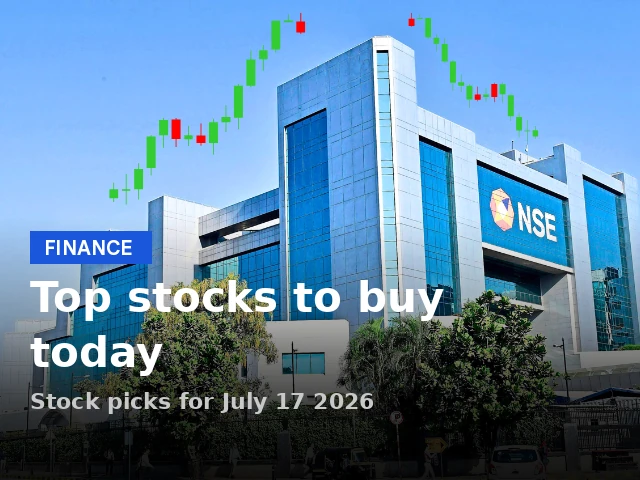
Adani Power Share Price Momentum And IndusInd Bank Stock Outlook For July 17, 2026
Key Takeaways
- Bajaj Broking Research flags Adani Power and IndusInd Bank with a 1-month horizon.
- Adani Power share price buy range is Rs 215-221 with target Rs 246 and stoploss Rs 203.
- IndusInd Bank stock price today is seen within Rs 995-1015; target Rs 1095 and stoploss Rs 952.
- Market recap shows Sensex at 77,186.87 and Nifty at 24,072.75 with intraday gains.
In a market that blends cautious optimism with selective risk-taking, the adani power share price story stands out for its clearly defined levels and risk controls. Bajaj Broking Research has flagged Adani Power and IndusInd Bank with a one-month horizon, highlighting a disciplined approach to trading these ideas. The adani power share price narrative is anchored around a key support zone and a defined upside target, making it a focal point for traders tracking short-term gain opportunities.
Adani Power Share Price: Buy Range, Target, And Technical Setup
Adani Power’s trade setup is anchored in defined price levels. The buy range is Rs 215-221, with a target of Rs 246 over a one-month horizon. A stoploss of Rs 203 provides a protective boundary to control downside and manage risk. The chart context shows a base forming around the key support area of 212-217, aligning with the last month’s low and setting the stage for a potential rebound.
From a technical standpoint, the confluence of the last month low, a 38.2% retracement of the prior move from 145 to 254, and the 50-day EMA provides a robust setup for an up-move. The forward expectation is to head toward 246 within a month, representing roughly 80% retracement of the entire prior decline (254-215). Daily stochastic momentum has turned bullish, moving above its three-period average and adding near-term momentum to the adani power share price narrative.
Price action around the adani power share price chart suggests that a decisive breakout beyond 221 could unlock a deeper ascent toward the target. Conversely, a break below the base zone around 212-217 could necessitate reassessment of risk controls. For deeper stock-level research, check Swastika's Sarthi AI stock assistant.
IndusInd Bank Share Price Outlook: Buy Range, Target, And Breakout Signals
IndusInd Bank has been consolidating after a robust up-move, forming a setup that can offer a fresh entry for disciplined traders. The buy range is Rs 995-1015, with a target price of Rs 1095 and a stoploss of Rs 952 for a one-month horizon. The pattern observed on the chart is a bullish flag: seven sessions of consolidation following a six-session up-move, suggesting a breakout above the flag’s upper boundary could spark the next leg higher. The price target of 1095 aligns with a retracement zone and the high logged in November 2024.
The momentum on IndusInd Bank remains constructive: the MACD remains in an uptrend and is sustaining above its nine-period average. This supports the idea that the indusind bank stock price today could extend higher if momentum holds. On the indusind bank chart, the bullish-flag pattern remains intact, signaling that a breakout could validate the entry and propel prices toward the 1095 target. For deeper stock-level research, check Swastika's Sarthi AI stock assistant.
Investors watching the indusind bank stock price today should stay alert for a breakout confirmation, and the indusind bank chart can help confirm momentum shifts. The stock’s parameters fit a disciplined buy-for-move narrative within a one-month horizon, but one should respect risk controls given the current market backdrop. Swastika's Sarthi AI stock assistant can provide tailored alerts and risk-reward analyses for this and similar ideas.
Market Context And Key Levels To Watch On July 17, 2026
The broader market backdrop, as captured in the round-up, shows a market that moved within a narrow range with selective strength on the index. The Sensex closed at 77,186.87, with an intraday high of 77,579.69 and an intraday gain of 394.26 points, equating to a gain of 0.51% intraday. The Nifty 50 settled at 24,072.75, down 5.75 points and 0.02% on the session. These core levels provide the context within which adani power share price and indusind bank stock price today setups play out, particularly when liquidity and global cues align with domestic momentum.
Traders should also study the adani power share price chart and the indusind bank chart in this market context, as they can reveal the relative strength of the ideas against the broader market backdrop. If the overall market remains steady or improves, these stock-specific setups may see a smoother path to the 246 and 1095 targets, respectively.
Risk Management And Practical Execution For These Setups
Even the best technical patterns require disciplined risk management. For Adani Power, a stop at 203 and a gradual, measured entry aligned with the 215-221 buy zone can help limit downside risk. For IndusInd Bank, the breakout above the bullish flag upper boundary would validate the entry; until that happens, traders may look for pullbacks toward 995-1015 as potential support zones. The 952 stop for IndusInd Bank remains a key anchor for risk control, and traders should avoid over-sizing risk per trade.
To supplement these ideas with robust analysis, consider Swastika's Sarthi AI stock assistant as a dynamic research companion that can tailor each thesis to your risk appetite and time horizon. Swastika's Sarthi AI stock assistant.
Frequently Asked Questions
What is the buy range for Adani Power according to Bajaj Broking Research on July 17, 2026?
Adani Power buy range: Rs 215-221.
What is the target price for Adani Power?
Target price: Rs 246; implied return approximately 12%.
What is the stoploss for Adani Power?
Stoploss: Rs 203.
What is the buy range for IndusInd Bank?
IndusInd Bank buy range: Rs 995-1015.
What is the IndusInd Bank target price and pattern?
Target price: Rs 1095; pattern: bullish flag; breakout above flag could offer a fresh entry.
What were the market recap numbers mentioned in the report?
Sensex closed at 77,186.87; intraday high 77,579.69; intraday gain 0.51% (394.26 points); Nifty 50 closed at 24,072.75; Nifty change -0.02%.
Conclusion
For the retail investor, the present moment offers two clearly defined, one-month trade ideas with attractive risk-reward dynamics: Adani Power share price is navigating a defined buy zone with a target near 246, supported by a technical confluence, while IndusInd Bank stock price today shows a bullish-flag setup with a path to 1095 if momentum continues. The market backdrop, anchored by Sensex and Nifty levels, supports careful entry and risk management rather than chasing momentum in a rising market.
Open your trading and demat account here
Reference :
1 : Timesofindia

Fifa World Cup Rings: A Limited-Edition Collector's Asset For Investors
Key Takeaways
- A strictly limited 2,026-piece fifa world cup rings collection features 30 pieces for the champions.
- 1,996 rings will be released globally as fifa official licensed products, each accompanied by a certificate of authenticity.
- Each ring shows the FIFA World Cup trophy on the front and the champions' identity on the back, with custom fitting and numbering.
- Temporary championship rings will be shown at celebrations, with the full set later customized and presented.
What Makes The Fifa World Cup Rings A Rare Collectible For Investors
Beyond the prestige, the rarity of the fifa world cup rings stems from constrained supply and structured distribution described by the official release. The 2,026-piece collection is strictly limited, with 30 rings reserved for the champions and 1,996 released globally as fifa official licensed products. Each ring bears the FIFA World Cup trophy on one side and the identity of the champions on the other, creating a symmetrical narrative of glory and ownership. The manufacturing promise that each ring is individually numbered, custom-fitted, and delivered with a certificate of authenticity adds a layer of trust that is rare in sports memorabilia.
From an investor’s lens, the value driver lies not just in the trophy imagery but in the provenance and the exclusivity. The fact that the full set is delivered after a customization process reinforces the idea of fit and personalization–elements that help preserve premium pricing as the ownership of a truly unique asset increases. The official release frames this as a limited collectors’ edition rather than a mass-produced item, which matters when considering resale leverage or a potential strategic position within a broader memorabilia portfolio.
How The 2,026-Piece Limited Collection Is Structured For Collectors
The total of 2,026 rings represents an equilibrium between rarity and scaled distribution. Within this total, 30 rings are reserved exclusively for the champions, ensuring a direct link between on-field success and ownership access. The remaining 1,996 pieces will be released globally as fifa official licensed products, aligning with the licensing framework designed to protect branding, quality, and consistency across markets. Each ring will be individually numbered and custom-fitted, with a certificate of authenticity included–an essential credential that helps separate genuine memorabilia from duplicates.
From an investor’s lens, the value driver lies not just in the trophy imagery but in the provenance and the exclusivity. The fact that the full set is delivered after a customization process reinforces the idea of fit and personalization–elements that help preserve premium pricing as the ownership of a truly unique asset increases. The official release frames this as a limited collectors’ edition rather than a mass-produced item, which matters when considering resale leverage or a potential strategic position within a broader memorabilia portfolio.
Global Release And Licensing For The Fifa World Cup Rings
Global release is governed by a licensing framework described by FIFA as fifa world cup licensing. In this structure, exactly 1,996 rings will be released globally as fifa official licensed products, ensuring that every piece meets standardized branding and quality controls. Each ring carries the iconic FIFA World Cup trophy on one side and the identity of the champions on the other side, and every ring is individually numbered and accompanied by a certificate of authenticity. The combination of official licensing, authentication, and distinct numbering creates a credible provenance story that can help with long-term valuation within a niche market.
Beyond the branding discipline, the program mirrors a broader tradition in American sport where victory is commemorated with bespoke rings–a custom that has become a benchmark for lasting memorabilia. The idea of presenting championship rings to title-winning teams is widely celebrated across leagues such as the NFL, NBA, MLB, and NHL, and this World Cup iteration signals football’s potential adoption of a similar, cross-pollinated tradition. The final also introduces considerations around a mid-game entertainment element–the half-time show–that could amplify exposure for the event’s accompanying memorabilia.
Customization, Authentication, And Presentation: What Buyers Should Know
Key features that buyers should note include: each ring is custom fitted to ensure a perfect physical fit; every piece is individually numbered; and the set comes with a certificate of authenticity. The trophy is depicted on one side, while the champions’ identity is engraved on the opposite side. The custom-fitting process, along with precise numbering, is designed to prevent unauthorized duplication and to preserve the asset’s value over time. The temporary championship rings shown to the winning captain and head coach during celebrations illustrate the tradition’s early phase, with the full 30-ring set scheduled for a later, formal presentation.
For investors evaluating whether to gain exposure to this niche asset, several practical considerations matter. The supply is fixed and finite–even within its global distribution–limiting the potential for mass-market saturation. The combination of official licensing and a verifiable certificate of authenticity helps build trust, though it does not guarantee price appreciation. Like any collectible with limited data, the asset’s value will depend on buyer demand, branding strength, and the ability to maintain exclusivity through the lifecycle of the asset. Swastika’s Sarthi AI stock assistant can help you drill into licensing exposures and the broader memorabilia space–Swastika's Sarthi AI stock assistant.
The Half-Time Show And The Market For Limited Sports Memorabilia
The World Cup final will also debut a concept borrowed from American sport: the half-time show. This element is described as a notable shift toward integrating entertainment with the sport’s defining moment, a dynamic that can impact fan engagement and the memorabilia market. The broader message from the release underscores a historic-first approach: members of the winning team will be presented with bespoke championship rings as part of the celebration. This aligns with a tradition of presenting championship rings to title-winning teams across leagues such as the NFL, NBA, MLB, and NHL, where a customized ring honors the victory and cements it in history.
Investor Takeaways: What Retail Investors Should Consider
For retail investors, the pivotal questions about the fifa world cup rings come down to scarcity, provenance, and timing. The official allocation framework–30 rings for the champions and 1,996 for the global public–establishes a predictable but finite supply. The use of a certificate of authenticity, and the insistence on a custom-fit and individual numbering, fortifies the asset’s credibility within a growing collectibles segment. The two-phase presentation approach–temporary rings at celebrations, followed by a later detailed handover–adds a narrative arc that can support value retention if demand remains robust and branding stays strong.
Frequently Asked Questions
What are fifa world cup rings?
They are a strictly limited 2,026-piece collection of individually numbered rings for the FIFA World Cup, with 30 reserved for the champions and 1,996 released globally as fifa official licensed products. Each ring features the FIFA World Cup trophy on one side and the identity of the champions on the other, and every ring is numbered and comes with a certificate of authenticity.
How many pieces are in the collection and how are they allocated?
The collection comprises 2,026 rings in total. Of these, 30 are reserved exclusively for the winning team, while 1,996 will be released globally as fifa official licensed products.
What distinguishes these rings in terms of customization and presentation?
Each ring is individually numbered, custom-fitted, and accompanied by a certificate of authenticity. The trophy is depicted on one side, with the champions’ identity on the opposite side, and the final presentation occurs at a later ceremony after customization.
When and how will the winning team receive their rings?
During celebrations in the immediate aftermath, the winning captain and head coach will receive temporary championship rings. The full 30-ring set will be customized to ensure a perfect fit and then presented at a later ceremony.
What is the half-time show’s role in this event?
The final will feature a half-time show, and the winning team will be presented with bespoke championship rings as part of the celebration, reflecting a tradition commonly seen in American sports leagues.
Conclusion
The fifa world cup rings program represents a hybrid between sport history and collectible asset dynamics. The official release highlights a 2,026-piece limited collection, with 30 rings reserved for the champions and 1,996 released globally as fifa official licensed products. Each ring bears the FIFA World Cup trophy on one side and the champions’ identity on the other, and every piece is numbered, custom-fitted, and accompanied by a certificate of authenticity. The two-phase presentation–temporary rings at celebrations, followed by a later detailed handover–adds a lasting narrative that can support value over time, provided demand remains sustained and branding stays strong.
Open your trading and demat account here
Reference :
1 : Ndtvprofit
Big Budget


Popular Articles




.avif)
.avif)

.avif)



START YOUR INVESTMENT JOURNEY
Get personalized advice from our experts
- Dedicated RM Support
- Smooth and Fast Trading App
