


Infosys Share Price Today: A Practical Guide For Retail Investors




Key Takeaways
- Infosys share price moves with global tech demand and domestic cues.
- Investors should read charts and stay aware of quarterly results and dividends.
- Valuation metrics and dividend returns matter for long-term returns.
- A disciplined approach using Swastika's Sarthi AI stock assistant can help navigate volatility.
Infosys share price is more than a number on a ticker; it's a lens into the health of India's dominant IT services player and, by extension, the broader sector of technology services. When you see a price move, it's not just a bet on the company; it's a reflection of global IT demand, currency headwinds or tailwinds, and how well the business translates strategy into growth. For Indian retail investors, decoding these signals is essential to building a resilient long-term portfolio. In this article, we explain how infosys share price moves, what earnings and dividends tell you, and how to build a framework for decision-making.
To start, note that infosys share price is more than a momentary tick; it's the price of confidence in the company's future. This guide will help you separate noise from signal and develop a repeatable approach to evaluating Infosys in different market regimes.
Infosys Share Price Today: A Practical Guide For Retail Investors
In the short term, infosys share price today can be influenced by daily news flow and trader sentiment, but the longer-term trajectory is shaped by fundamentals such as revenue growth, operating margin, and capital discipline. Here are practical steps to read the tape:
- Review the latest quarterly results to gauge top-line growth and margin expansion.
- Monitor the dividend policy and payout ratio as a signal of healthy cash flow and capital allocation.
- Watch macro drivers like IT spend cycles, rupee-dollar FX, and the competitive landscape.
For a consistent reference, compare price action across major Indian exchanges (NSE and BSE). Differences exist due to liquidity and currency effects, but the trend matters more for a long-term investor than the exact tick on one exchange.


Infosys Stock Price NSE: Reading Movement And Market Depth
The actual price you see for Infosys stock price on NSE during trading carries signals about demand and supply at different price levels. Metrics to monitor include intraday volume, price change, and the stock's momentum over 2 to 5 days. If the price moves higher on strong volume, it can indicate robust buying interest; a rise on tepid volume can hint at exhaustion or a potential pullback.
Retail investors benefit from a consistent reference: track the NSE price alongside the BSE price and consider the differential caused by liquidity and market hours. In addition, align price interpretation with catalysts such as Infosys quarterly results and infosys dividend announcements to interpret price action more accurately.
For deeper research, consider Swastika's Sarthi AI stock assistant, a tool that helps you scan news, measure risk, and compare scenarios quickly. Swastika's Sarthi AI stock assistant.
Infosys News And Its Impact On The Share Price
Infosys news, whether it relates to strategic partnerships, product launches, or management commentary, can create short-term volatility in the infosys share price. The market tends to assign more weight to credible catalysts that signal durable growth rather than transient headlines. When you see a spike or pullback, ask whether the news changes the long-run trajectory or simply shifts near-term expectations.
To translate news into a decision, consider the source, context, and time horizon. Are you reacting to a one-off deal, or does the news reflect a broader strategic shift in the company's growth algorithm? In practice, you should filter noise by focusing on how the news aligns with a company's earnings trajectory and competitive position.
Infosys Dividend And Its Effect On The Share Price
Infosys dividend policy can influence price through changes in yield and investor perception of cash flow quality. The stock often experiences near-term moves around ex-dividend dates, while long-term price is driven by earnings growth and margin resilience. If a dividend is raised or restructured, the market may reprice the stock to reflect the new yield profile. Conversely, cuts or uncertainty around sustainable payouts can pressure the shares over time.
In practical terms, investors should assess the dividend history, payout ratio, and potential future dividends in the context of earnings quality. A sustainable dividend at a reasonable payout ratio often supports a fairer multiple and steadier price action over cycles.
Infosys Quarterly Results And What They Tell Us About The Stock Price
Infosys quarterly results are a primary driver of the near-term price path. Investors should look beyond the headline numbers and examine the underlying growth trajectory: constant currency revenue growth, operating margins, and cash flow. A strong quarter with margin expansion may justify a higher multiple, while disappointing growth or rising expenses can compress valuations. Moreover, management commentary on demand environment, client concentration, and guiding factors can drive revisions to the stock price over subsequent quarters.
Related Reads
- Infosys Share Price And Market Pulse: A Retail Investor's Guide
- Infosys Share Price And Market Signals: A Retail Investor's July 24 Snapshot
Frequently Asked Questions
What drives Infosys share price?
Infosys share price is influenced by global technology demand, domestic IT sector trends, quarterly earnings, dividend policy, and currency movements.
How should investors interpret Infosys quarterly results?
Look at revenue growth, operating margins, cash flow, and guidance to gauge the trajectory rather than bottom-line numbers alone.
Does Infosys dividend affect the stock price?
Dividend announcements can influence near-term price due to yield changes; long-term impact depends on profitability and payout sustainability.
Where can I track Infosys stock price NSE?
Track the price on major Indian exchanges like NSE; price differences with BSE exist but are typically small in liquid stocks.
What practical steps can retail investors take to trade Infosys stock?
Build a watchlist, set price alerts, analyze trendlines and moving averages, and define risk-based exit strategies.
Conclusion
For the retail investor, the takeaway is simple: Infosys share price reflects a blend of fundamentals and market sentiment. The more you understand earnings momentum, dividend viability, and macro IT cycles, the more confidently you can navigate the stock's price action. Use a structured framework–watch the trends, check the quarterly results, and assess how earnings and dividends interplay with your own risk tolerance and time horizon.
Open your trading and demat account here
Reference :
1 : Google
Latest Articles
Ola Electric Share Price Momentum: ola electric share price Signals Across Four Nifty500 Stocks


Key Takeaways
- Four Nifty500 stocks showed bullish RSI uptrends on June 30, 2026, with gains over 4%.
- Balrampur chini mills stock posted the highest RSI at 57.42 and CMP Rs 554.95.
- ola electric share price momentum: ola electric stock RSI 56.63; coromandel international stock price RSI 56.48; stock price of cochin shipyard RSI 53.67 with CMPs Rs 43.76, Rs 2,005, and Rs 1,507.9 respectively.
- RSI trending up signals momentum; use it with price action and risk controls.
On June 30, 2026, four stocks from the Nifty500 segment gained over 4% in an RSI Trending Up scan, based on data from StockEdge.com. The RSI trend-up occurs when the Relative Strength Index crosses above 50 from below, a classic signal that momentum is strengthening in price action. In this cluster, the ola electric share price momentum sits alongside peers in a broader rally. The four stocks highlighted were balrampur chini mills stock, ola electric stock, coromandel international stock price, and stock price of cochin shipyard. Retail investors across India are watching these momentum signals as a possible filter for further upside, while also considering risk controls and market context.
The figures below originate from StockEdge.com’s RSI Trending Up data. A cross above 50 from below signals that buyers have regained control after a period of consolidation. In this set, the RSI values moved higher from their prior readings, suggesting strengthening upward momentum in trading sessions around June 30, 2026. The following values summarize the momentum snapshot for each stock:
| Stock | RSI | Prev RSI | CMP (Rs) |
|---|---|---|---|
| balrampur chini mills stock | 57.42 | 45.76 | Rs 554.95 |
| ola electric stock | 56.63 | 45.47 | Rs 43.76 |
| coromandel international stock price | 56.48 | 48.07 | Rs 2,005 |
| stock price of cochin shipyard | 53.67 | 42.8 | Rs 1,507.9 |
Interpreting these numbers, balrampur chini mills stock posts the highest RSI among the quartet at 57.42, followed closely by ola electric stock at 56.63 and coromandel international stock price at 56.48. The stock price of cochin shipyard sits a bit lower at 53.67. The current market prices (CMP) reflect a diverse set of market caps within the Nifty500; balrampur chini mills stock trades around Rs 554.95, ola electric stock around Rs 43.76, coromandel international stock price around Rs 2,005, and stock price of cochin shipyard around Rs 1,507.9. This distribution suggests momentum was broadly positive on that date, with strength concentrated in mid-cap to large-cap sectors represented in the quartet.
For investors tracking momentum signals, this RSI uptrend snapshot highlights a pattern: when RSI crosses above 50 from below, additional upside is not guaranteed, but momentum tends to be more favorable in the near term. The four stocks listed here demonstrate how a momentum-based screen can surface opportunities across diverse sectors like sugar, mobility, agri-chemicals, and shipbuilding. If you want deeper, institution-level research on ola electric share price and peers, Swastika’s Sarthi AI stock assistant can help you evaluate scenarios and valuations in real time.
Ola Electric Share Price: ola electric share price RSI Uptrend Across Four Nifty500 Stocks
This section focuses on the primary momentum signal and how it manifests in the four stocks. The RSI Trending Up signal is triggered when RSI crosses above the 50 threshold from a lower level, indicating rising buying pressure and a potential up-move in price. In the June 30 data, the ola electric share price is part of a cluster with robust momentum indicators: the stock recorded RSI 56.63, up from Prev RSI 45.47, with a current price around Rs 43.76. The other three stocks show similar momentum strength, reinforcing the idea that a broad sector recovery or rotation could be contributing to sustained demand in this segment. When assessing the uptrend, it’s essential to consider price action, liquidity, and macro factors that influence Indian markets as retail participation widens.
In practical terms, RSI values in the mid-50s to high-50s range (as seen with ola electric stock and its peers) suggest traders are warming to the idea of higher prices, especially when the price action confirms the cross above 50. Traders often combine RSI with moving averages, volume patterns, and fundamental context to avoid over-reliance on a single indicator. For the current moment, the four stocks that flashed the RSI Trending Up signal present a useful watchlist for momentum-focused investors to compare relative strength and potential entry points.
Stock-level Momentum Snapshot: Balrampur chini mills stock, ola electric stock, coromandel international stock price, stock price of cochin shipyard
From a stock-level perspective, the highest RSI belongs to balrampur chini mills stock at 57.42, signalling the strongest near-term momentum among the four. ola electric stock sits close behind with 56.63, while coromandel international stock price registers 56.48. The stock price of cochin shipyard is at 53.67 RSI, indicating solid momentum yet relatively softer than the other three. The corresponding CMP readings–Rs 554.95 for balrampur chini mills stock, Rs 43.76 for ola electric stock, Rs 2,005 for coromandel international stock price, and Rs 1,507.9 for stock price of cochin shipyard–provide a quick reference on where the market currently prices these momentum signals. Traders should monitor how RSI holds above 50 as the next price action unfolds, and whether price patterns corroborate the momentum in subsequent sessions.
How Retail Investors Can Use RSI Uptrend Signals With Risk Management
RSI Uptrend signals, defined by crossing above 50, are most meaningful when paired with confirmation from price action and volume. In this instance, the four stocks showed momentum uplift on a single day; sustained rallies typically require follow-through days and supportive macro conditions. Retail investors should consider setting clear entry and exit rules, such as using a moving-average cross or a stop-loss based on recent swing lows, to avoid being swept into fleeting moves. With ola electric share price and the other three stocks, you could watch for consolidation beneath nearby resistance levels and rising accumulation signals before initiating a position. Remember that the momentum signal alone is not a guarantee; a disciplined risk framework remains essential for long-term capital protection.
Frequently Asked Questions
What does RSI Trending Up indicate for momentum in these four stocks?
RSI Trending Up indicates RSI values rising above 50 from below, suggesting strengthening momentum in price action. On June 30, 2026, four Nifty500 stocks showed this pattern according to StockEdge.com data.
Which four stocks were flagged in the RSI Trending Up scan on June 30, 2026?
balrampur chini mills stock, ola electric stock, coromandel international stock price, and stock price of cochin shipyard were flagged.
What were the RSI values for each stock in the scan?
balrampur chini mills stock 57.42; ola electric stock 56.63; coromandel international stock price 56.48; stock price of cochin shipyard 53.67.
What are the current market prices (CMP) for these four stocks?
balrampur chini mills stock Rs 554.95; ola electric stock Rs 43.76; coromandel international stock price Rs 2,005; stock price of cochin shipyard Rs 1,507.9.
Where did these RSI numbers come from?
The RSI values come from StockEdge.com data as cited in the RSI Trending Up scan.
How should a retail investor use RSI Uptrend signals in practice?
RSI Uptrend signals should be used in conjunction with price action, risk management, and other indicators to build a robust entry/exit plan.
Conclusion
The momentum seen on June 30, 2026, in the RSI Trending Up cluster is a snapshot of relative strength that may indicate continued upside for a short-to-medium horizon. For retail investors, the key takeaway is not to chase momentum blindly, but to monitor which names sustain RSI above 50 and how price action confirms the move. The four stocks–balrampur chini mills stock, ola electric stock, coromandel international stock price, and stock price of cochin shipyard–showcase varied but synchronized momentum patterns, offering a practical watchlist for momentum-aware traders across India. One actionable next step is to build a watchlist, track RSI for these names, and apply a risk-managed entry plan when RSI remains above the 50 level and price action confirms a breakout from consolidation.
Kpit Technologies Share Price: 15% Circuit Shock and The Long-Term Growth Tale for kpit technologies share price
Key Takeaways
- kpit technologies share price plunged 15% on July 1, 2026 as the Q1 FY27 outlook triggered a risk-off reaction.
- Q1FY27 revenue is expected to decline around 1% YoY versus Q1FY26, with margins dipping more than revenue.
- Growth hinges on outsourcing, AI-led productivity, and client wins in the US, Korea, and India, supported by a growing pipeline.
- The order book is described as resilient and the pipeline is expanding, signaling a rebound in H2 FY27 and into FY28.
On July 1, 2026, KPIT Technologies shares faced a 15% lower circuit, a move that jolted retail investors and raised questions about the near-term risk-reward. The day’s low on the BSE was Rs 559.10 as investors digested a Q1 FY27 revenue outlook that pointed to a YoY decline of around 1% versus Q1 FY26, with margin pressure that could outpace revenue losses. For context, the kpit technologies share price swung on the announcement, highlighting the split between short-term pain and long-term opportunity. The company says fundamentals remain strong, with AI-led productivity initiatives and a growing pipeline setting the stage for FY28 and beyond.
What caused the 15% lower circuit and how it affects the kpit technologies share price
The 15% circuit reflects a reaction to the short-term revenue outlook for Q1 FY27. The outlook indicates a decline of around 1% year-on-year versus Q1 FY26, with EBITDA margin and net profit margin expected to decline sequentially by a proportionally larger extent than the drop in revenue. In practical terms, near-term price action is weak, but the core business remains structurally sound, backed by a resilient order book and a growing pipeline that supports long-term opportunities even as markets adjust to the latest fundamentals.
kpit technologies share price forecast: What the outlook implies for Q1 FY27 revenues and margins
The company reiterates a long-term growth story driven by outsourcing and automation, even as the near-term numbers look soft. The Q1 FY27 revenue outlook of a ~1% YoY decline comes with a more pronounced margin compression, setting up a scenario where investors should separate cyclic price action from chronic earnings power. Management emphasizes ongoing investments in AI-led products and solutions to capitalize on future opportunities, suggesting that the kpit technologies share price forecast may improve as efficiency gains materialize and new client relationships mature, particularly in the U.S., Korea, and India.
Understanding the kpit technologies order book and its implications for FY28
Described as resilient, the order book and the growing pipeline imply that demand remains intact despite near-term headwinds. This resilience supports the argument that the long-term framework–focused on sustainable and profitable growth for FY28 and beyond–is intact. The company points to growth in the Trucks and Off-Highway sub-vertical and expanding client acquisitions in the passenger vehicle segment as major catalysts, while the US, Korea, and India markets continue to contribute meaningfully to revenue and backlog momentum. In short, the kpit technologies order book remains a key pillar underpinning the optimistic view for the medium-to-long term.
Growth drivers, regional bets, and AI-led efficiency: The longer-term case for KPIT Technologies
Beyond the Q1 FY27 headline, analysts and investors should watch how growth drivers translate into margins over the next 6–12 months. The firm highlights Products and Solutions, and a focused push into AI-led productivity improvements as core strategic levers. Cost containment initiatives are also described as a structural tool to support margin resilience, especially in the face of near-term revenue volatility. The growth plan places a clear emphasis on outsourcing and automation to unlock efficiency gains in the U.S., Korea, and India, with renewed client acquisitions in the passenger vehicle segment signaling potential upside on a rebound in technology demand. The Covid-period trend is noted as a precedent for client behavior during times of macro stress, suggesting the current period could precede a similar rebound when conditions improve.
For retail investors, the near-term action should be weighed against the long-term trajectory. The stock price may remain volatile, but the underlying fundamentals–resilient order book, a growing pipeline, and AI-enabled productivity focus–align with a multi-year growth story. Investors who want deeper, data-driven insights can leverage Swastika’s Sarthi AI stock assistant to parse the company’s AI-driven initiatives, product lines, and client dynamics for a more nuanced view of future earnings potential.
What the near-term price action means for retail investors
While the 15% lower circuit signals caution, it also creates a potential entry point for investors who believe in the company’s long-term drive toward outsourcing efficiency and AI-enabled solutions. The price action reflects a market that is adjusting to a revenue outlook that is modestly negative in the near term but supported by a robust product portfolio and a pipeline that remains healthy. The low price point on the day–Rs 559.10–offers a reference for the range within which patient investors might evaluate a risk-balanced position, especially if the long-term growth drivers begin to translate into margin expansion in FY28 and beyond.
Frequently Asked Questions
What caused the 15% lower circuit in KPIT Technologies shares on July 1, 2026?
The lower circuit occurred as investors digested a Q1 FY27 revenue outlook showing a ~1% YoY decline versus Q1 FY26, with margins expected to decline more than revenue. The move reflected short-term price action amid concerns about margins, while the fundamentals of the business remained described as strong by the company.
What is the Q1 FY27 revenue outlook for KPIT Technologies?
Q1 FY27 revenue is expected to decline around 1% year-on-year compared with Q1 FY26. The EBITDA margin and net profit margin are expected to decline sequentially by a proportionately larger extent than the fall in revenue.
What are the growth drivers for KPIT Technologies in FY27 and beyond?
Growth is anchored in Products and Solutions, the Trucks and Off-Highway sub-vertical, and markets in the U.S., Korea, and India. Growth in the passenger vehicle segment with new client acquisitions is highlighted as a driver, supported by AI-led productivity and cost containment initiatives to improve margins.
What does the KPIT Technologies order book look like and why is it important?
The order book is described as resilient with a growing pipeline, forming the foundation for FY28 and beyond. This indicates sustained demand and supports the long-term outlook, even as near-term revenue and margins face headwinds.
What should a retail investor consider now regarding KPIT Technologies share price and long-term potential?
Investors should weigh near-term volatility against the company’s long-term growth story driven by outsourcing, AI-enabled productivity, and expanding client relationships. The company plans to continue investing in AI-led products and solutions, which could translate into margin improvements and growth in FY28. Monitoring the order book and pipeline will be key indicators of durable demand.
Conclusion
The near-term weakness in KPIT Tech’s stock price is a function of a temporary revenue headwind rather than a deterioration in the business model. While Q1 FY27 may show a ~1% YoY revenue decline with proportionally larger pressure on margins, the long-term story rooted in outsourcing, AI-led productivity, and strategic client expansion remains intact. Retail investors can take a two-step approach: first, assess the resilience of the order book and the pipeline as a leading indicator for FY28; second, watch for margin stabilization and incremental growth in the high-probability US, Korea, and India markets. By adopting a long-horizon perspective, investors can align with the company’s plan to sustain profitable growth and capitalize on an AI-enabled efficiency cycle that could unlock upside beyond FY27.

Sanctum Wealth Portfolio: NRIs’ Three-Wallet Strategy for India Growth
Key Takeaways
- The sanctum wealth portfolio allocates 45% to equities and 28–30% to cash/debt/arbitrage for NRIs.
- A three-wallet approach–global, residence-market, and India wallets–limits currency risk and aligns with goals.
- Gold at 10–12%, private-market alternatives at 10%, and REITs/InvITs at 5% build diversification.
- Long-run earnings growth matters more than short-term currency moves; SIP flows and mutual funds are rising in India.
In a rapidly transforming India, long-run wealth creation for NRIs hinges on a disciplined, currency-smart approach that accommodates multiple needs. The sanctum wealth portfolio framework–articulated by Shiv Gupta of Sanctum Wealth–advocates a 45% allocation to equities, complemented by a 28–30% slice for cash, debt and arbitrage, 10–12% in gold, 10% in private-market alternatives, and 5% in REITs and InvITs. This multi-asset mix is designed to capture India's structural growth while managing currency risk and liquidity across time horizons.
Beyond asset allocation, the model introduces the three-wallet concept: global wallet, residence-market wallet, and India wallet. The India wallet serves a distinct purpose and should complement, not duplicate, the others. The right size for each wallet depends on goals, liabilities and long-term plans. Currency matters, but long-run earnings growth matters more when measuring returns in the investor's reference currency.
What Is The Sanctum Wealth Portfolio Allocation For NRIs?
The recommended mix includes 45% in equities, 28–30% in cash, debt and arbitrage, 10–12% in gold, 10% in private-market alternatives, and 5% in REITs and InvITs. This allocation is designed to balance growth with liquidity and risk, while letting the India wallet capture domestic opportunities without duplicating global exposure.
| Asset Class | Allocation | Notes |
|---|---|---|
| Equities | 45% | Domestic exposure with a focus on manufacturing and digitalisation themes |
| Cash, Debt & Arbitrage | 28-30% | Liquidity + hedging and risk management |
| Gold | 10-12% | Diversification & inflation hedge |
| Private-Market Alternatives | 10% | Private credit, private equity, venture capital |
| REITs & InvITs | 5% | Real estate exposure with liquidity |
If an NRI were building a fresh ₹50 crore India portfolio today, allocation would be broadly as follows: 45% in equities, 28–30% in cash, debt and arbitrage, 10–12% gold, 10% private-market alternatives, and 5% in REITs and InvITs. The same framework applies, with customization based on liabilities, time horizon and risk tolerance.
Three Wallet Strategy: Global Wallet, Residence-Market Wallet, And India Wallet
The three-wallet concept helps segregate exposures by currency and jurisdiction. The global wallet captures opportunities outside India, the residence-market wallet aligns with where you live and manage daily finance, and the India wallet targets domestic growth and savings channels. Importantly, the India wallet should complement, not duplicate, the other two wallets, and the right size for each depends on goals, liabilities and long-term plans.
Why Currency Movements Matter Less Than Long-Term Earnings Growth
While currency movements affect final returns, the long-run earnings growth of Indian assets matters more when measured in the investor's reference currency. The rupee depreciation has genuinely reduced final returns, having weakened historically in stages, averaging roughly 3–4% a year over the long run. Short-term exchange rates matter far less than the sustained earnings trajectory of Indian equities and financial assets.
India's Growth Themes And The Sanctum Wealth Portfolio
Five structural themes are central to the sanctum wealth portfolio: manufacturing, digitalisation, financialization, infrastructure and consumption. Of these, financialization and manufacturing stand out as key drivers of long-term value creation for Indian markets. Domestic consumption, household savings and local capital markets do far more of the work than they did in the past, underscoring the importance of exposure to domestic growth alongside global opportunities.
Practical Implications For A Fresh ₹50 Crore India Portfolio
Applying the same allocation is a practical approach for a fresh ₹50 crore India portfolio today. The split would be 45% in equities, 28–30% in cash, debt and arbitrage, 10–12% in gold, 10% in private-market alternatives, and 5% in REITs and InvITs. The India wallet should be sized to capture domestic opportunities without duplicating global or residence-market exposures, and currency considerations should guide how you measure returns.
Common NRI Mistakes And How To Avoid Them
Some frequent missteps include comparing returns over short periods and extrapolating currency movements, failing to update residential status with banks and intermediaries after becoming an NRI, using the wrong account (NRE vs NRO) leading to repatriation and tax frictions, and neglecting foreign tax credits which can lead to double taxation. For larger estates, succession planning across multiple jurisdictions is often omitted. Addressing these issues early can save costs and preserve wealth over generations.
Within this framework, you can bridge opportunities across wallets and currencies, ensuring a disciplined, purpose-built approach to investing in India. Swastika offers Sarthi – an AI stock assistant that gives institutional-level research on any stock or index to retail investors – to help you analyze potential ideas within the sanctum wealth portfolio framework. This can be a natural bridge between what you learned and what you might do next.
Frequently Asked Questions
What is the Sanctum Wealth Portfolio allocation for NRIs?
The suggested mix includes 45% in equities, 28-30% in cash, debt and arbitrage, 10-12% in gold, 10% in private-market alternatives, and 5% in REITs and InvITs. The India wallet should complement other wallets and the exact weights depend on goals and liabilities.
How does the three-wallet strategy work for NRIs?
It uses a global wallet for exposures outside India, a residence-market wallet for the country of residence, and an India wallet for domestic opportunities. Each wallet serves a distinct purpose and should not duplicate the others; the size of each wallet depends on goals, liabilities, and long-term plans.
Why do currency movements matter in the sanctum wealth portfolio?
Currency movements affect final returns, but long-run earnings growth matters more when measured in the investor's reference currency. The rupee depreciation has historically weakened about 3-4% a year over the long run.
What are the growth themes behind the sanctum wealth portfolio?
Five structural themes—manufacturing, digitalisation, financialization, infrastructure and consumption—are important; financialization and manufacturing stand out as particularly influential.
What common mistakes should NRIs avoid when building this portfolio?
Don’t chase short-term returns or extrapolate currency moves; ensure residential status is updated with banks, use the correct NRE vs NRO account, claim foreign tax credits, and plan cross-jurisdiction succession for larger estates.
Conclusion
The sanctum wealth portfolio approach for NRIs is built to balance growth with liquidity, by design. By separating capital into three wallets and sticking to a disciplined allocation, you can capture India’s structural drivers–while protecting against currency volatility–and align investments with long-term goals.

Cupid share price Momentum: FY27 Growth Outlook From a Diversified Healthcare Play (cupid share price)
Key Takeaways
- cupid share price rose nearly 2% to Rs 193 as the FY27 guidance was lifted.
- Q1 FY27 revenue is on track to exceed Rs 150 crore, signaling an upbeat start to FY27.
- FY27 revenue guidance was raised to more than Rs 660 crore from Rs 600 crore, a 10% uplift.
- The growth outlook rests on a diversified business model, expanding international opportunities, and progress in MC/FC and IVD and tenders.
Cupid share price momentum is back in focus as the firm lifts its FY27 guidance and signals a multi-engine growth trajectory. Q1 FY27 revenue is on track to exceed Rs 150 crore, while the full-year target is now more than Rs 660 crore, up from Rs 600 crore. The cupid share price continues to trade around Rs 193, signaling investor appetite even as the numbers support a broader story. Cupid shares rose nearly 2% to Rs 193 in the latest session, underscoring improved visibility across domestic and international markets. The breadth of Cupid's business model, expanding global opportunities and a rising operating scale across multiple verticals, is the core narrative here.
The buoyancy drivers behind this upgrade include a diversified business model, expanding opportunities in international B2B healthcare markets, and momentum in private sector procurement and government tenders across the world. A key milestone is the commencement of a long-term supply agreement with Partnership for Supply Chain Management PFSCM, Netherlands, which strengthens Cupid's position in global healthcare procurement and adds visibility to the procurement pipeline.
The company's order visibility remains robust across private markets, institutional business, and international tenders spanning multiple geographies, providing a sounding board for sustainable revenue growth. Growth areas include continued expansion in male condoms MC and female condoms FC, supported by expanded manufacturing capacity, customer additions, and a wider market reach built over the past 12 months. The IVD business is progressing; near-term growth estimates remain conservative, but there is potential to become a meaningful contributor in coming years. Tenders for IVD kits and menstrual cups across multiple states add to the longer horizon.
Aditya Kumar Halwasiya, Chairman and Managing Director, said the strong start to FY27 reflects the company's transformation over the past few years and the emergence of multiple growth engines. Cupid is witnessing strong momentum in its international B2B business, supported by expanding opportunities in private markets, institutional procurement and government tenders across the world.
The international expansion trajectory is complemented by a broadening footprint in private and government procurement across multiple geographies, which should translate into higher order visibility. This external demand synergy pairs with Cupid's internal efforts to scale manufacturing capacity and widen the distribution network, creating a multi-year growth runway rather than a single-quarter spike. Investors should watch the pace of order wins and contract signings as the primary indicators of sustained growth, while the company continues to emphasize its diversified revenue streams across MC, FC, IVD and procurement services.
For retail investors, the core takeaway remains straightforward: this is a multi-engine growth story that could extend beyond FY27. The involvement of international buyers, government procurement programs, and institutional customers strengthens the revenue visibility and reduces reliance on any single geography or vertical. A practical way to evaluate Cupid's progress is to set up a quarterly review that matches realized revenue to the updated guidance and track the expansion of its international footprint and tender pipeline. In this context, Swastika Investments' Sarthi AI stock assistant can help you interpret these dynamics with institutional-grade insights and scenario analysis.
Cupid share price momentum: Driving factors in FY27 growth
The most important drivers behind Cupid's FY27 uplift include the diversified business model across condoms MC and FC, IVD, and procurement-related services. Domestic demand remains robust, with ongoing product adoption in condom segments. International markets show momentum with B2B healthcare providers and government programs turning to Cupid for procurement advantages. The PFSCM supply agreement with the Netherlands is expected to amplify procurement scale and reliability. The multi-geography tender pipeline adds long-tail visibility, supporting sustained revenue growth beyond a single quarter.
Q1 FY27 Revenue Forecast And Its Implications
With Q1 FY27 revenue expected to top Rs 150 crore, Cupid signals that the FY27 revenue trajectory could surpass the earlier base case. Enhanced visibility across international tenders and private markets suggests faster growth as manufacturing capacity expands and the customer base broadens. This early momentum could mark an inflection point for investors following Cupid's expansion into global healthcare procurement.
FY27 Revenue Guidance Upgrade: More Than Rs 660 Crore
The revised FY27 guidance to more than Rs 660 crore represents an upgrade of at least 10% from the prior Rs 600 crore target. The increased forecast aligns with a diversified business model, an expanding global opportunity pipeline, and increasing operating scale across multiple verticals, including MC, FC, IVD and tenders. This upgrade underscores disciplined execution and a favorable demand environment across both domestic and international markets.
Global Expansion And PFSCM: A New Growth Engine
The long-term PFSCM supply agreement with Netherlands is a strategic milestone that strengthens Cupid's position in global healthcare procurement. It provides a stable procurement channel and broader access to institutional buyers and government procurement programs in multiple geographies, which should improve order visibility and revenue predictability over time.
Growth In MC, FC And IVD: Where The Revenue Might Come From
Growth in male condoms MC and female condoms FC remains a core driver of Cupid's growth story. The company has expanded manufacturing capacity and added customers, which supports higher volumes and better margins. The IVD business is progressing; near-term growth estimates remain conservative but potential exists to become a meaningful contributor in coming years. Tenders for IVD kits and menstrual cups across multiple states add to the multi-year pipeline.
Investing In Cupid: Risks, Valuation, And A Practical Approach
As with any growth play, there are risks to assess. Investors should monitor execution across manufacturing expansion, supply chain reliability, regulatory changes, and the pace of international expansion. Valuation multiples will reflect the pace and quality of execution, and investors should consider a two-to-three year horizon to capture the growth engines at work. A practical approach is to combine fundamental analysis with a watchlist that tracks quarterly performance versus the updated FY27 targets, and to avoid over-extrapolating from one quarter.
Frequently Asked Questions
What is Cupid's Q1 FY27 revenue forecast?
Q1 FY27 revenue is on track to report revenue exceeding Rs 150 crore.
What is Cupid's FY27 revenue guidance?
The FY27 revenue guidance is more than Rs 660 crore, up from Rs 600 crore.
What caused the upward revision of Cupid's revenue guidance?
A diversified business model, expanding global opportunities, and increasing operating scale across multiple verticals, including MC, FC, IVD and tenders.
What is the current cupid share price movement?
Cupid shares rose nearly 2% to Rs 193, with the cupid stock price around Rs 193 in the latest session.
What strategic partnership supports Cupid's international growth?
The long-term supply agreement with Partnership for Supply Chain Management PFSCM, Netherlands, strengthens its global healthcare procurement and order visibility.
Conclusion
Cupid's FY27 upgrade underscores a transformation across multiple growth engines, with momentum in international B2B, government tenders, and MC/FC expansion, supported by PFSCM procurement and IVD potential. Retail investors should watch for sustained revenue growth in Q1 and the trajectory toward the > Rs 660 crore FY27 target, recognizing that a diversified, capital-efficient model can produce persistent upside beyond a single quarter.
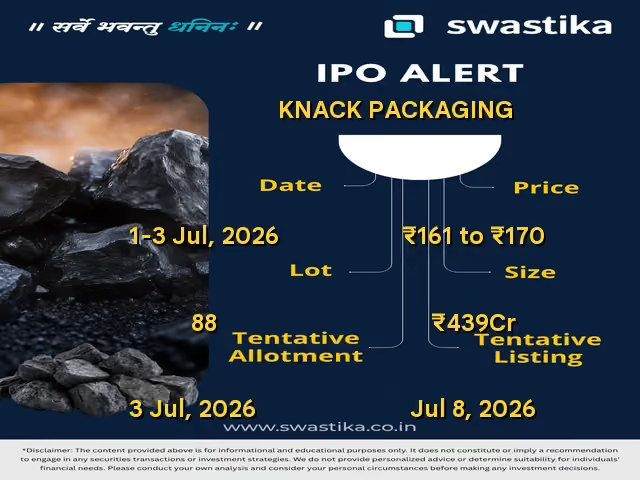
Knack Packaging IPO: Should You Apply, Avoid, or Wait for the Listing Dip?
Key Takeaways
- Price band ₹161–₹170; issue size up to ₹439 crore (2,58,52,941 shares).
- GMP data not available yet; demand signals unavailable.
- Risks: no disclosed financials or promoter details; OFS portion; lead managers not announced.
- Action: assess risk and only apply if you have capital and appetite for uncertainty; watch listing day for direction.
Knack Packaging IPO details: price band, lot size, open/close dates, and listing
ParameterDetailsIPO TypeBookbuilding IPOPrice Band₹161–₹170Lot Size88 sharesIssue Size2,58,52,941 shares (up to ₹439 Cr)Fresh Issue2,23,52,941 shares (up to ₹380 Cr)OFS35,00,000 shares (up to ₹60 Cr)Open Date1 July 2026Close Date3 July 2026Listing Date8 July 2026ExchangeBSE, NSERegistrarMUFG Intime India Pvt. Ltd.Lead ManagerTo be announcedGMPNot available yetQIB Quota77,20,587Retail Quota13
Read more About Knack Packaging IPO: Knack Packaging IPO: Complete Guide for Investors Before Applying
Knack Packaging IPO business background and promoters
Knack Packaging Limited is a packaging-focused main-board IPO. The source material confirms the size and pricing, along with the listing plan, but does not provide detailed information about promoters, business segments, or historical financial performance in the material provided. The lack of these details means readers should be cautious about assumed growth narratives until more data are disclosed by the company and market regulators.
Knack Packaging IPO subscription status and GMP signals
GMP data is not available yet, and there is no live subscription data available in the source. This absence means investors cannot gauge demand momentum or potential listing gains at this stage. Keep an eye on GMP updates and subscription traction as the window approaches close.
Knack Packaging IPO financial snapshot and valuation considerations
The source material does not provide revenue, PAT, margins, or debt figures. Without these numbers, a valuation comparison to peers or a reasonable estimate of earnings multiples or ROE is not possible here. The ₹439 crore total offer size and the ₹161–₹170 price band imply a mid-sized debut, but actual valuation will hinge on disclosed financials and post-issue capital structure.
Knack Packaging IPO risks and what could go wrong
Key risks include the absence of financial disclosures in the provided data, the lack of promoter/track record details, and the OFS portion that could dilute early investors. The absence of GMP and the fact that lead managers are not yet announced adds to execution risk. As always, cyclicality in packaging demand, and execution risk in scaling operations, are material considerations for any IPO in this sector.
Knack Packaging IPO allotment and listing timeline: what to expect
Allotment traditionally occurs after the closing date, with listing on the scheduled date of 8 July 2026. The registrar will announce allotment details and refunds; investors should monitor the exchange filings and bank accounts for credit of shares on listing day.
Frequently Asked Questions
What is the Knack Packaging IPO price band and total issue size?
The price band is ₹161–₹170 per share with an aggregate issue size of 2,58,52,941 shares (up to ₹439 crore).
When does the Knack Packaging IPO open and close, and when is listing?
Open: 1 July 2026; Close: 3 July 2026; Listing: 8 July 2026 on BSE and NSE.
Is GMP data available for Knack Packaging IPO?
GMP data is not available yet.
What are the key risks of Knack Packaging IPO?
Limited financial disclosures, undisclosed promoter details, and no GMP data; OFS portion may dilute; lead managers not announced.
Should I apply for Knack Packaging IPO at ₹161–₹170?
Given current data gaps, apply only if you have high risk tolerance and a post-listing plan; otherwise wait for more disclosure and listing performance.
Conclusion
Knack Packaging's IPO presents a mid-sized raise in a packaging-focused sector, but the lack of GMP data and essential financials makes it hard to gauge true profitability and growth potential right now. If you can tolerate this information gap and align the investment with your risk appetite, you should approach with caution and a clear post-listing plan.
Watchlist – because GMP signals are absent and key financials/promoter details are unclear, making it hard to judge valuation and demand ahead of listing.

Gold price in india: What today’s slide means for retail investors and smart strategies
Key Takeaways
- Gold price in india tumbled as the dollar strengthened and rate hike bets rose.
- MCX gold price for August expiry fell to Rs 1,40,568 per 10 grams, with silver futures price at Rs 2,20,674 per kg.
- Spot gold traded around $3,956.92/oz and spot silver around $57.13/oz, while gold price chart shows a 12.7% monthly drop.
- Investors should watch the range Rs 140,500–145,500 and the 4,100 COMEX resistance amid potential Fed hikes and Iran tensions.
Gold price in india: Reading the current range and key levels
Gold price in india faced a sharp turn as the dollar strengthened and expectations of higher interest rates grew. The price tumbled by Rs 1,800 per 10 grams, and silver slipped below Rs 2.21 lakh per kg. On mcx gold price, August expiry futures stood at Rs 1,40,568 per 10 grams, down Rs 1,834 (1.3%). September and October expiry contracts also eased, while silver futures price for Sept expiry fell Rs 1,960 per kg to Rs 2,20,674 per kg with December expiry following suit. Internationally, spot gold traded 1.5% lower at $3,956.92 per ounce, and spot silver dropped 2% to $57.13 per ounce.
Platinum price at $1,557.21 and palladium at $1,208.17 add to the diversified metals backdrop, highlighting how shifts in precious metals values can ripple across portfolios. Gold shed 12.7% so far this month and is on track for a fourth consecutive monthly decline–the biggest quarterly drop since the June quarter of 2013. Iran related tensions keep energy prices elevated and inflation fears persist, contributing to a stronger US dollar that weighs on bullion. Markets are also watching the June ADP employment report and nonfarm payrolls data this week as indicators of the pace of domestic demand.
Range to watch: Rs 140,500–145,500 on MCX; resistance around Rs 145,500 and around $4,100 on comex gold price. A sustained break beyond these levels could alter near term bias. The broader move remains influenced by expectations of three Federal Reserve rate hikes this year, with about a 64% probability of a September hike, according to CME data.
To navigate these cross-currents, investors can lean on Swastika Investmart sarthi AI stock assistant for institution grade research and to tailor a plan that fits small accounts and long term goals.
How the mcx gold price movement shapes small traders strategies
The mcx gold price trajectory shows August expiry futures at Rs 1,40,568 per 10 grams, reflecting a gentle slide from recent peaks. With the range to watch and the monthly decline, traders should consider smaller, disciplined allocations and set clear stop-loss points. The presence of a defined resistance around 145,500 and a support near 140,500 creates a corridor where traders can enter on dips and exit near the resistance, keeping risk tight while awaiting a potential breakout or consolidation.
Investors should also be mindful of the macro backdrop: stronger US dollar, possible rate hikes, and geopolitical tensions around Iran that can spark rapid moves in bullion prices.
Interpreting comex gold price signals for Indian markets
The comex gold price stands as a global barometer and is facing resistance near $4,100. A firm ceiling here implies bullion could continue to trade within a broad range unless a sustained breakout occurs. The relation to Indian markets is direct: as comex signals stall near this level, local MCX prices often reflect similar pressures, reinforcing the Rs 140,500–145,500 corridor.
Jateen Trivedi, VP Research Analyst – Commodity and Currency at LKP Securities, notes that a stronger US dollar and rate-hike expectations reduce the appeal of non-yielding assets like gold. Traders should monitor U.S. data releases and currency moves to gauge the next leg of the trend.
Silver futures price and diversification: Should you diversify away from gold?
Silver futures price on Sept expiry fell Rs 1,960 per kg to Rs 2,20,674, with December expiry also declining. While gold often anchors risk-off portfolios, silver can offer diversification if appropriate weightings exist in a calibrated asset mix. Investors should evaluate their overall risk profile and consider how silver exposure may complement gold in a broader commodity allocation.
As political and macro conditions shift, diversification remains a prudent line of defense for retail investors looking to smooth portfolio volatility and seize opportunities when bullion has rallied historically.
Gold price chart: Reading the trend and spotting entry points
The gold price chart over the recent weeks reveals a downtrend driven by dollar strength and rate-hike expectations. On the international front, gold traded around $3,956.92 per ounce and silver around $57.13 per ounce, underscoring a risk-off environment. In India, the mcx price hovered near Rs 140k–145k and faced resistance toward Rs 145,500, supporting a cautious approach rather than aggressive bets.
For those monitoring the chart, key entry points emerge near the 140,500 level and the 145,500 ceiling, with a close eye on the comex resistance around $4,100. The development of ADP data and the upcoming nonfarm payrolls will shape the near-term momentum.
Gold price forecast: what professionals expect in the coming quarter
Analysts expect three Federal Reserve rate hikes this year, with about a 64% probability of a September increase, which is supportive of the dollar and a headwind for bullion. Iran-related tensions and elevated energy prices can prolong inflation concerns, keeping golds fundamental support mostly negative in the near term unless rates stabilize. The foremost takeaway for investors is to prepare for continued volatility and to adjust allocations accordingly based on risk tolerance and time horizon.
Frequently Asked Questions
What is the current mcx gold price for August expiry?
Gold futures on MCX, Aug expiry, are Rs 1,40,568 per 10 grams, down Rs 1,834 (1.3%).
How much has the gold price in india fallen this month?
Gold price in india shed 12.7% so far this month.
What does the comex gold price signal mean for Indian markets?
The comex gold price faces resistance near $4,100, suggesting potential consolidation unless a breakout occurs; Indian prices on MCX mirror this range-bound dynamic between Rs 140,500 and Rs 145,500.
What are the latest silver futures price movements?
Silver futures price for Sept expiry fell Rs 1,960 per kg to Rs 2,20,674; December expiry also declined.
What should retail investors do in this environment?
Maintain a risk-managed exposure to gold, diversify with ETFs or other assets, monitor Fed actions and Iran tensions, and consider research tools like Swastika Investmart's Sarthi for tailored insights.
What range should I watch on MCX for gold price?
The range to watch is Rs 140,500–145,500 on MCX.
Conclusion
For the retail investor, the takeaway is clear: the current bullion backdrop calls for disciplined risk management, diversified exposure, and a plan that translates price signals into actionable steps. The environment favors careful, methodical moves rather than bold bets, with a defined range guiding entries and exits in mcx gold price and associated assets.
Next steps: build a simple framework–watch the MCX range of Rs 140,500–145,500 and the COMEX resistance near 4,100, track Fed communications and Iran developments, and use Sarthi for continuous, data-driven insights to refine your strategy over time.
Big Budget


Popular Articles





.avif)
.avif)

.avif)



START YOUR INVESTMENT JOURNEY
Get personalized advice from our experts
- Dedicated RM Support
- Smooth and Fast Trading App
