
Advit Jewels IPO Allotment: A Retail Investor's Guide to advit jewels ipo allotment, Oversubscription, GMP and Listing


Key Takeaways
- Advit Jewels IPO allotment signals strong demand with 213x oversubscription.
- Bids exceed the offer size by about 178 crore shares against 83.79 lakh offered at Rs 130-138.
- Final allotment is due on June 30 with refunds for non allotments and July 1 listing on BSE and NSE.
- GMP today at Rs 49 suggests a potential listing near Rs 187, but GMP is speculative and not official data.
What happens when demand for a Jaipur jeweller's IPO shoots up to 213 times oversubscribed? For advit jewels ipo allotment, the numbers signal a rare, potentially portfolio shaping event for retail investors across India.
Oversubscription soared as bids flooded in for the mainboard issue; the offer was oversubscribed by about 213 times with bids for over 178 crore shares against 83.79 lakh offered. The price band is Rs 130-138 per share. The bookbuilding issue was worth Rs 165.16 crore and comprised a fresh issue of 1.20 crore shares.
Allotment status finalised on Monday, June 29; successful applicants will receive shares in their demat accounts on June 30; refunds to investors who did not receive allotment will also be processed on the same day. Shares will list on both BSE and NSE on Wednesday, July 1. The symbol on NSE is RAMBHAJO. Advit Jewels is Jaipur based and specializes in premium handcrafted jewellery under the Rambhajo label, known for Kundan, Polki, diamond and embellished pieces that blend traditional with modern design.
The mainboard issue oversubscribed 212.63 times on the third and final day; it received bids for 1,78,16,52,000 shares against 83,79,300 offered. This 165.16 crore bookbuilding issue includes 1.20 crore fresh shares. The price band Rs 130-138 per share implies a potential listing price near Rs 187 per share if the upper band is realized. Note that GMP is not official data and is based on market speculation.
Advit Jewels GMP today stands at Rs 49 on June 29. This indicates a listing price around Rs 187 per share at the upper end of the price band, representing a premium of roughly 35.51 percent. However, GMP is a speculative indicator and can change quickly with market sentiment. The Jaipur based jeweller emphasizes premium handcrafted pieces across the Rambhajo label, combining traditional jewellery making with contemporary design to appeal to a wide range of buyers.
Company profile: Jaipur based Advit Jewels specializes in premium handcrafted jewellery with a focus on Kundan, Polki, diamond and embellished pieces under the Rambhajo label. The firm blends traditional techniques with modern design to cater to both classic and contemporary tastes.
For retail investors across India, the Advit Jewels IPO Allotment signals a potential listing with strong demand but actual allocations will depend on the final bookbuild outcome. Keep in mind that final allocation may be limited by available shares and regulatory allotment rules. This is a Jaipur based jewellery company that operates with a niche following. The path from bid to allotment to listing can be navigated with a clear understanding of the process and your shareholding rights. If you want a concise side by side view of this IPO against other opportunities, consider Swastika Investmarts Sarthi AI stock assistant which can help you compare fundamentals, valuations and risk across IPOs.
Advit Jewels IPO Allotment (advit jewels ipo allotment) Oversubscription, Allocation, Refunds, And Listing
In simple terms, the Advit Jewels IPO Allotment is a mechanism that decides who gets a share in the company after the bidding window closes. The high oversubscription numbers indicate many applicants want a share of the Rambhajo jewellery brand, but the actual allotment is constrained by the number of shares offered and the allocation policy used in bookbuilding issues. The listing date remains July 1, giving investors a short window between finalisation and trading to set expectations for price movements.
What Does the Advit Jewels IPO Allotment Mean for Retail Investors across India?
For retail investors, the Advit Jewels IPO Allotment means an opportunity to participate in a premium handcrafted jewellery brand. Oversubscription signals strong demand, which can translate into interest in listing day trading. However, the actual allotment depends on your application results and eligibility under the bid criteria. It is essential to review the red herring prospectus and to consider the risk that refunds may occur if allotment does not happen. Use this time to build a plan that includes risk management and diversification to avoid overexposure to a single issue. A practical approach is to compare this IPO with other opportunities using a stock research tool that can provide a macro view of sector performance and risk factors.
How To Check Advit Jewels IPO Allotment Status On BSE, NSE, And Bigshare
To check Advit Jewels IPO Allotment status you can use these paths. On BSE go to the IPO allotment page and select the equity type. Then choose Advit Jewels Ltd from the options and provide your application number or PAN. Complete the captcha and click search to verify your allotment status. On NSE go to Equity and SME IPO bid details, select RAMBHAJO from the company symbol dropdown, enter your PAN and application number, and press submit to view results. On Bigshare Services you should visit the IPO allotment page, pick any server, choose Advit Jewels Ltd from the company name list, enter your PAN and application or CAF number or DP Client ID, fill in the captcha, and click Search to verify.
GMP Today And What It Means For Advit Jewels IPO Allotment
The latest GMP stands at Rs 49 on June 29. This indicates a potential listing price around Rs 187 per share at the upper end of the price band, representing a premium of roughly 35.51 percent. Remember that GMP is not official data and can change quickly with market sentiment. Investors should treat GMP as a secondary indicator and cross check with official disclosures as part of their decision framework.
Advit Jewels Company Profile: Rambhajo Label And Jaipur-based Premium Jewellery Maker
Jaipur-based Advit Jewels specializes in premium handcrafted jewellery under the Rambhajo label. The firm is known for Kundan, Polki, diamond and embellished pieces that blend traditional techniques with modern design. This combination is designed to appeal to both classic and contemporary tastes, creating pieces that resonate with a broad range of customers.
Refunds And Listing: What Investors Should Expect From Advit Jewels IPO Allotment
Investors should expect refunds for those who did not receive allotment to be processed on June 30. Successful allottees will have their shares credited on the same day, and the listing is scheduled for July 1 on both BSE and NSE. It is essential for investors to monitor their demat accounts and the official exchange pages for any updates and to ensure that the shares appear in their accounts on listing day.
Frequently Asked Questions
What is the Advit Jewels IPO allotment and when will status be finalised?
The allotment status is finalised on Monday, June 29; successful applicants are expected to receive shares in their demat accounts on June 30; refunds for non allotments are also scheduled for June 30.
Where can I check Advit Jewels IPO allotment status on BSE, NSE, and Bigshare?
On BSE use the IPO allotment page for equity, select Advit Jewels Ltd from the list and enter your application number or PAN. On NSE, go to Equity and SME IPO bid details, select RAMBHAJO, and enter PAN and application number. On Bigshare, visit the IPO allotment page, pick Advit Jewels Ltd, enter PAN or CAF/DP ID, complete captcha, and search.
When will Advit Jewels list on the exchanges?
Advit Jewels will list on both BSE and NSE on Wednesday, July 1.
What is GMP today for Advit Jewels IPO and what does it imply?
GMP stands at Rs 49 as of June 29, which suggests a listing price around Rs 187 at the upper end of the price band. GMP is a speculative indicator and not official data.
What is the RAMBHAJO symbol and what does Advit Jewels do?
RAMBHAJO is the NSE symbol for Advit Jewels. The Jaipur based company specializes in premium handcrafted jewellery under the Rambhajo label, focusing on Kundan, Polki, diamond and embellished pieces.
Conclusion
Be mindful of the fact that GMP is speculative and not official data. Always review the official red herring prospectus and consult with a licensed advisor before placing bids. Remember that the listing price might differ from the upper band and that refunds may occur if you are not allotted shares. This is a sunrise of a new premium jewellery brand that can define a niche in the Indian jewellery market.
Latest Articles
%20(2).avif)
Market Closing Today 18 December 2025: Nifty, Sensex, Bank Nifty End Flat to Negative


The Indian stock market closing today on 18 December 2025 reflected a phase of consolidation after recent volatility. Benchmark indices struggled to find clear direction and ended marginally lower, as investors remained cautious ahead of upcoming global cues, interest rate expectations, and year-end positioning.
Despite intraday swings, the broader sentiment stayed neutral, indicating that markets are taking a breather rather than signaling a strong trend reversal.
Indian Stock Market Closing Snapshot: 18 December 2025
At the close of trade, benchmark indices settled slightly in the red:
- Nifty 50 closed at 25,815.55, down 0.01 percent (-3.00 points)
- BSE Sensex ended at 84,481.81, down 0.09 percent (-77.84 points)
- Bank Nifty settled at 58,912.85, down 0.02 percent (-13.90 points)
The narrow range movement suggests that traders preferred to stay light on positions, especially in large-cap stocks.
What Drove the Market Today
Cautious Global Cues
Asian markets traded mixed, while US futures remained subdued. Investors are closely tracking signals around interest rate trajectories and inflation trends in major economies. This global uncertainty capped aggressive buying in Indian equities.
Profit Booking at Higher Levels
After Nifty and Sensex hovered near record zones in recent sessions, selective profit booking was visible in heavyweight stocks. This was particularly evident in banking and FMCG names, which had seen strong runs earlier.
Range-Bound Banking Stocks
Bank Nifty underperformed marginally as private banks traded mixed and PSU banks lacked fresh triggers. Investors appeared hesitant to take fresh bets ahead of cues on credit growth and asset quality updates.
Sector-Wise Performance Overview
Banking and Financials
Banking stocks showed muted action. While select private lenders found support, overall momentum remained weak. Traders are awaiting clarity on interest margins and loan demand before making directional calls.
IT Stocks
IT shares traded cautiously as the rupee remained stable and global tech sentiment stayed mixed. With deal activity updates expected in the coming weeks, IT stocks are currently in a consolidation phase.
FMCG and Consumption
Defensive stocks provided limited support. While FMCG remains a long-term favorite due to stable earnings, near-term upside was capped due to rich valuations.
Midcap and Smallcap Stocks
Broader markets traded mixed. Stock-specific action dominated, with investors focusing more on fundamentals rather than chasing momentum.
How Today’s Closing Impacts Indian Markets
The market closing today on 18 December 2025 highlights a classic consolidation phase. Such sessions are important because they often lay the foundation for the next directional move.
From an Indian market perspective:
- The Nifty holding above the 25,800 zone indicates strength despite lack of momentum
- Sensex remaining above 84,000 reflects continued institutional confidence
- Bank Nifty’s sideways movement suggests banking stocks may need fresh triggers to lead the next rally
Historically, similar flat-to-negative sessions near highs have preceded either a gradual breakout or a healthy pullback, depending on global cues and domestic data.
Technical View and Near-Term Outlook
From a technical standpoint:
- Nifty has immediate support near 25,700, while resistance lies around 26,000
- Bank Nifty support is seen near 58,500, with resistance close to 59,500
As long as these supports hold, the broader trend remains intact. Short-term traders may continue to adopt a buy-on-dips strategy, while long-term investors can use such phases to accumulate quality stocks.
Investor Takeaway from Today’s Market Closing
For retail investors and traders, today’s market action reinforces the importance of discipline. Flat markets test patience, but they also offer opportunities to reassess portfolios, rebalance allocations, and focus on fundamentally strong companies.
SEBI-regulated market participants continue to emphasize long-term investing backed by research and risk management rather than short-term speculation.
How Swastika Investmart Helps Investors Navigate Such Markets
In sideways or uncertain markets like today, having the right research and tools makes a significant difference. Swastika Investmart, a SEBI-registered brokerage, supports investors with:
- In-depth market research and daily insights
- Advanced trading and investment platforms
- Strong customer support and investor education initiatives
- Technology-driven tools designed for both beginners and experienced traders
Whether markets trend sharply or move sideways, informed decision-making remains the key to long-term success.
FAQs
What was the Indian stock market closing today on 18 December 2025?
The market closed marginally lower, with Nifty at 25,815.55, Sensex at 84,481.81, and Bank Nifty at 58,912.85.
Why did the market trade flat today?
Markets remained range-bound due to cautious global cues, profit booking at higher levels, and lack of fresh domestic triggers.
Is a flat market a negative sign for investors?
Not necessarily. Flat markets often indicate consolidation and can provide good entry opportunities for long-term investors.
Which index underperformed today?
Bank Nifty underperformed slightly due to muted action in banking stocks.
How should investors approach such market conditions?
Investors should focus on fundamentally strong stocks, maintain diversification, and avoid impulsive trading decisions.
Conclusion
The market closing today on 18 December 2025 reflects a pause rather than panic in Indian equities. With benchmarks holding key support levels, the broader outlook remains stable, though short-term volatility cannot be ruled out.
If you want to navigate such markets with confidence, backed by research, technology, and trusted guidance, consider investing with Swastika Investmart.
Take the next step and open your trading account today:
👉 Open your Trading Account with Swastika
Smart investing begins with informed decisions and the right partner by your side.
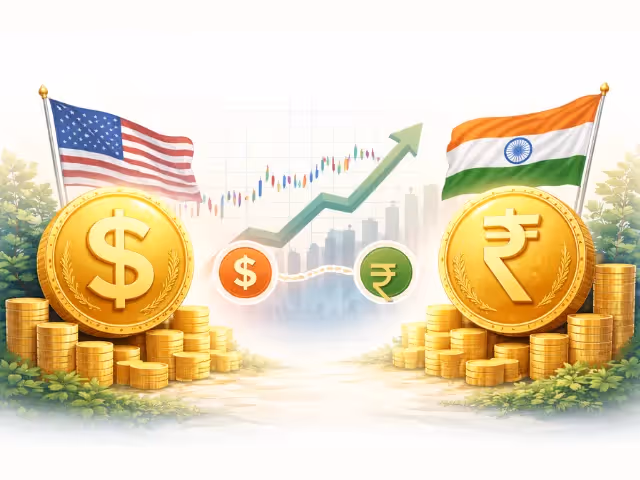
Dollar Strength, Rupee Stability, and What It Means for Indian Equities
Key Takeaways
- A strong dollar does not automatically mean weak Indian equities
- Rupee stability reflects India’s improving macro fundamentals
- Sector-wise impact matters more than headline currency moves
- Indian markets today are better positioned to absorb global shocks
Dollar Strength and Rupee Stability: A Changing Narrative
The global financial narrative often frames dollar strength as bad news for emerging markets. Historically, a rising US dollar led to capital outflows, currency depreciation, and pressure on equity markets. However, the current cycle tells a more nuanced story.
Despite phases of sustained dollar strength, the Indian rupee has remained relatively stable compared to many peer currencies. More importantly, Indian equities have continued to attract long-term interest. This shift reflects structural improvements in India’s economy and the maturity of its capital markets.
Understanding how dollar strength and rupee stability interact is key to assessing what lies ahead for Indian equities.
Why the Dollar Is Strong Right Now
Global Interest Rate Differentials
The US Federal Reserve’s higher interest rate regime has supported the dollar. Higher yields attract global capital, strengthening the currency against most others.
This dynamic is global in nature and not India-specific. Many developed and emerging market currencies have felt the impact.
Safe-Haven Demand
Periods of global uncertainty, whether driven by geopolitical risks or growth concerns, typically push investors toward safe-haven assets. The US dollar remains the preferred choice during such phases.
Why the Indian Rupee Has Remained Relatively Stable
Strong Forex Reserves
India’s robust foreign exchange reserves provide a crucial buffer. The Reserve Bank of India actively manages volatility, ensuring orderly currency movements rather than sharp swings.
This stability reassures global investors and reduces panic-driven capital flight.
Improved Macro Fundamentals
India’s current account dynamics, steady capital inflows, and resilient domestic demand contribute to rupee stability. Unlike earlier decades, India is not heavily dependent on volatile short-term capital to fund growth.
RBI’s Balanced Approach
The RBI focuses on controlling excessive volatility rather than defending a specific level. This pragmatic approach allows the rupee to adjust gradually while maintaining confidence in the financial system.
What Dollar Strength Means for Indian Equities
Not All Sectors React the Same Way
Currency movements do not impact all companies uniformly. The effect of dollar strength on Indian equities depends on revenue exposure, cost structure, and balance sheet positioning.
Export-oriented sectors often benefit, while import-dependent sectors may face pressure.
IT and Pharma: Relative Beneficiaries
Indian IT services and pharmaceutical companies earn a large portion of revenues in foreign currencies. A stable or mildly weaker rupee improves earnings visibility and margin support.
This is why such sectors often outperform during phases of global currency volatility.
Oil, Aviation, and Capital Goods
Sectors dependent on imports, particularly crude oil, may face margin pressure if dollar strength leads to higher input costs. However, rupee stability helps mitigate extreme shocks.
For Indian equities, stability matters more than absolute currency direction.
Impact on Foreign Investor Flows
FII Behaviour Has Evolved
Earlier, dollar strength often triggered aggressive FII selling in Indian equities. Today, foreign investors are more selective.
India’s growth prospects, corporate earnings visibility, and political stability often outweigh short-term currency concerns.
Domestic Investors as a Counterbalance
Strong domestic participation through mutual funds and direct equity investing has reduced market dependence on foreign flows. This has helped Indian indices remain resilient even during periods of global risk aversion.
Market Valuations and Currency Context
Valuations Are No Longer Currency-Driven Alone
Indian equity valuations are increasingly driven by earnings growth rather than currency movements. Structural themes such as manufacturing, infrastructure, and financial inclusion play a larger role.
This shift reduces sensitivity to external shocks like dollar strength.
Long-Term Perspective Matters
Short-term currency fluctuations rarely derail long-term equity returns. Investors who focus on fundamentals rather than headlines tend to navigate such phases better.
Indian Regulatory Framework and Stability
India’s capital markets operate under a strong regulatory framework guided by SEBI and RBI. Transparent disclosure norms, improved corporate governance, and robust market infrastructure support investor confidence.
This regulatory stability is one reason Indian equities continue to attract long-term capital despite global currency volatility.
How Investors Can Navigate Currency-Driven Volatility
Focus on Quality and Diversification
Instead of reacting to currency headlines, investors should focus on quality businesses with strong balance sheets and diversified revenue streams.
Diversification across sectors helps manage currency-related risks.
Avoid Overreacting to Short-Term Moves
Dollar strength cycles come and go. Overreacting often leads to missed opportunities rather than risk reduction.
A disciplined approach aligned with long-term goals remains the most effective strategy.
Swastika Investmart’s Role in Helping Investors Stay Disciplined
Understanding macro trends like dollar strength and rupee stability requires clarity, not noise. Swastika Investmart, a SEBI-registered brokerage, supports investors with:
- In-depth macro and equity research focused on Indian markets
- Technology-enabled platforms for seamless investing
- Strong customer support for timely guidance
- Investor education initiatives that simplify global market developments
This approach empowers investors to make informed decisions even during uncertain global phases.
Frequently Asked Questions
Does a strong dollar always hurt Indian equities
No. The impact depends on sector exposure, earnings growth, and domestic fundamentals rather than currency movement alone.
Why is the rupee more stable compared to other emerging markets
Strong forex reserves, prudent RBI management, and improved macro fundamentals support stability.
Which Indian sectors benefit from dollar strength
IT services, pharmaceuticals, and export-oriented companies often benefit from foreign currency earnings.
Should investors change portfolios based on currency movements
Long-term investors should avoid frequent changes and focus on fundamentals and asset allocation.
How does RBI manage currency volatility
RBI intervenes to smooth excessive volatility while allowing market-driven adjustments.
Final Thoughts
The relationship between dollar strength, rupee stability, and Indian equities is no longer one-dimensional. India’s evolving economic structure, strong regulatory framework, and rising domestic participation have changed the equation.
For investors seeking clarity, discipline, and research-backed insights in this environment, Swastika Investmart offers a reliable platform to navigate both global and domestic market trends.
Invest with perspective, not panic.

Corrections Without Panic: How Indian Investors Have Matured
Key Takeaways
- Indian markets now handle corrections with far less panic than in the past
- SIP inflows, investor education, and regulatory strength have improved behaviour
- Domestic investors are increasingly countering FII volatility
- Long-term investing discipline is shaping a more resilient market
A New Face of Market Corrections in India
Market corrections are not new. What has changed is how Indian investors respond to them. The theme of corrections without panic has become increasingly visible in recent years. Instead of rushing to exit positions at the first sign of volatility, investors are choosing patience, discipline, and long-term thinking.
Even during sharp global events such as aggressive interest rate hikes, geopolitical tensions, or sudden FII selling, Indian markets have shown relative stability. Corrections still happen, but the fear-driven selling that once defined downturns is noticeably lower.
This shift reflects a deeper maturity in India’s investing ecosystem.
How Investor Behaviour Has Evolved
From Fear-Driven to Goal-Oriented Investing
Earlier market cycles were marked by retail panic. Small corrections often triggered heavy selling, locking in losses and missing recoveries. Today, many investors invest with defined goals such as retirement, children’s education, or wealth creation.
Goal-based investing has reduced emotional decision-making. When markets correct, investors now see it as a phase rather than a failure.
The Role of SIP Culture
Systematic Investment Plans have fundamentally changed how Indian investors participate in equities. Monthly SIP inflows continue even during market corrections, providing stability and consistent demand.
This steady flow of domestic money often cushions declines caused by foreign investor selling. It also reinforces the mindset that corrections are opportunities rather than threats.
Domestic Investors as a Market Anchor
Rising Influence of Retail and Domestic Institutions
One of the most important shifts in recent years is the growing influence of domestic investors. Mutual funds, insurance companies, and retail participants now play a larger role in market direction.
When FIIs reduce exposure due to global concerns, domestic flows frequently absorb the impact. This has reduced volatility and limited sharp drawdowns.
Real-World Market Examples
During recent global sell-offs, Indian benchmark indices corrected but recovered faster compared to earlier decades. Strong domestic demand, stable banking systems, and ongoing infrastructure spending helped restore confidence quickly.
This resilience reflects a market supported not just by global capital, but by domestic belief.
Regulatory Strength and Investor Confidence
SEBI’s Role in Building Trust
India’s capital markets are regulated by SEBI, which has consistently strengthened disclosure norms, corporate governance standards, and investor protection mechanisms.
Measures such as tighter mutual fund regulations, improved transparency, and risk disclosure norms have made investors more informed and confident.
Education and Digital Access
Digital platforms, simplified KYC processes, and easy access to research have democratized investing. Investors today can track portfolios, understand risks, and access quality insights in real time.
This accessibility reduces uncertainty, which is often the root cause of panic selling.
Corrections Are Now Seen as Part of the Journey
Valuations Adjust, Not Stories End
Corrections help markets cool excesses and reset valuations. Mature investors understand that temporary price declines do not necessarily mean long-term business deterioration.
Instead of exiting completely, many investors now rebalance portfolios, add quality stocks, or increase SIP contributions during downturns.
Long-Term Thinking Dominates
The shift toward long-term investing has reduced speculative behaviour. Investors are more aware of compounding benefits and the cost of missing market recoveries.
This mindset change is one of the strongest indicators of maturity in Indian markets.
What This Means for Indian Markets Going Forward
Reduced Fragility, Not No Volatility
Market maturity does not eliminate volatility. It reduces fragility. Corrections will continue, but extreme panic reactions are less likely when investors are informed and disciplined.
This stability makes Indian markets more attractive to long-term global investors as well.
Better Quality Participation
With more investors focusing on fundamentals, quality companies tend to attract long-term capital. This improves market depth and supports sustainable growth.
How Swastika Investmart Supports Disciplined Investing
In a maturing market, the right guidance matters. Swastika Investmart, a SEBI-registered brokerage, supports investors through:
- Research-driven insights focused on Indian fundamentals
- Technology-enabled platforms for seamless portfolio tracking
- Dedicated customer support for timely assistance
- Investor education initiatives that promote long-term discipline
Such an ecosystem helps investors stay calm during corrections and focused on goals rather than noise.
Frequently Asked Questions
Why are Indian investors less panicked during corrections today
Improved financial literacy, SIP discipline, and long-term goal-based investing have reduced emotional reactions.
Do market corrections still present risks
Yes. Corrections involve volatility, but informed investors manage risk through diversification and asset allocation.
How do domestic investors impact market stability
Consistent domestic inflows often offset foreign selling, reducing sharp market swings.
Are SIPs effective during market corrections
SIPs help average costs and maintain discipline, making them effective during volatile phases.
What role does regulation play in investor maturity
Strong SEBI regulations improve transparency and trust, encouraging long-term participation.
Final Thoughts
The era of corrections without panic reflects how far Indian investors have come. Experience, education, and regulatory strength have transformed market behaviour from fear-driven to fundamentally sound.
For investors seeking a structured, research-backed approach in this evolving landscape, Swastika Investmart offers the right balance of technology, insight, and support.
Invest with discipline and clarity.

Crypto vs Equity Markets: Why Crypto Falls Faster in Risk-Off Phases
Key Takeaways
- Crypto markets react faster and more sharply during risk-off phases than equities
- Lack of intrinsic cash flows makes crypto more sentiment-driven
- Equity markets benefit from regulation, institutional participation, and valuation anchors
- Indian investors should understand volatility differences before allocating capital
Understanding Risk-Off Phases in Financial Markets
Risk-off phases occur when investors reduce exposure to risky assets and move capital toward safer options such as cash, bonds, gold, or defensive equities. These phases are typically triggered by global uncertainty such as rising interest rates, geopolitical tensions, recession fears, or liquidity tightening by central banks.
During such periods, all risky assets correct. However, the speed and depth of correction differ significantly across asset classes. This is where the contrast between crypto vs equity markets becomes most visible.
Why Crypto Falls Faster Than Equities
Absence of Fundamental Valuation Anchors
Equity markets are supported by tangible fundamentals such as earnings, dividends, cash flows, and balance sheets. Even during sharp corrections, long-term investors can assess valuations using metrics like price-to-earnings ratios or book value.
Cryptocurrencies, on the other hand, largely lack intrinsic valuation benchmarks. Prices are driven by demand, sentiment, network activity, and speculative positioning. When fear dominates, there is no fundamental floor to slow down selling.
This is a key reason why crypto prices tend to collapse faster during risk-off phases.
Higher Retail Participation and Leverage
Crypto markets have a higher proportion of retail traders compared to equity markets. Retail participation often comes with higher emotional decision-making and aggressive use of leverage.
When prices start falling:
- Margin calls accelerate selling
- Stop-losses trigger rapid liquidation
- Panic spreads faster through social media
In contrast, equity markets include long-term institutional investors such as mutual funds, pension funds, and insurance companies who tend to rebalance rather than exit completely.
24x7 Trading Amplifies Volatility
Unlike equity markets, which operate during fixed trading hours, crypto markets trade round the clock. This means price reactions to global events are instant.
For example, during global risk-off events like aggressive US Federal Reserve tightening, cryptocurrencies often drop sharply overnight, while equity markets react more gradually during trading hours.
This continuous trading structure magnifies volatility and downside momentum.
Liquidity Dynamics in Crypto vs Equity Markets
Thin Liquidity During Stress
Liquidity dries up quickly in crypto markets during stress periods. When buyers step back, even modest sell orders can lead to steep price declines.
Equity markets, especially large-cap stocks in India, benefit from deeper liquidity pools, market makers, and regulatory safeguards such as circuit breakers.
This structural difference explains why equity corrections are often more orderly compared to crypto crashes.
Institutional Exit Happens Faster in Crypto
While institutional participation in crypto has increased, it is still opportunistic rather than structural. When risk appetite declines, institutions are quicker to reduce crypto exposure as it is classified as a high-risk asset.
In equities, institutions often rotate from cyclicals to defensives instead of exiting the market entirely.
Indian Market Context: Crypto vs Equities
Regulatory Clarity Favors Equities
In India, equity markets are regulated by SEBI, offering transparency, investor protection, and strict disclosure norms. This regulatory framework builds long-term confidence and stability.
Cryptocurrencies, while legal to trade, operate in a regulatory grey zone. Taxation rules are clear, but investor protection mechanisms remain limited. This uncertainty increases downside risk during volatile phases.
Impact on Indian Investors
Indian investors often enter crypto markets during bull phases driven by global rallies. However, during risk-off cycles, sharp drawdowns test risk tolerance.
Equity investors, particularly those invested through mutual funds or diversified portfolios, experience relatively smoother corrections. Domestic institutional flows also help cushion equity market declines in India.
Real-World Example of Risk-Off Behavior
During global tightening cycles, cryptocurrencies have witnessed drawdowns exceeding 50 percent in short periods. Equity markets also corrected but recovered faster as earnings growth and domestic factors provided support.
Indian benchmark indices historically show resilience due to strong domestic consumption, government capex, and financial sector strength. Crypto assets do not benefit from such structural tailwinds.
Should Indian Investors Avoid Crypto Completely
Not necessarily. Crypto can be viewed as a high-risk satellite allocation rather than a core investment. Position sizing and risk management are crucial.
Equities, especially Indian equities, remain better suited for long-term wealth creation due to:
- Earnings visibility
- Regulatory oversight
- Corporate governance standards
- Compounding through dividends and growth
How Disciplined Platforms Help During Volatility
Market volatility highlights the importance of research-driven investing. Platforms that emphasize investor education, structured research, and risk management help investors avoid impulsive decisions.
SEBI-registered brokerage firms with strong analytics and advisory frameworks enable investors to focus on long-term strategies rather than short-term noise.
Frequently Asked Questions
Why does crypto crash harder than equities during risk-off phases
Crypto lacks fundamental valuation anchors and has higher speculative participation, leading to sharper sell-offs during market stress.
Are equities safer than crypto
Equities are relatively less volatile and benefit from regulation, earnings support, and institutional participation, making them more suitable for long-term investors.
Can crypto recover faster after crashes
Crypto often sees sharp rebounds, but recoveries are unpredictable and heavily sentiment-driven.
How should Indian investors allocate between crypto and equities
Equities should form the core portfolio, while crypto exposure should be limited and aligned with risk tolerance.
Does regulation impact volatility
Yes. Strong regulation in equity markets reduces systemic risk and improves investor confidence during volatile periods.
Final Thoughts
The debate around crypto vs equity markets becomes most relevant during risk-off phases. Crypto assets fall faster due to structural volatility, speculative participation, and limited valuation support. Equities, particularly in India, offer relatively better downside protection and long-term compounding potential.
For investors seeking stability, transparency, and research-backed insights, Indian equity markets remain a stronger foundation.
Swastika Investmart, a SEBI-registered brokerage, supports investors with robust research tools, technology-driven platforms, dedicated customer support, and ongoing investor education. This approach helps investors navigate volatile phases with discipline and confidence.
Take a structured approach to investing.

Bank of Japan Rate Decision: Why It Matters for Indian Markets
Key Takeaways
- The Bank of Japan rate decision influences global liquidity and currency movements.
- Changes in Japan’s policy can impact FII flows into Indian equities and debt.
- A stronger yen or tighter Japanese policy may pressure emerging markets like India.
- Indian investors should track global central banks, not just the RBI, for portfolio strategy.
Understanding the Bank of Japan Rate Decision
The Bank of Japan rate decision may appear distant for Indian investors, but its ripple effects are very real. Japan is the world’s third-largest economy and one of the biggest sources of global liquidity. For years, the Bank of Japan followed ultra-loose monetary policies, keeping interest rates near zero or negative to stimulate growth.
Whenever the Bank of Japan tweaks its interest rates or signals a shift in stance, global markets pay close attention. This is because Japanese investors, institutions, and funds are deeply intertwined with global capital markets, including India.
In today’s interconnected financial system, central bank decisions do not remain confined within borders. What happens in Tokyo often finds its way to Dalal Street.
Why the Bank of Japan Matters Globally
Japan’s Role in Global Liquidity
Japan has historically been a low-interest-rate economy. This encouraged global investors to borrow cheaply in yen and invest in higher-yielding assets elsewhere, a strategy known as the carry trade.
When the Bank of Japan keeps rates low, money flows into emerging markets such as India, Indonesia, and Brazil. When it signals tightening or rate hikes, that flow can reverse.
Yen Movement and Risk Appetite
The yen is often considered a safe-haven currency. A shift in the Bank of Japan rate decision can strengthen the yen, reducing risk appetite globally. This impacts equity markets, commodities, and currencies across Asia.
Direct Impact on Indian Markets
Effect on FII and FPI Flows
Foreign Institutional Investors play a crucial role in Indian equities and debt markets. A tighter policy stance from the Bank of Japan can lead to:
- Reduced FII inflows into Indian equities
- Higher volatility in large-cap stocks with global exposure
- Temporary pressure on benchmark indices like Nifty 50 and Sensex
For example, during periods when global central banks hinted at policy normalization, Indian markets often witnessed short-term corrections driven by FII selling.
Impact on the Indian Rupee
Currency markets react swiftly to global rate changes. If the Bank of Japan rate decision leads to a stronger yen and stronger US dollar, the Indian rupee may face depreciation pressure.
A weaker rupee affects:
- Import-heavy sectors like oil and aviation
- Inflation expectations
- RBI’s monetary policy stance
The Reserve Bank of India closely monitors such global developments while framing its own policy decisions.
Sector-Wise Impact on Indian Stocks
Banking and Financial Services
Indian banks may not be directly exposed to Japan, but global risk sentiment affects valuations. Increased volatility often leads investors to prefer safer assets, impacting financial stocks in the short term.
IT and Export-Oriented Companies
A weaker rupee triggered by global currency shifts can benefit IT services and export-driven companies. Revenues earned in dollars or yen translate into higher rupee earnings, improving margins.
Metals and Commodities
Japan is a major consumer of commodities. Changes in its economic outlook can impact global commodity prices, which in turn affect Indian metal stocks and infrastructure companies.
How Indian Regulators and Policymakers Respond
Indian markets operate under a robust regulatory framework guided by SEBI and RBI. While SEBI ensures market stability and transparency, the RBI balances inflation, growth, and currency stability.
Global cues such as the Bank of Japan rate decision influence:
- RBI’s liquidity management
- Bond yields in Indian debt markets
- Policy communication to maintain investor confidence
India’s strong forex reserves act as a buffer during periods of global uncertainty, helping absorb external shocks.
What Should Indian Investors Do
Focus on Asset Allocation
Instead of reacting emotionally to global news, investors should revisit asset allocation. Equity, debt, and gold allocation should align with risk tolerance and long-term goals.
Avoid Short-Term Panic
Global central bank decisions often lead to short-term volatility but do not necessarily change India’s long-term growth story. Domestic consumption, infrastructure spending, and manufacturing continue to remain strong drivers.
Use Research-Backed Platforms
Having access to reliable research, timely insights, and expert guidance becomes critical during volatile phases. SEBI-registered brokers with strong research ecosystems help investors make informed decisions rather than speculative bets.
How Swastika Investmart Adds Value in Such Phases
Navigating global events like the Bank of Japan rate decision requires clarity, not noise. Swastika Investmart stands out through:
- SEBI-registered credibility and compliance-driven processes
- Strong equity and macro research focused on Indian markets
- Tech-enabled trading platforms for seamless investing
- Dedicated customer support for timely assistance
- Investor education initiatives that simplify complex global events
Such strengths help investors stay disciplined even when global headlines create uncertainty.
Frequently Asked Questions
Why does the Bank of Japan rate decision affect Indian markets?
Because it influences global liquidity, currency movements, and foreign investor flows, which directly impact Indian equities and bonds.
Does a Bank of Japan rate hike harm Indian stocks?
Not always. It may cause short-term volatility, but long-term market direction depends on India’s domestic fundamentals.
Which Indian sectors are most impacted?
IT, banking, metals, and export-oriented sectors tend to react more to global monetary shifts.
Should retail investors track global central banks?
Yes. While RBI decisions matter most, global central banks shape overall market sentiment and capital flows.
How can investors manage volatility from global events?
By maintaining diversified portfolios, focusing on quality stocks, and relying on research-driven insights.
Final Thoughts
The Bank of Japan rate decision may be announced thousands of kilometers away, but its influence can be felt across Indian markets. Understanding these global linkages empowers investors to stay prepared rather than reactive.
For investors seeking disciplined strategies, reliable research, and a trusted SEBI-registered partner, Swastika Investmart provides the tools and support needed to navigate both global and domestic market cycles.
Ready to invest with confidence?

Why Start Trading in 2026 and Trading Opportunities in India 2026
India’s stock market is no longer just a long-term investment destination. It has evolved into a dynamic trading ecosystem powered by economic growth, policy reforms, technology, and global capital flows. As 2026 approaches, many investors and professionals are evaluating whether this is the right time to actively participate in trading.
The answer, based on economic indicators and market structure, points strongly in favor. Understanding why start trading in 2026 and identifying the trading opportunities in India in 2026 can help you enter the markets with clarity rather than speculation.
India’s GDP Growth and Economic Momentum
India continues to remain one of the fastest-growing major economies globally. With sustained GDP growth supported by domestic consumption, manufacturing expansion, and infrastructure investment, corporate earnings are expected to stay resilient.
Government-led capital expenditure on roads, railways, ports, and digital infrastructure creates a ripple effect across sectors. For traders, this economic momentum translates into higher market participation, improved liquidity, and consistent price movements across indices and stocks.
A growing economy also attracts long-term institutional money, which adds depth and stability to the markets while creating short-term trading opportunities.
Political Stability and Market-Friendly Policies
One of the strongest reasons to start trading in 2026 is India’s policy continuity. Stable governance and a clear economic roadmap reduce uncertainty, which markets value highly.
Regulatory bodies like SEBI have strengthened market integrity through tighter disclosure norms, improved risk management systems, and enhanced investor protection. Faster settlement cycles and stricter margin rules have reduced systemic risks, making trading safer for retail participants.
Such reforms create a balanced environment where opportunities exist without excessive volatility driven by speculation alone.
India’s Global Relations and Geopolitical Advantage
Global geopolitical shifts are reshaping capital flows. As multinational companies diversify supply chains, India is emerging as a strategic alternative to traditional manufacturing hubs. Strong diplomatic relations with the US, Europe, Middle East, and Asia-Pacific regions support trade growth and foreign investment.
Foreign institutional investors play a crucial role in Indian markets. Their participation often drives trends, volumes, and volatility, all of which are essential for active trading strategies.
In 2026, India’s positioning as a trusted global partner enhances market sentiment and supports long-term bullishness with intermittent short-term opportunities.
Technology-Led Evolution of Trading in India
Trading in India has become increasingly technology-driven. Advanced charting tools, real-time data, mobile trading apps, and AI-supported research are now easily accessible to retail traders.
This technological evolution lowers entry barriers and allows individuals to make informed decisions. However, tools are effective only when combined with reliable research and education. Platforms that focus on trader awareness, strategy-building, and risk management stand out in this environment.
By 2026, tech-enabled trading is expected to become even more seamless, offering faster execution and deeper insights.
Key Trading Opportunities in India 2026
Several sectors and themes are expected to offer strong trading opportunities in India in 2026.
Infrastructure and capital goods companies benefit from sustained government spending. Banking and financial services are supported by credit growth and improving asset quality. Renewable energy and electric mobility align with India’s sustainability goals and global commitments.
Additionally, mid-cap and small-cap stocks may offer higher volatility and momentum-based opportunities, provided traders approach them with proper risk controls.
Index-based trading through Nifty and Bank Nifty remains popular due to liquidity and transparency, making them suitable for both beginners and experienced traders.
Why New Traders Can Benefit in 2026
Starting trading in 2026 allows beginners to learn in a relatively mature and regulated market. Increased focus on investor education, better compliance standards, and access to professional research reduce the chances of costly mistakes.
A young professional or entrepreneur who starts trading alongside long-term investing can develop market discipline, improve financial literacy, and gradually build capital over time.
The key lies in starting with realistic expectations, controlled risk, and continuous learning.
The Role of the Right Trading Partner
While market conditions matter, choosing the right broker is equally important. A SEBI-registered brokerage with strong research capabilities, advanced trading tools, and responsive customer support can significantly enhance the trading experience.
Swastika Investmart brings together research-driven insights, technology-enabled platforms, and investor education initiatives. Its focus on transparency, compliance, and client support helps traders navigate market cycles with confidence.
From beginner guidance to advanced trading strategies, having a reliable partner ensures consistency and trust.
👉 Open your trading account today
Frequently Asked Questions
Is 2026 a good year to start trading in India?
Yes. Strong economic growth, regulatory stability, and evolving market structure make 2026 a favorable entry point.
What trading segments are suitable for beginners?
Equity cash and index derivatives are often preferred due to liquidity and availability of research.
How much capital is required to start trading?
Trading can be started with modest capital, provided risk management and position sizing are followed.
Are Indian markets well regulated for traders?
Indian markets are regulated by SEBI, ensuring transparency, investor protection, and fair practices.
Conclusion: Begin Your Trading Journey with Confidence
The combination of economic growth, political stability, global relevance, and technology-driven access makes 2026 a compelling year to start trading. For those willing to approach markets with discipline and learning, trading opportunities in India in 2026 are both diverse and rewarding.
If you are planning to take your first step or upgrade your trading setup, consider partnering with Swastika Investmart. With strong research, tech-enabled investing tools, and dedicated customer support, it offers a solid foundation for your trading journey.
Big Budget


Popular Articles


.avif)
.avif)

.avif)


START YOUR INVESTMENT JOURNEY
Get personalized advice from our experts
- Dedicated RM Support
- Smooth and Fast Trading App
