


IBJA Gold Price Trends: 24K Rates, 20-Day Decline, And What It Means For Indian Investors


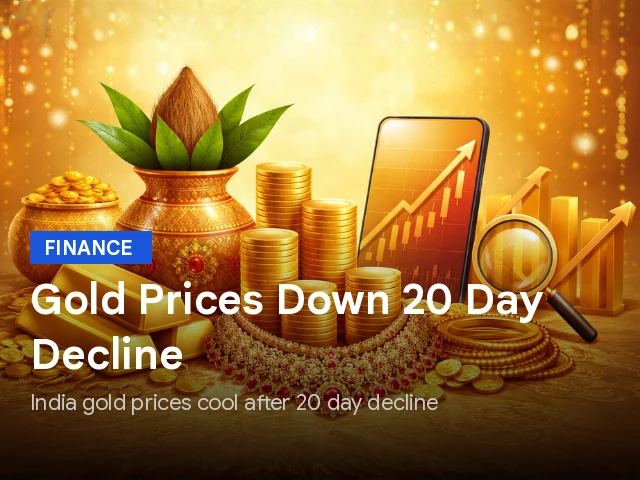

Key Takeaways
- Gold prices fell by Rs 2,755 per 10g and silver by Rs 12,256 per kg over the last 20 days, signaling a shift in investor sentiment.
- On 6 July 2026, 24K gold was Rs 145,512 per 10g; by 24 July 2026 it was Rs 142,757 per 10g, a decline of Rs 2,755.
- Other karats show different prices: 23K Rs 142,185, 22K Rs 130,765, 18K Rs 107,068, and 14K Rs 83,513 per 10g on 24 July 2026.
- Macro factors like inflation, a rising dollar index, and higher rate-hike expectations weighed on gold, while some investors favored USD.
Gold markets in India have cooled after a robust run, with the ibja gold price showing a clear 20-day decline. In early July, the 24K rate stood at Rs 145,512 per 10 grams; by 24 July 2026, it had slipped to Rs 142,757 per 10 grams–a drop of Rs 2,755. Silver followed suit, sliding Rs 12,256 per kilogram in the same window, moving from Rs 231,812 on 6 July to Rs 219,556 on 24 July. Across karats, the spread remains wide: 23K at Rs 142,185; 22K at Rs 130,765; 18K at Rs 107,068; and 14K at Rs 83,513 per 10 grams. These figures are drawn from market data tracked by the Indian bullion community and reflect a broad trend in gold pricing.
IBJA Gold Price Chart: 6 July 2026 Vs 24 July 2026
The IBJA gold price data reveals a clear downward move for the purest form (24K). The price fell from Rs 145,512 per 10g on 6 July 2026 to Rs 142,757 on 24 July 2026, a drop of Rs 2,755 per 10g (about 1.9%). This shift is consistent with the broader move in the precious metals complex during the period. Meanwhile, other karats recorded their own positions: 23K price was Rs 142,185 on 24 July 2026; 22K Rs 130,765; 18K Rs 107,068; and 14K Rs 83,513 per 10g on the same date. For full context, see the tables below.
| Karat | 6 Jul 2026 (Rs/10g) | 24 Jul 2026 (Rs/10g) | Change |
|---|---|---|---|
| 24K | 145512 | 142757 | -2755 |
| 23K | To be announced | 142185 | To be announced |
| 22K | To be announced | 130765 | To be announced |
| 18K | To be announced | 107068 | To be announced |
| 14K | To be announced | 83513 | To be announced |
Note: The data above uses 6 July 2026 and 24 July 2026 as the two reference dates. Saturday and Sunday price announcements by IBJA are not made, and investors should check official price updates on business days. This is not investment advice; consult with a financial advisor before making any decisions. For a quick, research-backed view on individual stocks or indices, you can try Swastika's Sarthi AI stock assistant: Swastika's Sarthi AI stock assistant.
Gold Price Breakdown By Karat On 24 July 2026
Beyond the pure 24K figure, investors often compare how the other karats stack up in the same snapshot. On 24 July 2026, the market showed the following prices for common karats per 10 grams: 23 Karat at Rs 142,185; 22 Karat at Rs 130,765; 18 Karat at Rs 107,068; and 14 Karat at Rs 83,513. The purity difference explains the pricing: higher purity commands a premium while other karats carry alloy-based discounts. This helps retailers and jewelers price rings, necklaces, and bullion according to customer preference and price sensitivity. For reference, these numbers are drawn directly from the same IBJA price data set used to populate the 24K figure above.
| Date | Gold Price (Rs/10g) By Karat |
|---|---|
| 24 Jul 2026 | 23K: 142,185 | 22K: 130,765 | 18K: 107,068 | 14K: 83,513 |


Silver Price Trend: 6 July 2026 To 24 July 2026
Gold is not the only metal moving in this period; silver also showed a material decline, reflecting broader bullion conditions. The 1 kg silver price moved from Rs 231,812 on 6 July 2026 to Rs 219,556 on 24 July 2026, a drop of Rs 12,256 over the 20-day window. This decline mirrors the general risk-off sentiment seen across commodities when macro indicators move unfavorably or when investors rotate into cash and USD-denominated assets. The combination of gold and silver moves underscores the importance of timing and currency dynamics in Indian retail investment decisions.
| Date | Silver Price (Rs per 1 kg) |
|---|---|
| 6 Jul 2026 | 231,812 |
| 24 Jul 2026 | 219,556 |
What Drove The 20-Day Decline In IBJA Gold Price
The period of decline coincided with a mix of macro factors that typically drive gold out of its safe-haven comfort zone. As the war in progress and geopolitical tensions continued to weigh on macro sentiment, heavy declines in gold and silver were observed. In addition, rising crude oil prices contributed to inflationary pressures, which paradoxically exerted a negative pull on gold as investors priced in a stronger dollar and higher interest-rate expectations. The dollar index strengthened, and market participants anticipated rate hikes that can raise the opportunity cost of holding non-yielding assets like bullion. Taken together, these factors helped push the ibja gold price lower during the 20-day window.
From a retail investor perspective, this means the price is sensitive to both global risk sentiment and domestic currency dynamics. War-time risk typically supports gold as a safe haven, but when inflation remains elevated and the dollar strengthens, gold’s price can drift lower in the short term. The data also show that energy prices (crude oil) are a significant driver of inflation, which in turn influences central bank policy expectations. For investors tracking daily price moves, this is exactly the kind of environment where short-term timing can be tricky, and a diversified approach may help manage risk.
Impact On Retail Investors Across India
Retail investors across India watch the ibja gold price with a blend of caution and opportunity. A rapid 20-day decline can prompt reconsideration of bullion purchases, especially for mixed portfolios that include debt, equities, and alternate assets. The price moves across karats remind buyers that premium pricing for the purest metal (24K) may be offset by cheaper, alloyed variants where taste and budget intersect. For those who hold physical bullion or plan to purchase jewelry, the current IBJA gold price data can inform a measured buy-on-dip strategy rather than a lump-sum purchase at the peak of a rally. As always, diversify and balance with other asset classes to withstand volatility and currency swings.
In India’s retail framework, investors also weigh non-physical exposures such as exchange-traded products (ETPs), gold ETFs, and sovereign gold bonds, which can offer liquidity and tax efficiency alongside price exposure. The key is to avoid knee-jerk decisions, especially in a market powered by macro narratives around inflation, energy costs, and currency strength. If you want a data-driven, AI-powered way to gauge stock and index moves alongside bullion trends, consider Swastika’s Sarthi AI stock assistant as a complementary research tool: Swastika's Sarthi AI stock assistant.
Karats And Real-World Implications: 24K Versus Other Karats
Understanding karat differences is essential for practical budgeting. The 24K price remains the benchmark for pure gold, but jewelry and coins often use 23K, 22K, or even lower karats, depending on the alloy and manufacturing costs. On 24 July 2026, 24K gold was Rs 142,757 per 10g, while 23K was Rs 142,185 per 10g, 22K Rs 130,765 per 10g, 18K Rs 107,068 per 10g, and 14K Rs 83,513 per 10g. This shows a meaningful spread between purity levels, which is particularly relevant for consumers deciding between investment-grade bullion and everyday jewelry. The conversion between karats is not linear in price because of alloy content; a small premium on 24K can translate into a larger proportion of money spent on purity in high-qualify jewelry, versus a larger net weight for a given budget with lower karats.
Practical Steps For Portfolio Management When IBJA Gold Price Moves
For investors actively tracking the ibja gold price, here are practical steps to consider in a changing environment:
- Map your portfolio’s gold exposure: Are you holding physical bullion, jewelry, or financial products like ETFs? Align exposure with your risk tolerance and time horizon.
- Adopt a measured buying or selling approach: If you’re accumulating, consider staggered entries to average into price moves rather than a single purchase at a likely peak.
- Keep an eye on macro signals: Inflation, oil prices, and the USD index often move bullion in the short term; watch central bank guidance for hints on rate trajectory.
- Use data-driven tools: Track IBJA gold price data and charts, and compare them with other market indicators to form a balanced view.
- Engage with research assistants: For deeper stock or index insights, leverage Swastika’s Sarthi AI stock assistant to augment your decision-making with institutional-grade research.
Frequently Asked Questions
What is the current ibja gold price today and how has it moved recently?
As of 24 July 2026, IBJA gold price for 24K is Rs 142,757 per 10g, down from Rs 145,512 per 10g on 6 July 2026. 23K is Rs 142,185; 22K Rs 130,765; 18K Rs 107,068; 14K Rs 83,513 per 10g. Silver price for 1 kg fell from Rs 231,812 to Rs 219,556 during the same period, a decline of Rs 12,256.
Why did gold and silver prices fall over the last 20 days?
Several macro factors weighed on the metal complex: rising crude oil prices contributing to inflation, a stronger dollar index, and expectations of higher interest rates. This combination reduced gold's appeal as a safe haven and led to a broad decline in the IBJA gold price chart in this period.
How should Indian retail investors position themselves given the current IBJA gold price trends?
Consider a measured approach: evaluate your portfolio's exposure to gold, avoid chasing rapid moves, and think in terms of a diversified asset mix that accounts for inflation and currency movements. For data-driven insights, consult IBJA price data and, if needed, use Swastika's Sarthi AI stock assistant for quick stock/index research.
What is the difference between 24K and other karat gold prices in this data set?
24K gold is the purest form and commands the highest price (Rs 142,757 per 10g on 24 July 2026) whereas 23K, 22K, 18K, and 14K gold are lower by purity and thus cheaper; for example 23K is Rs 142,185 per 10g on 24 July 2026, 22K Rs 130,765, 18K Rs 107,068, and 14K Rs 83,513 per 10g.
Where can I track the IBJA gold price today and see the IBJA gold price chart?
Use IBJA’s official price data and charts to track the current ibja gold price across karats; also compare with 6 July 2026 and 24 July 2026 figures to understand short-term moves.
Conclusion
The IBJA gold price recently moved lower across a 20-day window, driven by a complex mix of macro factors including inflation pressures, a stronger dollar index, and rising oil prices. The 24K price fell from Rs 145,512 per 10g on 6 July 2026 to Rs 142,757 per 10g on 24 July 2026, while silver dropped from Rs 231,812 to Rs 219,556 per kilogram in the same period. For Indian retail investors, this means reassessing the role of gold in your portfolio–consider diversification, cost-optimized ownership, and a disciplined approach to entry points, especially when karat-wise pricing creates mixed signals. Your next step is to adopt a defined framework: monitor IBJA price data, set clear allocation targets, and use a systematic approach to add or trim exposure as macro signals evolve.
Open your trading and demat account here
Reference :
1 : Livehindustan
Latest Articles

Economic Survey 2025–26 Signals Moderation: What 6.8–7.2% GDP Growth Means for India


Key Takeaways
- FY26 GDP growth estimated at 7.4%, FY27 projected at 6.8–7.2%
- Inflation remains under control, boosting macro stability
- Manufacturing, exports, and infrastructure show structural strength
- Financial inclusion and investor participation hit record highs
- Policy focus shifts from speed to sustainability and resilience
Understanding the Big Picture of Economic Survey 2025–26
India’s Economic Survey 2025–26 paints a picture of a fast-growing economy that is consciously choosing stability over overheating. While headline GDP growth is expected to moderate slightly in FY27 to the 6.8–7.2% range, the underlying fundamentals remain strong, diversified, and resilient.
Rather than chasing unsustainable growth, the survey highlights India’s transition into a balanced expansion phase, supported by manufacturing revival, controlled inflation, financial inclusion, and long-term capital formation.
GDP and Growth Outlook: Moderation, Not Weakness
The first advance estimates peg real GDP growth for FY26 at 7.4%, while FY27 growth is projected between 6.8% and 7.2%. This moderation reflects global uncertainties, tighter financial conditions, and cautious consumption trends, not domestic stress.
India’s potential growth rate remains close to 7%, which keeps it among the fastest-growing major economies globally. Compared to peers facing stagnation or recessionary pressures, India’s growth trajectory continues to stand out.
Inflation and Macro Stability Provide Strong Support
One of the most reassuring signals from the survey is low and stable inflation. Domestic inflation averaged 1.7% between April and December 2025, giving policymakers room to focus on growth rather than firefighting price pressures.
Low inflation improves:
- Household purchasing power
- Corporate margin visibility
- Interest rate stability
For investors, this environment supports long-term capital allocation into equities and infrastructure-linked themes.
Manufacturing Revival and the PLI Effect
Manufacturing Gross Value Added grew 7.72% in Q1 and 9.13% in Q2 of FY26, confirming a structural recovery rather than a temporary rebound.
The Production Linked Incentive framework has attracted over ₹2 lakh crore in actual investments, leading to:
- Incremental production exceeding ₹18.7 lakh crore
- Creation of more than 12.6 lakh jobs
- Strengthening of electronics, auto, pharma, and semiconductor supply chains
India’s Semiconductor Mission has also advanced, with 10 projects worth ₹1.6 lakh crore, signaling progress toward strategic self-reliance.
Exports, Services, and Global Integration
Despite global trade challenges, India’s share of global merchandise exports nearly doubled from 1% in 2005 to 1.8% in 2024.
Services exports reached a record $387.6 billion in FY25, growing 13.6%, while remittances touched $135.4 billion, keeping India the world’s largest recipient.
These numbers reflect India’s growing role as a global services hub and a stable destination for cross-border capital.
Financial Sector Strength and Rising Investor Base
Banking sector health continues to improve, with Gross NPAs falling to a multi-decade low of 2.2% by September 2025.
Retail participation in markets has surged:
- Over 12 crore unique investors
- Nearly 25% women participation
This broad-based financialisation supports long-term equity market depth and stability.
Infrastructure, Energy, and Logistics Transformation
Infrastructure expansion remains a key growth pillar:
- High-speed corridors expanded nearly ten-fold since FY14
- Over 3,500 km of railway lines added in FY26
- India ranks 3rd globally in renewable energy capacity
Power sector reforms have led to a historic turnaround, with DISCOMs reporting a positive PAT of ₹2,701 crore in FY25 for the first time.
Social Progress and Inclusive Growth
The survey highlights strong progress in social indicators:
- Over 55 crore Jan Dhan accounts
- More than 31 crore workers registered on the e-Shram portal
- Multidimensional poverty reduced sharply to 11.28%
- Expansion of IITs, IIMs, AIIMS, and international campuses
These improvements strengthen consumption resilience and human capital formation over the long term.
What This Means for Indian Markets
For investors, the survey suggests:
- No policy shocks or fiscal stress
- Continued support for capex-led sectors
- Stable backdrop for equities and long-term investing
Rather than short-term growth spikes, the focus is clearly on durable wealth creation.
FAQs
Is India’s growth slowing sharply?
No. Growth is moderating from a high base but remains among the strongest globally.
Which sectors benefit most from the survey outlook?
Manufacturing, infrastructure, renewables, banking, and services exports.
Does low inflation support equity markets?
Yes. It improves earnings visibility and supports valuation stability.
How does this impact retail investors?
Stable growth and rising financial participation create a favorable long-term environment.
Conclusion: Stability Is the New Strength
The Economic Survey 2025–26 confirms that India is moving into a phase of measured, resilient growth. Strong fundamentals, disciplined policy, and rising investor participation form a solid foundation for long-term wealth creation.
For investors seeking research-backed insights, sectoral clarity, and tech-enabled investing, Swastika Investmart, a SEBI-registered firm, offers strong research tools, investor education, and reliable customer support to navigate evolving markets confidently.
Union Budget 2026–27: Everything You Need to Know Before Budget Day
Union Budget 2026–27: Everything You Need to Know Before Budget Day
As Budget Day approaches, conversations around taxes, government spending, and economic priorities begin to dominate headlines. The Union Budget 2026–27 is no different. It arrives at a time when India’s economy remains resilient despite global uncertainty, making this Budget especially important for citizens, businesses, and investors alike.
Whether you are a salaried individual, a small business owner, or a stock market participant, understanding the Union Budget helps you make better financial decisions. Before the Finance Minister rises in Parliament on February 1, here is a clear and simple guide to everything you need to know.
Key Points to Know at a Glance
- Union Budget 2026–27 will be presented on February 1
- It outlines the government’s income, spending, and fiscal strategy
- Budget announcements influence taxes, savings, and investments
- Markets react to policy direction more than short-term headlines
- Long-term investors focus on implementation, not just announcements

What Is the Union Budget and Why It Matters
The Union Budget is the government’s annual financial blueprint. Prepared by the Ministry of Finance and presented under Article 112 of the Constitution, it details how much the government plans to earn and how it intends to spend that money during the financial year from April 1 to March 31.
In simple terms, the Budget shows the government’s priorities. Higher allocations to infrastructure, healthcare, or education signal focus areas for growth. Tax proposals affect household finances, while spending plans guide economic momentum.
For investors, the Union Budget is not just about immediate market reactions. It provides cues on fiscal discipline, reform intent, and sectoral opportunities that shape long-term returns.
When and How the Union Budget 2026–27 Will Be Presented
The Union Budget 2026–27 will be presented on February 1. In recent years, this date has allowed faster implementation of Budget measures from the beginning of the financial year.
The Budget process begins with the President’s address to a joint sitting of the Lok Sabha and Rajya Sabha. This speech outlines the government’s vision and policy agenda for the year. Following this, the Finance Minister presents the Budget in the Lok Sabha.
Once tabled, the Budget is debated in Parliament, examined by standing committees, and finally passed. This process ensures legislative scrutiny and accountability.
Revenue Budget and Capital Budget Explained Simply
The Union Budget is broadly divided into two main components.
The Revenue Budget deals with routine income and expenses. Revenue receipts include taxes such as income tax and GST, along with non-tax income like dividends and interest. Revenue expenditure covers salaries, pensions, subsidies, and welfare schemes. A shortfall here leads to a revenue deficit.
The Capital Budget focuses on long-term economic development. Capital receipts include borrowings and loan recoveries, while capital expenditure is spent on infrastructure projects such as highways, railways, ports, hospitals, and schools. This section plays a critical role in driving economic growth.
What Investors Should Watch Before Budget Day
Investors closely track the Union Budget because it often sets the tone for market trends. While sharp reactions on Budget Day are common, seasoned participants look beyond short-term volatility.
Key areas to watch include capital expenditure allocation, fiscal deficit targets, tax policy stability, and reforms linked to manufacturing, energy, and infrastructure. Announcements related to public sector undertakings, divestment, and financial sector reforms also influence market sentiment.
Historically, markets tend to reward consistency and credible execution rather than headline-grabbing announcements.
Impact of Union Budget 2026–27 on Indian Markets
The Indian stock market usually responds in two phases. The first is an immediate reaction based on expectations versus announcements. The second phase unfolds over months as policies are implemented.
A Budget that balances growth with fiscal discipline generally boosts investor confidence. Clear policy signals encourage domestic participation and attract foreign investment. Coordination between fiscal policy and monetary policy, guided by institutions like the Reserve Bank of India and SEBI, further strengthens market stability.
For retail investors, staying disciplined and aligned with long-term goals matters more than reacting to Budget Day swings.
Why the Union Budget Matters to Citizens
For households, the Union Budget has a direct impact on daily life. Changes in income tax slabs, deductions, and exemptions affect take-home income. Allocations for healthcare, education, and social welfare influence access to essential services.
For example, a salaried individual looks for clarity on tax savings, while a small business owner tracks compliance rules and credit availability. The Budget connects national policy with personal financial planning.
Interim Budget vs Full Budget Explained
In election years, the government presents an Interim Budget instead of a full Budget. An Interim Budget allows necessary spending but avoids major policy changes. Once elections conclude, the new government presents a full Union Budget.
This practice ensures continuity while respecting democratic norms.
Navigating Budget Volatility with the Right Support
Budget season can be overwhelming. Headlines move quickly, opinions differ, and market reactions can be noisy. This is where reliable research and guidance become essential.
Swastika Investmart, a SEBI registered brokerage, helps investors navigate such periods with strong research tools, timely insights, and investor education. Its tech-enabled platforms and dedicated customer support empower investors to make informed decisions rather than emotional ones.
Frequently Asked Questions
When will the Union Budget 2026–27 be presented?
The Union Budget 2026–27 will be presented on February 1.
Does the Union Budget affect stock markets?
Yes. Budget announcements influence investor sentiment, sector outlooks, and market direction.
What is the difference between Revenue and Capital Budget?
Revenue Budget covers regular income and expenses, while Capital Budget focuses on long-term investments.
Should investors change portfolios on Budget Day?
Most experts recommend focusing on long-term fundamentals rather than reacting to short-term volatility.
Why is the Union Budget important for taxpayers?
It determines tax rules, deductions, and government spending that directly affect household finances.
Final Thoughts
The Union Budget 2026–27 is more than a financial document. It is a roadmap that outlines India’s economic priorities and shapes decisions for investors, businesses, and citizens. Understanding its structure and intent helps you prepare calmly and confidently for the year ahead.
If you want to stay ahead of Budget-driven market trends with credible research and expert support, Swastika Investmart can be a valuable partner in your investment journey.

Voltas Q3 FY26 Results: Profitability Takes a Hit Despite Stable Revenue
Summary
- Voltas reported a 35.7% YoY drop in net profit in Q3 FY26
- Revenue remained largely flat, declining marginally by 1.1% YoY
- EBITDA and operating margins faced pressure due to costs and competition
- Cooling demand stayed steady, but profitability remains the key concern
- Long-term investors should track margin recovery and execution closely
Voltas Q3 FY26 Results: Profitability Takes a Hit Despite Stable Revenue
Voltas Limited, a Tata Group company and a household name in air conditioning and cooling solutions, announced its Q3 FY26 financial results, delivering a mixed performance. While revenues held steady in a challenging consumption environment, profitability weakened sharply, raising fresh questions about margin sustainability and cost pressures.
For investors tracking the consumer durables space, the Voltas Q3 FY26 results offer valuable insight into how input costs, competitive intensity, and demand trends are shaping earnings outcomes.
Key Financial Highlights of Voltas Q3 FY26 Results
Net Profit Declines Sharply
Voltas reported a net profit of ₹84.9 crore in Q3 FY26, compared with ₹132 crore in Q3 FY25, marking a 35.7% year-on-year decline.
This fall in profit reflects higher operating expenses, margin pressure in the cooling products segment, and continued investments in distribution and branding.
In real terms, this means that even with similar sales volumes, Voltas earned significantly less on every rupee of revenue during the quarter.
Revenue Remains Largely Flat
Revenue for the quarter stood at ₹3,070 crore, marginally lower than ₹3,105 crore reported in the same quarter last year.
While this 1.1% YoY dip may seem modest, it highlights the broader trend across Indian consumer durables, where demand growth has been uneven due to inflation, weather variability, and cautious discretionary spending.
For Voltas, stable revenue indicates that brand strength and dealer reach remain intact, even as pricing power faces resistance.
EBITDA and Margins Under Pressure
EBITDA for Q3 FY26 came in at ₹176.6 crore, down from ₹197 crore in Q3 FY25, translating to a 10.7% decline.
Operating margin compressed to 5.7% from 6.4%, a contraction of 70 basis points.
Margin compression was driven by:
- Higher raw material and logistics costs
- Competitive pricing in room air conditioners
- Increased promotional spending during the festive season
This trend mirrors the broader Indian manufacturing sector, where companies are prioritizing volumes over margins amid stiff competition.
Segment-Level Perspective and Market Context
Cooling Products: Volumes Stable, Margins Weak
The room air conditioner market in India continues to grow structurally, supported by rising urbanisation, electrification, and climate patterns. However, near-term pricing pressure from aggressive competitors has limited margin expansion.
Despite reasonable sales traction, Voltas had to absorb cost increases rather than pass them fully to consumers, impacting profitability.
Project Business and Execution Risks
The project business segment remains sensitive to execution timelines, cost overruns, and working capital cycles. Delays or cost escalations in infrastructure-linked projects can weigh on quarterly earnings, something investors need to monitor closely.
What Voltas Q3 FY26 Results Mean for Investors
From an investor’s perspective, the Voltas Q3 FY26 results signal a near-term earnings challenge, not a breakdown in business fundamentals.
Key takeaways include:
- Revenue stability reflects brand strength and distribution reach
- Profit decline highlights cost sensitivity and pricing pressure
- Margin recovery will be crucial for earnings re-rating
- Long-term demand drivers for cooling products remain intact
For retail investors, this quarter underscores why tracking margins, not just topline growth, is essential when evaluating consumer-focused companies.
Broader Impact on Indian Markets
The muted profitability reported by Voltas aligns with trends seen across Indian consumer durables and FMCG players in recent quarters. Rising costs, promotional intensity, and selective consumer spending have collectively impacted earnings growth.
From a regulatory standpoint, listed companies like Voltas continue to comply with SEBI disclosure norms, offering transparency and timely updates to market participants.
Such earnings outcomes often influence sectoral sentiment and can lead to short-term stock price volatility, especially around result seasons.
How Swastika Investmart Helps Investors Navigate Earnings Seasons
Understanding quarterly results requires more than headline numbers. At Swastika Investmart, SEBI-registered research teams focus on:
- Deep earnings analysis beyond surface-level metrics
- Sectoral comparisons and margin trend tracking
- Risk-aware investment strategies for volatile markets
- Tech-enabled platforms for real-time insights and execution
With strong customer support and investor education initiatives, Swastika Investmart helps investors make informed decisions rather than reactive ones during result-driven market swings.
Frequently Asked Questions
What were Voltas Q3 FY26 net profit numbers?
Voltas reported a net profit of ₹84.9 crore in Q3 FY26, down 35.7% year-on-year.
Why did Voltas margins decline in Q3 FY26?
Margins declined due to higher input costs, competitive pricing pressure, and increased promotional spending.
Did Voltas revenue grow in Q3 FY26?
Revenue remained largely flat at ₹3,070 crore, slightly lower than the previous year.
Is Voltas still a long-term growth story?
Long-term demand for cooling products remains strong, but margin recovery will be key for earnings growth.
How should investors react to Voltas Q3 FY26 results?
Investors should monitor future quarters for margin improvement and cost control rather than focusing on a single quarter.
Conclusion: Stay Informed, Stay Disciplined
The Voltas Q3 FY26 results reflect a challenging operating environment where maintaining profitability is harder than sustaining sales. While near-term pressures persist, the company’s brand strength and market presence remain valuable assets.
For investors navigating such earnings cycles, disciplined analysis and trusted research matter more than short-term noise.
Open your trading and investment account with Swastika Investmart to access expert research, smart tools, and market-ready insights tailored for Indian investors.
👉 Open your trading and investment account with Swastika Investmart

Why did silver suddenly cross ₹4 lakh?
Key Takeaways
- Silver crossed ₹4 lakh in India due to rising global fear and geopolitical tensions
- US–Iran conflict risks triggered strong safe-haven buying
- The US Fed’s tight stance and a weak dollar added momentum
- Silver is outperforming due to investor demand, supply tightness and momentum
Silver’s Sudden Spike Took Markets by Surprise
Silver prices shocked Indian markets on Thursday as they surged past the ₹4 lakh mark for the first time. The move was swift, sharp, and driven more by fear than fundamentals of jewellery demand.
On the MCX, silver prices jumped nearly 4 percent to hit an all-time high of around ₹4,00,780 per kilogram. Globally, silver climbed close to $120 per ounce, marking one of its strongest rallies in recent years.
This sudden rise left many investors asking one simple question. Why did silver move so fast, and why now?
Fear Drives Money Towards Safety
Whenever uncertainty rises, money changes behaviour. Investors stop chasing growth and start protecting capital. Historically, precious metals have played this role during periods of fear.
This rally in silver is not about festive demand or industrial expansion alone. It is about global anxiety.
Wars, geopolitical risks, and economic uncertainty push investors towards assets that hold value during turmoil. Silver, along with gold, sits at the centre of that safe-haven universe.
Rising US–Iran Tensions Lit the Spark
The immediate trigger for the surge came from escalating tensions between the US and Iran.
Reports of increased US military presence in the Middle East unsettled global markets. On top of that, former US President Donald Trump issued a strong warning to Iran, stating that refusal to engage in nuclear talks could invite far more severe military action in the future.
Markets react quickly to war risks. The possibility of conflict in a geopolitically sensitive region instantly pushed investors towards precious metals.
Silver responded with force.
The US Federal Reserve Kept Uncertainty Alive
Another major factor supporting silver prices was the stance of the US Federal Reserve.
The Fed kept interest rates unchanged, but its messaging remained cautious. Inflation continues to stay elevated, and policymakers made it clear that rate cuts will not come quickly.
High interest rates slow economic growth and keep uncertainty alive. This environment reduces confidence in risk assets and increases demand for stores of value like silver and gold.
For precious metals, uncertainty is often more powerful than rate cuts themselves.
Weak US Dollar Added Fuel to the Rally
A softer US dollar played a crucial supporting role in silver’s rise.
When the dollar weakens, precious metals become cheaper for buyers using other currencies. This improves global demand and pushes prices higher across international markets.
As the dollar slipped, silver prices gained strength both globally and in India, amplifying the rally on domestic exchanges like the MCX.
What Happened to Silver Prices Exactly?
The numbers tell the story clearly.
In India:
- MCX silver jumped around 4 percent in a single session
- Prices hit a fresh all-time high of ₹4,00,780 per kilogram
Globally:
- Silver climbed close to $120 per ounce
- Spot silver touched record levels above $119
- Silver is up more than 60 percent so far this year
This kind of move rarely happens without strong underlying fear and momentum.
Why Silver Is Moving Faster Than Gold
Silver has a unique dual personality. It is both a precious metal and an industrial metal.
Unlike gold, silver is widely used in electronics, renewable energy, electric vehicles, and advanced manufacturing. At the same time, it remains a cheaper alternative to gold for investors seeking safety.
Several factors are working together here:
- Strong investor demand as fear rises
- Tight global supply conditions
- Momentum buying as prices break records
When prices start rising quickly, traders and investors jump in, further accelerating the move.
Gold Also Joined the Rally
Gold did not stay behind.
Spot gold surged past $5,590 per ounce, extending its remarkable run. Gold is already up about 27 percent this year, after rising nearly 64 percent last year.
Gold benefits most during periods of war risk, inflation concerns, and currency weakness. The same forces lifting silver are also pushing gold to new records.
What About Other Precious Metals?
Platinum gained around 1 percent and had already touched record levels earlier this week. Palladium, however, slipped slightly as its demand outlook remains comparatively weaker.
Among all precious metals, silver clearly emerged as the strongest performer.
What This Means for Indian Markets
This rally has important implications for Indian investors.
First, it highlights how closely Indian commodity prices track global events. Second, it reinforces the role of precious metals as portfolio hedges during unstable times.
For traders, volatility remains high. For long-term investors, the move is a reminder that global risk can reshape asset prices very quickly.
Understanding these dynamics requires timely insights and disciplined execution.
How Swastika Investmart Supports Investors
Navigating volatile commodity markets is not easy without the right tools and research.
Swastika Investmart, a SEBI-registered brokerage, helps investors track global cues, commodity trends, and macro developments through robust research tools and real-time market access.
With tech-enabled trading platforms, responsive customer support, and a strong focus on investor education, Swastika Investmart enables investors to make informed decisions even during turbulent markets.
Frequently Asked Questions
Why did silver cross ₹4 lakh in India?
Silver crossed ₹4 lakh due to rising global fear triggered by US–Iran tensions, a tight US Fed stance, and a weaker dollar supporting safe-haven buying.
Is this rally driven by jewellery demand?
No, this rally is primarily driven by fear, uncertainty, and investor demand rather than jewellery consumption.
Why is silver outperforming gold?
Silver benefits from both safe-haven demand and industrial usage, along with tighter supply and momentum buying.
Can silver prices stay high from here?
As long as geopolitical tensions, policy uncertainty, and currency weakness persist, silver prices may remain elevated and volatile.
Should retail investors invest at these levels?
Investors should assess risk tolerance and consult a financial advisor before taking positions in volatile markets.
Final Takeaway
Silver crossed ₹4 lakh not because of fashion or festivals, but because fear returned to global markets.
Rising US–Iran tensions, tight monetary policy, and a weak dollar combined to push investors towards financial shelters. Gold and silver are doing exactly what they have done for centuries, protecting value when uncertainty rises.
For investors, the key is not chasing headlines, but understanding the forces behind them.
If you want to track such global market moves with clarity and confidence, consider getting started with Swastika Investmart.

CPSE ETF Mega Breakout Explained: Are PSU Stocks Entering a New Uptrend?
Key Takeaways
- CPSE ETF has broken out after nearly a year of consolidation
- Weak dollar and rising commodities are supporting PSU stocks
- Government reforms are improving PSU efficiency and profitability
- CPSE ETF offers diversified exposure to India’s top government companies
A Big Signal from the Markets
Sometimes the stock market sends quiet signals. And sometimes, it flashes a bold one. Right now, the CPSE ETF is doing the latter.
After spending almost a full year moving sideways, the CPSE ETF has delivered a decisive breakout. This is not about one PSU stock performing well. It is about an entire basket of government-owned companies showing renewed strength together.
Historically, such breakouts after long consolidation phases often mark the beginning of a broader trend. For investors tracking PSU stocks, this move deserves close attention.
What the CPSE ETF Represents
The CPSE ETF is designed to track some of India’s largest and most strategically important central public sector enterprises. These include leaders from power, energy, and financial segments such as NTPC, ONGC, PFC, and REC.
Instead of picking individual PSU stocks, the ETF allows investors to participate in the overall performance of this space through a single instrument. This diversification reduces stock-specific risk while still capturing sector-wide momentum.
The Technical Breakout Story
From a chart perspective, the CPSE ETF spent nearly a year in consolidation. Prices moved within a narrow range, frustrating short-term traders and testing the patience of long-term investors.
Such phases usually reflect uncertainty and lack of conviction. What changes the narrative is volume-backed price expansion. The recent move in CPSE ETF ticks that box.
A breakout after prolonged consolidation often suggests fresh participation from institutional investors and renewed confidence in the underlying theme.
Macro Tailwinds Supporting PSU Stocks
This breakout is not happening in isolation. Macro conditions are lining up in favour of PSU-heavy sectors.
One key factor is the weakening Dollar Index. Historically, a softer dollar benefits emerging markets like India. It also supports capital flows into sectors linked to commodities and infrastructure, where PSUs have significant exposure.
The second major driver is the global commodity upcycle. Prices of oil, metals, and energy commodities have remained firm. India’s largest commodity-linked businesses are government-owned companies. As commodity prices rise, their revenues and cash flows tend to improve, strengthening investor sentiment.
The Government Reform Angle
Perhaps the most important change is happening at the policy level.
Over the last few years, the government’s approach towards PSUs has evolved. There is a stronger focus on operational efficiency, accountability, and return on capital. Strategic disinvestment and privatisation discussions have improved discipline and transparency.
Initiatives aligned with the Atmanirbhar Bharat vision have also helped PSUs sharpen their business objectives. Many companies that were once seen as slow-moving are now reporting consistent profits, healthier balance sheets, and improved dividend payouts.
This structural shift is gradually changing how the market values PSU stocks.
Why CPSE ETF Makes Strategic Sense
For investors, the CPSE ETF offers a practical way to benefit from multiple trends at once.
It captures the commodity upcycle without betting on a single metal or energy stock. It benefits from PSU reforms without the risk of choosing the wrong company. And it aligns with India’s infrastructure and energy growth story, which remains a long-term theme.
Post-breakout, the risk-reward profile appears favourable, especially for investors with a medium to long-term horizon.
Impact on Indian Equity Markets
The renewed momentum in PSU stocks adds another layer of strength to Indian markets. When government-owned companies participate in rallies, it usually indicates broader economic confidence.
PSUs play a crucial role in power generation, fuel supply, credit flow, and infrastructure funding. Their improved performance supports economic stability and capital expenditure cycles, which eventually benefit the wider market.
Where Swastika Investmart Adds Value
Understanding thematic shifts like the CPSE ETF breakout requires more than just chart watching. It needs macro insight, sector analysis, and disciplined execution.
Swastika Investmart, a SEBI-registered brokerage, supports investors with strong research tools, sector reports, and timely market insights. Its tech-enabled platforms, responsive customer support, and focus on investor education help clients navigate opportunities like PSU revivals with confidence.
Frequently Asked Questions
What is driving the CPSE ETF breakout?
The breakout is supported by technical strength, a weakening dollar, rising commodity prices, and improved fundamentals of PSU companies.
Does this mean PSU stocks are entering a long-term uptrend?
While no trend is guaranteed, the combination of policy reforms and macro support increases the probability of sustained momentum.
Is CPSE ETF suitable for retail investors?
It can be suitable for investors seeking diversified exposure to PSU stocks, especially those aligned with commodities and infrastructure.
Which sectors dominate the CPSE ETF?
The ETF mainly includes power, energy, and financial PSUs such as NTPC, ONGC, PFC, and REC.
Should investors enter after the breakout?
Investors should evaluate risk appetite and investment horizon, and consider professional advice before taking positions.
Final Thoughts
The CPSE ETF mega breakout is more than a technical event. It reflects a deeper shift in how government-owned companies are performing and how markets are valuing them.
For investors looking to participate in India’s commodity cycle, policy reforms, and PSU revival, this space deserves attention. The key is to stay informed, disciplined, and aligned with long-term fundamentals.
If you want to explore such opportunities with research-backed insights and reliable execution, you can take the next step with Swastika Investmart.

Swiggy Q3 Results FY26: Strong Revenue Growth Meets Profitability Pressure
Summary
- Swiggy’s consolidated net loss widened to ₹1,065 crore in Q3 FY26
- Revenue from operations surged nearly 54 percent year-on-year to ₹6,148 crore
- Quick-commerce and supply chain segments drove the highest growth
- EBITDA losses increased, reflecting expansion-led cost pressures
- Markets remain focused on the timeline to sustainable profitability
Swiggy Q3 FY26 Financial Performance at a Glance
In its exchange filing dated January 29, Swiggy reported a wider consolidated net loss of ₹1,065 crore for the December 2025 quarter. This compares with a loss of ₹799 crore in the same quarter last year, although losses marginally narrowed compared to Q2 FY26 levels.
The headline positive was revenue. Revenue from operations jumped to ₹6,148 crore, up from ₹3,993 crore in Q3 FY25. This nearly 54 percent growth underscores the rising frequency of digital ordering and deeper penetration into India’s urban and semi-urban markets.
EBITDA loss for the quarter stood at ₹782 crore, compared to a loss of ₹725 crore earlier. The EBITDA margin moderated to 12.72 percent, reflecting increased spending on logistics, dark stores, rider incentives, and technology investments.
Segment-Wise Performance: Where the Growth Is Coming From
Food Delivery: Steady but Maturing
Food delivery continues to be Swiggy’s core business, generating ₹2,041 crore in revenue, with year-on-year growth of nearly 25 percent. While growth remains healthy, it is notably slower than newer segments.
This reflects a maturing urban food delivery market where customer acquisition costs are stabilising and competition remains intense. The focus here is increasingly on order frequency, subscription models, and operational efficiency rather than aggressive expansion.
Out-of-Home Consumption: A Revival Story
Revenue from out-of-home consumption grew 56 percent to ₹103 crore. This segment benefited from a strong revival in dining, events, and experiential consumption post-pandemic.
While still a small contributor to overall revenue, it provides diversification and aligns well with changing consumer behaviour, especially among younger urban Indians.
Quick-Commerce: The Growth Engine
Quick-commerce stood out, with 76 percent growth to ₹1,016 crore. This segment reflects India’s fast adoption of instant delivery for groceries, essentials, and daily-use items.
The growth comes at a cost. Dark store expansion, last-mile delivery infrastructure, and competitive pricing continue to pressure margins. However, for long-term investors, quick-commerce represents one of the most scalable digital consumption opportunities in India.
Supply Chain and Distribution: The Silent Heavyweight
The largest contributor this quarter was supply chain and distribution, generating ₹2,981 crore in revenue, also growing 76 percent year-on-year.
This highlights Swiggy’s evolution from a consumer-facing app to a deeper logistics and distribution platform. As India’s e-commerce and food ecosystems expand, this segment could play a critical role in improving unit economics over time.
Platform Innovations: Strategic but Volatile
Platform innovations saw a sharp decline in revenue to ₹9 crore. This reflects Swiggy’s recalibration of experimental initiatives, prioritising capital efficiency over aggressive diversification.
Why Losses Are Still Rising Despite Revenue Growth
For Indian investors, widening losses often raise concerns. However, in Swiggy’s case, the losses are largely strategic rather than structural.
Key cost drivers include:
- Heavy investments in quick-commerce infrastructure
- Rider and logistics expansion across Tier 2 and Tier 3 cities
- Technology, data, and AI-led optimisation initiatives
- Customer acquisition and retention spending
This mirrors the broader trend seen across India’s platform economy, where companies prioritise scale, reach, and ecosystem dominance before shifting focus to profitability.
Impact on Indian Markets and Investor Sentiment
While Swiggy is not yet listed, its performance has broader implications for:
- Valuations of listed tech and platform companies
- Sentiment around India’s digital consumption theme
- Institutional appetite for pre-IPO and private market investments
Regulatory oversight by SEBI and tighter disclosure norms have increased transparency in how such companies report financials. For retail investors, this underscores the importance of understanding business models, cash flows, and long-term scalability, not just headline growth numbers.
What Investors Should Track Going Forward
Rather than quarterly losses alone, investors should focus on:
- Improvement in contribution margins by segment
- Reduction in delivery and fulfilment costs
- Path to EBITDA breakeven in food delivery
- Capital allocation discipline in quick-commerce
This is where research-driven platforms like Swastika Investmart play a key role by helping investors decode complex business models and market narratives beyond surface-level headlines.
FAQs on Swiggy Q3 Results
Why did Swiggy’s net loss increase in Q3 FY26?
The higher loss was driven by expansion-led costs, especially in quick-commerce, logistics, and supply chain investments.
Which segment contributed the most revenue?
Supply chain and distribution emerged as the largest revenue contributor during the quarter.
Is Swiggy’s revenue growth sustainable?
Revenue growth remains strong, supported by rising digital adoption, but profitability will depend on cost optimisation and scale efficiencies.
Does Swiggy’s performance impact listed stocks?
Indirectly, yes. It influences sentiment around tech-enabled consumption, logistics, and platform-based business models in India.
What should long-term investors focus on?
Unit economics, cash burn trends, regulatory compliance, and the company’s roadmap to profitability.
Final Thoughts: Reading Beyond the Numbers
Swiggy’s Q3 FY26 results reflect the realities of building scale in India’s hyper-competitive convenience economy. Strong revenue growth confirms market demand, while widening losses highlight the cost of staying ahead in a rapidly evolving landscape.
For investors, the key is not short-term volatility but understanding how such platforms mature into sustainable businesses. Making informed decisions requires reliable research, regulatory awareness, and access to quality market insights.
If you are looking to invest with clarity and confidence, consider opening an account with Swastika Investmart, a SEBI-registered brokerage known for strong research tools, tech-enabled investing, and dedicated customer support.
Smart investing starts with informed decisions.
Big Budget


Popular Articles





.avif)
.avif)

.avif)



START YOUR INVESTMENT JOURNEY
Get personalized advice from our experts
- Dedicated RM Support
- Smooth and Fast Trading App
