


Nifty 50 Morning Market Summary – 30 Jul 2026




Key Takeaways
- Prev close reference: yesterday's close used for today's levels.
- Key level to watch: Nifty 50 pivot 24282.4 (R1 24377.7, R2 24438.25; S1 24221.85, S2 24126.55) and Bank Nifty pivot 57050.92 (R1 57333.23, R2 57518.97; S1 56865.18, S2 56582.87).
- Standout mover: INDOMIM from 485.0 to 741.75 (+52.94%).
- Market-wide Index Options PCR: Not available for this session.
Nifty 50 Support And Resistance Levels For 30 Jul 2026
Nifty Pivot Levels: Pivot 24282.4; R1 24377.7; R2 24438.25; S1 24221.85; S2 24126.55. Below or above pivot, the interpretation: pivot is central; R1 and R2 above pivot; S1 and S2 below pivot; The numbers are from the previous session's close, used as reference today.
Bank Nifty pivot levels: Pivot 57050.92; R1 57333.23; R2 57518.97; S1 56865.18; S2 56582.87. The same logic: resistance above pivot, support below pivot, with yesterday's close-based reference points.
For deeper stock-level insights, you can explore Swastika's Sarthi AI stock assistant.


Top 5 Gainers On 30 Jul 2026
| Ticker | Prev Price | Current Price | Change |
|---|---|---|---|
| INDOMIM | 485.0 | 741.75 | (+52.94%) |
| SMLMAH | 4566.0 | 5479.2 | (+20.00%) |
| GATECH | 0.49 | 0.58 | (+18.37%) |
| LCL | 425.0 | 494.6 | (+16.38%) |
| GATECHDVR | 0.44 | 0.49 | (+11.36%) |
Top 5 Losers On 30 Jul 2026
| Ticker | Prev Price | Current Price | Change |
|---|---|---|---|
| ADFFOODS | 301.8 | 262.35 | (-13.07%) |
| SERVOTECH | 92.25 | 81.83 | (-11.30%) |
| PCBL | 365.7 | 328.0 | (-10.31%) |
| THANGAMAYL | 6452.0 | 5807.0 | (-10.00%) |
| ORCHASP | 1.67 | 1.51 | (-9.58%) |
Market-Wide Index Options PCR
Market-wide Index Options PCR: Not available for this session.
Frequently Asked Questions
What are the Nifty 50 pivot levels for 30 Jul 2026?
Pivot: 24282.4; R1: 24377.7; R2: 24438.25; S1: 24221.85; S2: 24126.55.
What are the Nifty Bank pivot levels for 30 Jul 2026?
Pivot: 57050.92; R1: 57333.23; R2: 57518.97; S1: 56865.18; S2: 56582.87.
Who were the top gainers on 30 Jul 2026?
INDOMIM: 485.0 -> 741.75 (+52.94%); SMLMAH: 4566.0 -> 5479.2 (+20.00%); GATECH: 0.49 -> 0.58 (+18.37%); LCL: 425.0 -> 494.6 (+16.38%); GATECHDVR: 0.44 -> 0.49 (+11.36%).
Who were the top losers on 30 Jul 2026?
ADFFOODS: 301.8 -> 262.35 (-13.07%); SERVOTECH: 92.25 -> 81.83 (-11.30%); PCBL: 365.7 -> 328.0 (-10.31%); THANGAMAYL: 6452.0 -> 5807.0 (-10.00%); ORCHASP: 1.67 -> 1.51 (-9.58%).
Is there a market-wide PCR signal for 30 Jul 2026?
Market-wide Index Options PCR: Not available for this session.
Conclusion
Yesterday's close-based reference levels frame today's open. Watch Nifty 50 Pivot 24282.4 and Bank Nifty Pivot 57050.92; a break above R1 24377.7 or R2 24438.25 on Nifty could push higher, while a break below S1 24221.85 or S2 24126.55 could suggest a firmer downside. The standout mover INDOMIM and the listed losers provide context for risk and opportunities at the open. For deeper stock insights, use Swastika's Sarthi AI stock assistant.
Open with a clear move beyond 24377.7 or 24126.55 to set the bias.
Open your trading and demat account here
Reference :
1 : Nseindia
Latest Articles

10 Proven Trading Strategies to Maximize Profits and Reduce Losses


Quick Highlights
- Successful traders focus on discipline, risk management, and consistency rather than chasing quick profits.
- The best trading strategies vary depending on market conditions, investment goals, and risk appetite.
- Understanding option trading and futures and options trading can help traders hedge risks and improve capital efficiency.
- Every trader should know when to buy or sell based on analysis rather than emotion.
- Protecting your capital by defining your maximum loss before entering a trade is just as important as identifying profit opportunities.
TRY SARTHI - YOUR AI STOCK ASSISTANT
Making consistent profits in the stock market isn't about finding a secret formula, it's about following the right process every time you trade. Professional traders don't depend on luck. Instead, they use well-tested trading strategies, manage risk carefully, and adapt to changing market conditions.
Whether you're a beginner learning the basics or an experienced trader exploring option trading, having a structured trading plan can significantly improve your decision-making. Today's markets also offer opportunities through futures and options trading, allowing traders to hedge risks, generate income, or take advantage of bullish, bearish, and sideways markets.
However, no strategy works all the time. Before deciding whether to buy or sell, traders should analyse price action, market trends, company fundamentals (for equity investing), and their own risk tolerance. More importantly, every trade should have a predefined maximum loss to prevent emotions from taking control.
In this guide, we'll explore 10 proven trading strategies to improve consistency and reduce unnecessary losses. We'll also cover some popular option strategies that traders commonly use in different market scenarios.
1. Set Clear Trading Goals and Follow a Trading Plan
Every successful trader starts with a plan. Before placing your first order, decide why you're trading. Are you looking for quick intraday opportunities, swing trading profits, or long-term wealth creation? Your objective will determine which trading strategies are most suitable for you.
A good trading plan should include:
- Entry price
- Target price
- Stop-loss level
- Position size
- Risk-to-reward ratio
- Rules for deciding when to buy or sell
Following a written plan helps eliminate emotional decisions and improves consistency over time.
2. Protect Your Capital with Stop-Loss Orders
One of the biggest mistakes traders make is holding on to losing positions in the hope that prices will recover.
A stop-loss order automatically exits your position once a predefined price is reached, limiting your downside.
Before entering any trade, determine your acceptable maximum loss. Many experienced traders risk only 1–2% of their trading capital on a single position.
For example:
- Trading Capital: ₹5,00,000
- Maximum Risk per Trade: 1%
- Maximum Loss: ₹5,000
This simple rule helps traders survive temporary market setbacks while preserving capital for future opportunities.
3. Diversify Instead of Relying on a Single Opportunity
Diversification reduces overall portfolio risk by spreading investments across different sectors and asset classes. Instead of investing everything in one company or industry, consider allocating your capital across:
- Banking
- Information Technology
- FMCG
- Pharmaceuticals
- Energy
- Auto
- ETFs
- Mutual Funds
Experienced traders also diversify between equity investing and futures and options trading depending on their market outlook and risk appetite. A diversified portfolio is generally better equipped to handle changing stock market conditions.
4. Trade with the Market Trend
One of the simplest yet most effective trading strategies is to trade in the direction of the prevailing trend. Trying to predict every market reversal often results in unnecessary losses. Instead, identify whether the market is:
- Uptrend
- Downtrend
- Sideways
Technical indicators such as Moving Averages, ADX, and trendlines can help identify the prevailing trend. When deciding whether to buy or sell, always ask:
- Is the overall trend bullish?
- Is momentum increasing?
- Are volumes supporting the move?
Trading with the trend generally improves the probability of success compared to constantly trading against it.
5. Master Risk Management Before Chasing Returns
Professional traders don't focus only on profits, they focus on protecting capital. One losing trade should never wipe out weeks or months of gains. Some important risk management practices include:
- Never risk more than 1–2% of trading capital.
- Always calculate your maximum loss before entering a trade.
- Avoid overleveraging.
- Maintain a healthy risk-to-reward ratio, such as 1:2 or 1:3.
- Don't average losing positions without a proper strategy.
Successful traders understand that preserving capital is what allows them to stay in the market long enough to benefit from future opportunities.
6. Keep Your Emotions Under Control
One of the biggest reasons traders lose money isn't a lack of knowledge—it's emotions. Fear, greed, and impatience often lead to poor decisions, especially during periods of high volatility.
A disciplined trader follows a predefined plan instead of reacting emotionally to every market movement. Before deciding to buy or sell, ask yourself whether the decision is based on technical or fundamental analysis, or simply on fear of missing out (FOMO).
Some practical ways to control emotions include:
- Avoid revenge trading after a loss.
- Never increase your position size to recover losses quickly.
- Stick to your stop-loss and profit targets.
- Take regular breaks if you're feeling stressed or overwhelmed.
Successful trading is less about predicting the market and more about managing yourself.
7. Review Your Trades Regularly
Every trade offers a learning opportunity, whether it ends in profit or loss. Maintaining a trading journal can help you identify patterns in your decision-making and improve your overall performance. Track details such as:
- Entry and exit prices
- Reason for entering the trade
- Technical indicators used
- Market conditions
- Profit or loss
- Lessons learned
Reviewing your trades every week or month allows you to identify mistakes and refine your trading strategies over time.
8. Understand Support and Resistance Levels
Support and resistance are among the most widely used concepts in technical analysis.
- Support is a price level where buying interest usually increases, preventing prices from falling further.
- Resistance is a level where selling pressure often increases, limiting further upside.
These levels help traders decide when to buy or sell with better risk-reward potential. For example:
- Buying near support can reduce downside risk.
- Selling or booking profits near resistance may improve trade execution.
Support and resistance become even more reliable when confirmed by strong trading volumes and technical indicators.
9. Use Technical Indicators Wisely
Technical indicators help traders analyse price trends, momentum, and volatility. However, no single indicator should be used in isolation. Some of the most commonly used indicators include:
Moving Averages
Moving averages smooth price fluctuations and help identify the overall market trend.
Relative Strength Index (RSI)
RSI measures momentum and indicates whether a stock may be overbought or oversold.
MACD (Moving Average Convergence Divergence)
MACD helps identify trend reversals and momentum shifts by comparing two moving averages.
Bollinger Bands
These bands measure market volatility and help traders identify potential breakout or reversal opportunities. Combining multiple indicators often provides more reliable trading signals than relying on a single tool.
10. Stay Updated and Adapt to Market Conditions
Financial markets are constantly changing due to economic data, corporate earnings, global events, interest rate decisions, and investor sentiment. Successful traders continuously monitor market conditions and adjust their strategies accordingly instead of using the same approach in every environment. For example:
- Trending markets may favour momentum-based strategies.
- Sideways markets often require range-bound approaches.
- Highly volatile markets demand stricter risk management.
The ability to adapt is one of the biggest differences between consistently profitable traders and those who struggle over the long term.
Popular Option Trading Strategies Every Trader Should Know
While equity trading remains popular, many experienced market participants also use option trading to hedge risk, generate income, or benefit from different market scenarios.
Unlike buying shares directly, options provide flexibility with defined risk and lower capital requirements. However, traders should understand how different option strategies work before using them.
Here are some of the most widely used strategies:
Bull Call Spread
A bull call spread is suitable when you expect a stock or index to rise moderately. This strategy involves:
- Buying a call option at a lower strike price.
- Selling another call option with a higher strike price.
Because the premium received from selling the second option offsets part of the purchase cost, the overall investment becomes lower than buying a single call option.
Best suited for
- Moderately bullish markets
- Limited-risk trading
- Defined profit expectations
The bull call spread also limits the maximum loss, making it a preferred strategy for traders seeking controlled risk.
Bear Put Spread
A bear put spread is commonly used when traders expect prices to decline moderately. It involves:
- Buy put at a higher strike price.
- Selling another put option at a lower strike price.
Like the bull call spread, this strategy reduces the premium paid while defining both potential profit and maximum loss. The bear put spread works well during bearish market conditions where a significant but not extreme decline is expected.
Choosing Between Call and Put Options
Understanding call and put contracts is essential before starting option trading.
- A call option gives the buyer the right to purchase an asset at a predetermined price before expiry.
- A put option gives the buyer the right to sell an asset at a predetermined price before expiry.
Generally,
- Traders buy a call option when they expect prices to rise.
- Traders buy put contracts when they expect prices to fall.
Knowing when to use call and put contracts can significantly improve trading decisions under different market conditions.
Iron Condor Strategy
The Iron Condor is one of the most popular option strategies for traders who expect the market to remain within a specific price range. Instead of betting on a strong upward or downward move, this strategy aims to earn from time decay when prices stay stable. An Iron Condor combines two spreads:
- A bull call spread
- A bear put spread
Since both spreads are used together, the strategy offers limited profit as well as limited maximum loss, making it suitable for experienced traders who understand risk management.
Best suited for
- Sideways markets
- Low-volatility environments
- Traders looking for consistent premium income
Although an Iron Condor reduces risk compared to naked option selling, it requires proper strike selection and disciplined position management.
Understand OTM Call Options and OTM Put Options
Before implementing advanced option strategies, it is important to understand the difference between in-the-money and out-of-the-money options.
OTM Call Options
OTM call options have a strike price above the current market price of the underlying asset. For example, if a stock is trading at ₹1,000, a ₹1,100 call option is considered one of the OTM call options because the stock must rise above ₹1,100 before expiry for the option to gain intrinsic value.
Traders often buy OTM call options when expecting a sharp upward movement while risking only the premium paid.
OTM Put Options
Similarly, OTM put options have a strike price below the current market price. If the stock is trading at ₹1,000, a ₹900 put option is classified among OTM put options. These options are generally used when traders expect a significant decline in prices within a limited time frame.
While both OTM call options and OTM put options are comparatively cheaper than at-the-money contracts, they also carry a higher probability of expiring worthless.
What are In-the-Money Call Options?
In-the-money contracts are often referred to as money call options or simply money calls when discussing bullish positions.
A call option becomes a money call option when its strike price is below the current market price. Since these contracts already have intrinsic value, they are usually more expensive than out-of-the-money options.
Experienced traders prefer money calls because they generally respond more quickly to price movements and may offer better risk-adjusted opportunities than speculative out-of-the-money contracts.
However, higher premiums mean traders should carefully evaluate the potential reward before selecting money call options.
Futures and Options Trading: Which One Should You Choose?
Both equity trading and futures and options trading provide opportunities to participate in the financial markets, but they work differently.
For beginners, option trading generally provides greater flexibility because the buyer's risk is limited to the premium paid.
However, futures and options trading require proper knowledge, disciplined execution, and effective risk management before deploying significant capital.
Which Trading Strategy Should You Choose?
There is no single strategy that works in every market. Your choice should depend on:
- Your trading experience
- Your financial goals
- Current market conditions
- Risk appetite
- Time available for monitoring trades
For example:
- Beginners often start with trend-following strategies.
- Intermediate traders may explore option trading using a bull call spread or bear put spread.
- Experienced traders may deploy advanced option strategies such as the Iron Condor during range-bound markets.
Whatever strategy you choose, focus on consistency rather than chasing quick profits.
Frequently Asked Questions
Which trading strategy is best for beginners?
There is no single best strategy. Beginners should start with simple trading strategies such as trend following, support and resistance analysis, and strict risk management before exploring option trading or leveraged products.
Is option trading suitable for beginners?
Yes, option trading can be suitable for beginners if they first understand concepts like call and put, premiums, strike prices, expiry dates, and maximum loss. Starting with defined-risk strategies is generally safer than speculative trades.
What is the difference between a call option and a put option?
A call option gives the buyer the right to purchase an asset at a predetermined price, whereas a put option gives the buyer the right to sell the asset at a predetermined price. Traders use call and put contracts depending on whether they expect prices to rise or fall.
Which option strategy has limited risk?
Strategies such as the bull call spread, bear put spread, and Iron Condor define both potential profit and maximum loss, making them popular among traders looking for controlled risk.
How important is risk management in trading?
Risk management is one of the most important aspects of successful trading. Even highly experienced traders incur losses, but proper position sizing, stop-losses, and disciplined execution help protect capital over the long term.
Over to You
Successful trading is not about predicting every market move correctly, it's about making informed decisions, managing risk effectively, and following a disciplined process. Whether you prefer equity investing, intraday trading, or futures and options trading, building a strong foundation and continuously improving your skills can significantly enhance your long-term performance.
To stay updated with expert market insights, practical trading strategies, IPO analysis, and educational resources, visit Swastika Investmart and explore our latest blogs, research reports, and investment solutions designed to help you make smarter financial decisions.

What are Price Patterns?
Price Patterns are shapes or formations on charts that can be categorized and used to predict future price movements.
These patterns have been seen repeatedly across different charts and times, proving their reliability.
- Duration: Price patterns can last from a few days to several months or even years. Longer patterns usually lead to more significant price moves.
- Price Targets: The targets from these patterns estimate how far the price might move, but they are approximate.
- Interpretation: Analysing patterns involves both skill and flexibility. Patterns may not match the textbook description perfectly but can still be valid.
- Considerations: Always look at the price behaviour and the time it takes for the pattern to form to get a complete picture.
Classification of Patterns
Reversal patterns are important signals in trading that suggest a current trend (whether it's going up or down) might soon change direction. They usually appear after a long period of a particular trend. These patterns help traders predict when a trend might be ending and a new one might start.
Common examples of reversal patterns include:
- Head & Shoulders
- Double Top/Double Bottom
- Triple Top/Triple Bottom
- Broadening Formations
- Rounding Bottom/Rounding Top or Cup & Handle Pattern
Continuation patterns are signals in trading that suggest a brief pause in the current trend, but the trend is likely to continue in the same direction after the pause. In other words, the trend takes a short break and then keeps going.
Common examples of continuation patterns include:
- Flags
- Pennants
- Triangles: Ascending Triangle/Descending Triangle
- Rectangles:
Both Continuous and Reversal Patterns

Rising/Falling Wedges
In this blog, we will have a brief look at how these patterns look.
Double Top : A Double Top is a bearish reversal pattern that signals a potential end to an uptrend. It forms when the price creates two high points (highs) at nearly the same level, separated by a period of time.
- Prior Trend: There must be a strong upward trend.
- First High: The price reaches a high point and then pulls back slightly.
- Second High: The price rises again to a similar level as the first high but on lower trading volume.
- Pattern Completion: The pattern is completed when the price drops below the lowest point between the two highs, confirming a trend reversal. This drop should happen with an increase in trading volume.
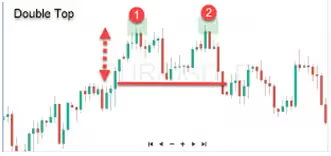
Tip: One will find double top developing often in stocks but one must look at the prior trend and volume to rely on the formation.
Double Bottom
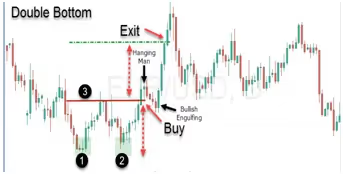
A Double Bottom pattern is a bullish reversal pattern signalling a potential end to a downtrend.
- Prior Trend: There must be a strong downward trend
- First Low: The price hits a low point (low) and then starts to rise.
- High: After the first low, the price climbs and forms a high point (high), which may look slightly rounded.
- Second Low: The price drops again, creating a second low at a similar level to the first, but with lower trading volume.
- Pattern Completion: The pattern is completed when the price rises above the highest point between the two lows, indicating a reversal of the downtrend. This breakout should occur with increased trading volume.
Triple Top
A Triple Top is a bearish reversal pattern that indicates the potential end of an uptrend. It features three distinct high points at roughly the same price level. Here’s a simplified explanation:
- Prior Trend: There must be a strong upward trend before the Triple Top forms.
- Three Highs: The price reaches three highs, each at a similar level, and these highs are well-spaced, marking turning points where the price starts to drop after each high.
- Volume: During the formation of the Triple Top, trading volume usually decreases, with the highest volume at the first high and lower volume on the following highs. However, when the price finally breaks below the support level (the lowest point between the highs), volume should increase, confirming the pattern.

Tip: Pattern is complete when the both lows have been broken on heavier volume.
Triple Bottom
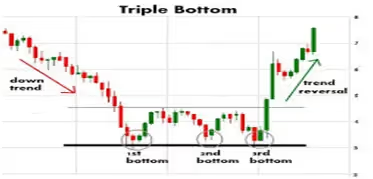
A Triple Bottom is a bullish reversal pattern that signals the potential end of a downtrend. It features three distinct low points at roughly the same price level.
- Prior Trend: There must be a strong downward trend before the Triple Bottom forms.
- Three Lows: The price hits three low points, each at a similar level, and these lows are well-spaced, marking turning points where the price starts to rise after each low.
- Volume: During the formation of the Triple Bottom, trading volume usually decreases, with the highest volume at the first low and lower volume on the following lows. However, when the price finally breaks above the resistance level (the highest point between the lows), volume should increase, confirming the pattern.
Head & Shoulders
- Prior Trend: For a Head & Shoulders pattern to be a reversal signal, there must be a clear uptrend before it forms. Without this uptrend, the pattern can't signal a reversal.
- Left Shoulder: During an uptrend, the price hits a high point (left shoulder) and then drops a bit. This drop usually stays above the trend line, so the uptrend continues.
- Head: After the drop from the left shoulder, the price rises again, reaching a new high (the head). After this high, the price drops again, creating a low point that helps form the neckline.
- Right Shoulder: From the low of the head, the price rises again but doesn’t reach the height of the head. This high (right shoulder) is usually around the same level as the left shoulder. The final decline should break the neckline, completing the pattern.

Inverse Head and Shoulders
The Inverse Head and Shoulders, signals a potential change from a downtrend to an uptrend. Here’s how it forms:
- Prior Trend: There must be a clear downtrend before this pattern can signal a reversal. Without a downtrend, the pattern doesn’t work.
- Left Shoulder: During the downtrend, the price drops to a low point (left shoulder) and then starts to rise.
- Head: After the rise from the left shoulder, the price drops again to a lower point (the head), then rises again, creating a high point that helps form the neckline.
- Right Shoulder: The price drops from the high of the head to form another low (right shoulder). This low should be higher than the head and usually around the same level as the left shoulder. The final rise should break above the neckline, completing the pattern.

When the price breaks above the neckline, it suggests the downtrend may be ending, and the price could start rising.
Broadening Formations
Broadening Formations are patterns where the price creates an expanding triangle. Unlike regular triangles, where the trend lines come together, broadening formations have trend lines that spread out, making the shape of an expanding triangle.
In simple terms, as the price moves, the highs and lows get further apart, creating a pattern that looks like an expanding triangle.
Broadening Bottoms
A Broadening bottom looks like a megaphone and appears during a downtrend. It features:
- Higher Highs and Lower Lows: The price makes progressively higher highs and lower lows, creating a wide, expanding shape over time.
This pattern is a bullish reversal signal, meaning that after it forms, the price trend is likely to shift from down to up.
Volume: Trading volume is often uneven but tends to rise when the price goes up and fall when the price goes down.
Broadening Wedges Ascending
A Broadening Wedges Ascending is a bearish reversal pattern where:
- Trend Lines: Two trend lines slope upwards and get wider apart over time.
- Volume: Trading volume usually increases as the pattern develops.
This pattern indicates that the current uptrend might be ending and a downtrend could begin

Broadening Wedges Descending
A Broadening Wedges Descending is a bullish reversal pattern where:
- Trend Lines: Two trend lines slope downwards and get wider apart over time.
- Volume: Trading volume typically increases as the pattern forms.
This pattern suggests that the downtrend might be ending and a new uptrend could start.

RISING WEDGE
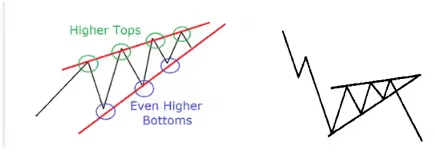
A Rising Wedge is a bearish pattern that forms when prices start wide at the bottom and gradually narrow as they move higher. This pattern slopes upward and signals a potential drop in prices. Here's a simple breakdown:
- Bearish Bias: A rising wedge generally indicates that prices are likely to fall, even though the pattern slopes upward.
- Continuation Pattern: If the wedge forms during a downtrend, it suggests the price might continue to fall after a brief upward movement.
- Reversal Pattern: If the wedge forms during an uptrend, it signals that the upward trend may be ending, and a downward trend could begin.
Regardless of whether it's a continuation or a reversal, a rising wedge usually predicts a drop in prices.
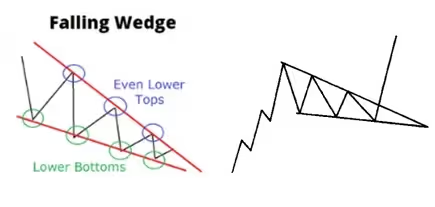
Falling Wedge Pattern
A falling wedge is a chart pattern that looks like a downward-sloping cone. It starts wide at the top and gets narrower as the price moves lower.
- Bullish Signal: It’s considered a bullish pattern, meaning it suggests the price might go up after the pattern forms.
- Continuation Pattern: If the price was going up before the falling wedge, it means the wedge is just a pause, and the uptrend is likely to continue after the pattern completes.
- Reversal Pattern: If the price was going down before the falling wedge, it indicates that the downtrend might end, and the price could start going up.
Overall, whether it’s a continuation or a reversal, a falling wedge generally suggests that prices are likely to rise after the pattern finishes.
Rounding Top
- The price trend slowly curves downward over time, creating a rounded shape.
- Bullish Signal: This pattern is known as a bullish consolidation pattern, which means it suggests that after this gradual downward curve, the price is likely to start moving up

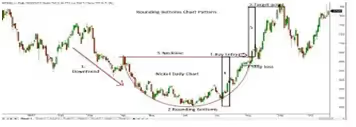
Rounding Bottom
A rounding bottom pattern is a bullish consolidation pattern where the price trend gradually curves upward over time, resembling the shape of a cup. This pattern suggests that the market is slowly gaining strength and is likely to continue rising after the consolidation period.
FLAGS & PENNANTS
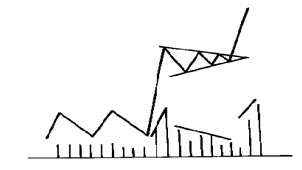
Flags and Pennants are short-term continuation patterns that show a brief pause in a strong price move before the trend continues in the same direction. These patterns appear after a sharp rise or fall in price with high trading volume.
Flags look like small rectangles that slope against the trend. This pattern looks like a small rectangle that slopes against the main trend. Volume usually decreases during the formation, then picks up again when the price breaks out of the flag.

Pennants have a triangular shape. This pattern looks like a small triangle with converging trend lines and resembles a short symmetrical triangle. Like flags, volume typically decreases during the pattern and increases when the price breaks out.
Both patterns indicate a short break before the price resumes its previous direction, whether up or down.
Rectangle
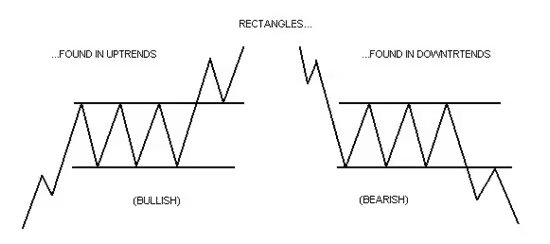
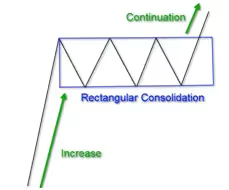
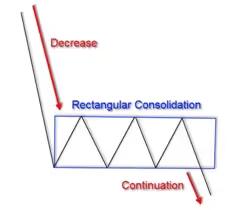
A Rectangle is a continuation pattern that forms when the price moves within a set range during a break in the trend. It looks like a rectangle because the price has two highs and two lows that create parallel lines at the top and bottom.
- Highs and Lows: The price hits similar high points and low points, creating a trading range.
- Other Names: Rectangles are also called trading ranges, consolidation zones, or congestion areas.
This pattern shows that the price is pausing and is likely to continue in the same direction once it breaks out of the range.
Rectangle Top
Bullish Rectangle Pattern: This is a bullish reversal pattern where the price also moves within a horizontal range, with two horizontal trend lines. When the price breaks above this range, it usually indicates an upward move.
Rectangle Bottom
Bearish Rectangle Pattern: This is a bearish reversal pattern where the price moves within a horizontal range, forming two horizontal trend lines. When the price breaks below this range, it often signals a downward move.
Symmetrical Triangle
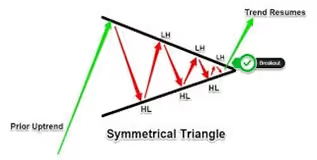
A Symmetrical Triangle pattern forms when two trend lines come together and create a triangle shape.
- Upper Trend Line: Slopes downward, connecting lower highs.
- Lower Trend Line: Slopes upward, connecting higher lows.
- Apex: The point (intersection) where the two trend lines meet.
As the triangle forms, trading volume usually decreases. The pattern indicates that the price could break out in either direction when it reaches the apex.
Ascending Triangle
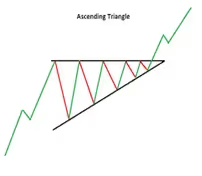
An Ascending Triangle is a bullish pattern that generally forms during an uptrend. It features:
- Horizontal Top Line: A flat line at the top, showing consistent resistance.
- Rising Bottom Line: An upward-sloping line connecting higher lows.
This pattern often signals that the price will keep rising after the triangle forms. It can also appear at the end of a downtrend as a reversal pattern, but it's usually a continuation pattern that shows the price is likely to keep going up.
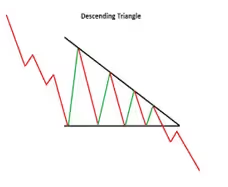
A Descending Triangle is a bearish pattern that usually forms during a downtrend. It has:
- Horizontal Bottom Line: A flat line at the bottom, showing consistent support.
- Downward-Sloping Top Line: A line sloping downwards, connecting lower highs.
This pattern often signals that the price will continue to fall after the triangle forms. It can also appear at the end of an uptrend as a reversal pattern, but it typically indicates the price is likely to keep going down.
Conclusion
Price patterns on charts, whether reversal or continuation, play a vital role in predicting future price movements in the market. Reversal patterns like Double Top, Double Bottom, and Head & Shoulders signal changes in the direction of the current trend, while continuation patterns like Flags, Pennants, and Triangles indicate a brief pause before the trend resumes. Understanding these patterns helps traders make informed decisions about when to enter or exit trades, maximizing potential profits. By analyzing the shape and volume accompanying these patterns, traders can gain insights into market sentiment and anticipate price shifts.
Stay updated with Swastika and learn more about stock market and its terminologies!

Swastika Q1 FY25: Impressive Growth Across All Metrics
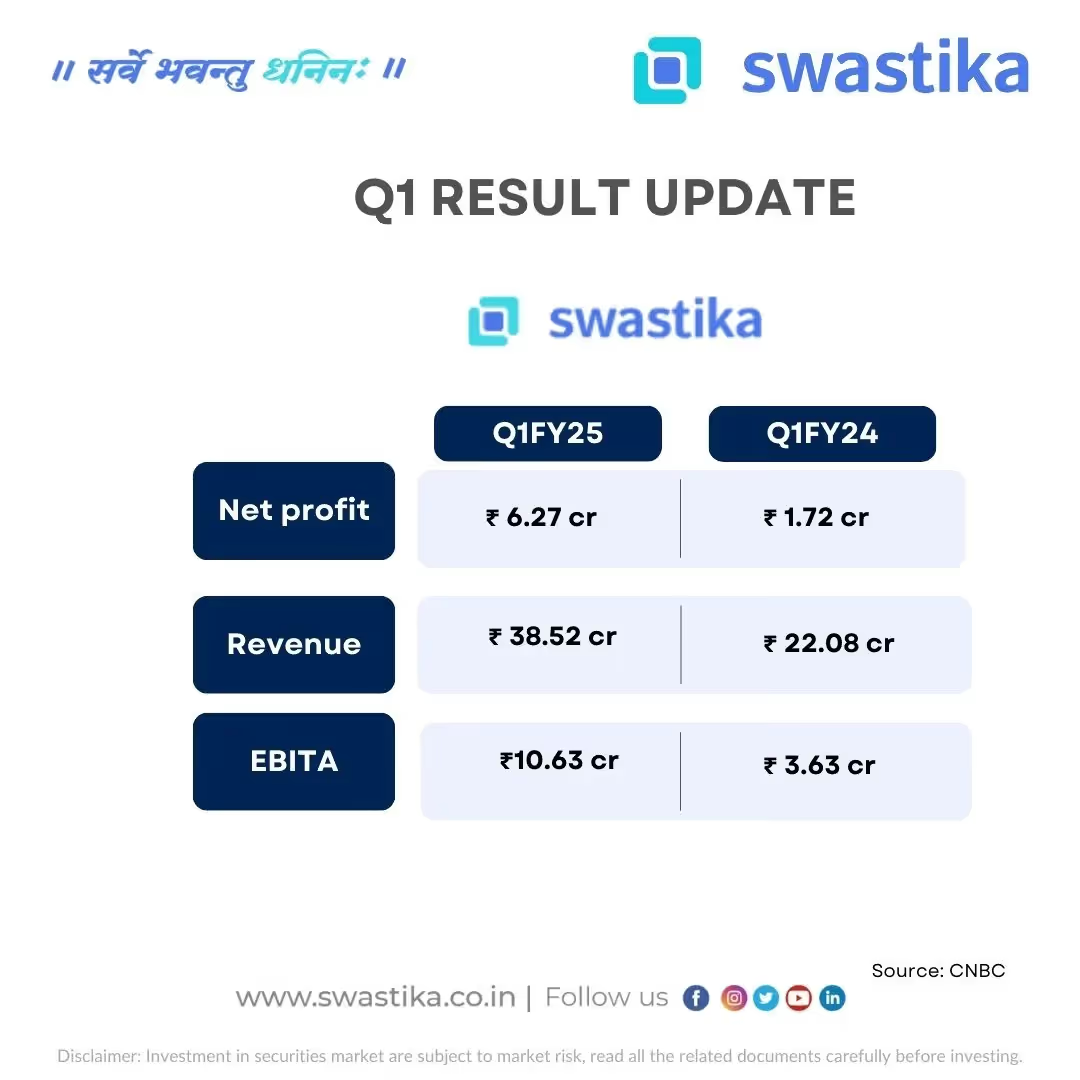
Swastika has reported stellar growth in Q1FY25, with significant improvements in all key financial metrics compared to the same period last year. Here are the highlights:
Key Highlights:
Net Profit: ₹6.27 crore, up from ₹1.72 crore in Q1FY24
Revenue: ₹38.52 crore, a strong increase from ₹22.08 crore
EBITA: ₹10.63 crore, a significant rise from ₹3.63 crore
This impressive performance underscores Swastika's strategic initiatives and strong market position. As we continue to innovate and expand, we remain committed to delivering value to our stakeholders.
Conclusion-
Swastika's Q1FY25 results reflect impressive growth, with substantial increases in net profit, revenue, and EBITA compared to Q1FY24. This performance highlights the effectiveness of the company's strategic initiatives and its strong position in the market. As Swastika continues to innovate and expand, it remains focused on delivering long-term value to its stakeholders, positioning itself for sustained success.
Disclaimer: Investment in the securities market is subject to market risks. Please read all related documents carefully before investing.
Start Trading with Swastika Now!

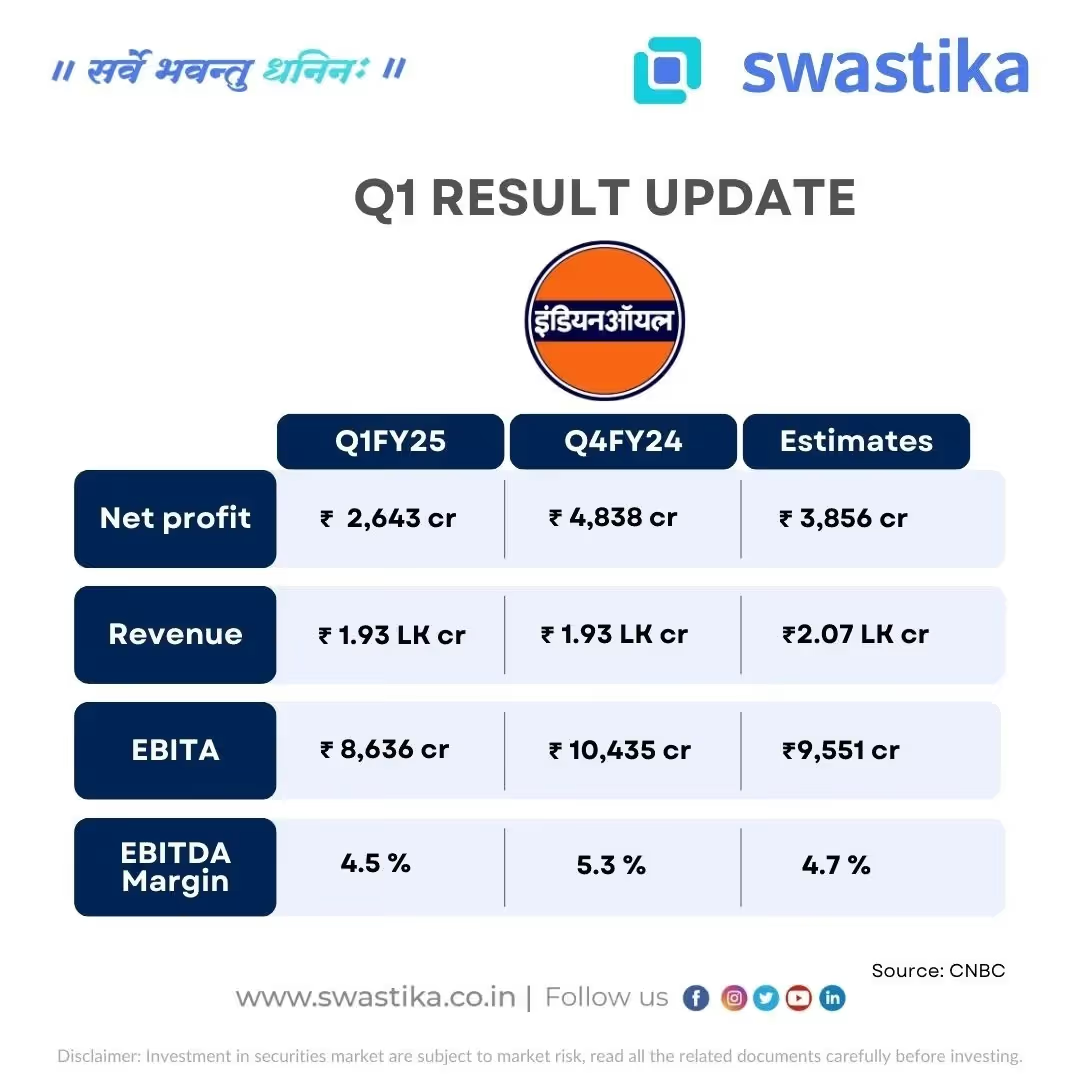
Indian Oil Corporation Limited Q1 FY25 Financial Performance Highlights
Key Highlights
- Net Profit
- Q1 FY25: ₹2,643 crore
- Q4 FY24: ₹4,838 crore
- Estimate: ₹3,856 crore
- Note: The net profit has decreased significantly by ₹2,195 crore compared to Q4 FY24 and is below the estimated profit.
- Revenue:
- Q1 FY25: ₹1.93 lakh crore
- Q4 FY24: ₹1.93 lakh crore
- Estimate: ₹2.07 lakh crore
- Note: Revenue remains consistent with Q4 FY24 but is below the estimated revenue.
- EBITA:
- Q1 FY25: ₹8,636 crore
- Q4 FY24: ₹10,435 crore
- Estimate: ₹9,551 crore
- Note: EBITA has decreased by ₹1,799 crore compared to Q4 FY24 and is also below the estimated EBITA.
- EBITDA Margin:
- Q1 FY25: 4.5%
- Q4 FY24: 5.3%
- Estimate: 4.7%
- Note: The EBITDA margin has declined by 0.8% from Q4 FY24 and is slightly below the estimated margin
Conclusion-
The company’s Q1 FY25 results show a significant decline in net profit, EBITA, and EBITDA margin compared to Q4 FY24, with figures falling below estimates. Although revenue remained consistent with Q4 FY24, it was still lower than the expected amount. The decrease in profitability and margins suggests challenges during the quarter, indicating that the company needs to address these issues to improve its financial performance moving forward.
For more details, visit Swastika's website.
Source: CNBC

Bharat Forge Limited Q1 FY25 Financial Performance Highlights:
- Net Profit:
- Q1 FY25: ₹269.4 crore
- Q1 FY24: ₹315 crore
- Estimate: ₹392 crore
- Note: The net profit has decreased by ₹45.6 crore compared to Q1 FY24 and is below the estimated profit.
- Revenue:
- Q1 FY25: ₹2,338 crore
- Q1 FY24: ₹2,127 crore
- Estimate: ₹2,370 crore
- Note: Revenue has increased by ₹211 crore compared to Q1 FY24 but is slightly below the estimated revenue.
- EBITA:
- Q1 FY25: ₹651 crore
- Q1 FY24: ₹553 crore
- Estimate: ₹650 crore
- Note: EBITA has increased by ₹98 crore compared to Q1 FY24 and meets the estimate.
- EBITDA Margin:
- Q1 FY25: 28%
- Q1 FY24: 26%
- Estimate: 27.6%
- Note: The EBITDA margin has improved by 2% from Q1 FY24 and exceeds the estimated margin
.avif)
For more details, visit Swastika's website.Source: CNBC
.avif)
Bajaj Q1 FY25 Results Update
Bajaj has released its financial results for the first quarter of FY25:
Key Highlights-
Net Profit:
Current Net Profit: ₹1,988 crore
Previous Quarter (Q1 FY24): ₹1,665 crore
Estimated: ₹1,896 crore
Revenue:
Current Revenue: ₹11,928 crore
Previous Quarter (Q1 FY24): ₹10,304 crore
Estimated: ₹11,700 crore
EBIT (Earnings Before Interest and Taxes):
Current EBIT: ₹2,035 crore
Previous Quarter (Q1 FY24): ₹1,954 crore
Estimated: ₹2,360 crore
EBITDA Margin:
Current EBITDA Margin: 20.25%
Previous Quarter (Q1 FY24): 19%
Estimated: 20%
Conclusion-
Bajaj's financial performance for Q1 FY25 shows strong growth compared to the previous quarter, with net profit and revenue both exceeding estimates. The company’s EBIT also showed improvement, though slightly below expectations. The EBITDA margin increased to 20.25%, reflecting operational efficiency. Overall, Bajaj’s results demonstrate solid performance and a positive trend in its financial health, though there is room for improvement in EBIT.
.avif)
Stay updated with Swastika Investmart for more financial insights. JOIN NOW!
Big Budget


Popular Articles





.avif)
.avif)

.avif)



START YOUR INVESTMENT JOURNEY
Get personalized advice from our experts
- Dedicated RM Support
- Smooth and Fast Trading App
