


Nifty 50 31 Jul 2026 Morning Market Summary


Key Takeaways
- Prev session close reference: Nifty 50 Pivot 24370.9; R1 24442.1; R2 24500.6; S1 24312.4; S2 24241.2.
- Standout mover: TRANSPEK from 1101.1 -> 1321.3 (+20.00%).
- Biggest loser: NARMADA from 36.19 -> 17.02 (-52.97%).
- Market-wide Index Options PCR: Not available for this session.
Nifty 50 Support And Resistance Levels For 31 Jul 2026
Pivot: 24370.9; R1: 24442.1; R2: 24500.6; S1: 24312.4; S2: 24241.2. The Pivot is the central reference; R1 and R2 above are resistance hurdles, while S1 and S2 below are cushions. All these numbers come from yesterday's close as the basis for today's session.
In plain language, if the price sits above R1, the near-term tone is mildly bullish; above R2, the bias could extend higher; if it slips below S2, the bias could turn bearish. For deeper stock-level insights, Swastika's Sarthi AI stock assistant.
Nifty Bank Pivot Levels For 31 Jul 2026
Pivot: 57271.9; R1: 57404.2; R2: 57543.55; S1: 57132.55; S2: 57000.25. Those levels mirror the same logic as Nifty 50 for the Bank Nifty.


Top 5 Gainers (31 Jul 2026 Session, EQ Series, Liquid Names Only)
| Ticker | From | To | Change |
|---|---|---|---|
| TRANSPEK | 1101.1 | 1321.3 | (+20.00%) |
| UEL | 128.11 | 153.73 | (+20.00%) |
| YASHO | 3215.6 | 3858.7 | (+20.00%) |
| RSDFIN | 92.29 | 110.74 | (+19.99%) |
| DCI | 276.75 | 329.7 | (+19.13%) |
Top 5 Losers (31 Jul 2026 Session, EQ Series, Liquid Names Only)
| Ticker | From | To | Change |
|---|---|---|---|
| NARMADA | 36.19 | 17.02 | (-52.97%) |
| EXPLEOSOL | 906.6 | 802.85 | (-11.44%) |
| THANGAMAYL | 5807.0 | 5226.5 | (-10.00%) |
| ASIANTILES | 60.71 | 54.68 | (-9.93%) |
| SIGNPOST | 311.2 | 283.55 | (-8.88%) |
Market-Wide Index Options PCR
Market-wide Index Options PCR: Not available for this session.
Frequently Asked Questions
Nifty 50 Support and Resistance Levels for 31 Jul 2026
Pivot 24370.9; R1 24442.1; R2 24500.6; S1 24312.4; S2 24241.2. These are reference points for today's trading, derived from yesterday's close.
Nifty Bank Pivot Levels for 31 Jul 2026
Pivot 57271.9; R1 57404.2; R2 57543.55; S1 57132.55; S2 57000.25. These are yesterday's close-based reference levels for today.
Top Gainers on 31 Jul 2026
TRANSPEK: 1101.1 -> 1321.3 (+20.00%); UEL: 128.11 -> 153.73 (+20.00%); YASHO: 3215.6 -> 3858.7 (+20.00%); RSDFIN: 92.29 -> 110.74 (+19.99%); DCI: 276.75 -> 329.7 (+19.13%).
Top Losers on 31 Jul 2026
NARMADA: 36.19 -> 17.02 (-52.97%); EXPLEOSOL: 906.6 -> 802.85 (-11.44%); THANGAMAYL: 5807.0 -> 5226.5 (-10.00%); ASIANTILES: 60.71 -> 54.68 (-9.93%); SIGNPOST: 311.2 -> 283.55 (-8.88%).
PCR for Market-wide Index Options today
Market-wide Index Options PCR: Not available for this session.
Conclusion
Yesterday's close reference levels set the stage for today's open. Nifty 50 pivot at 24370.9 with R1 24442.1 and R2 24500.6; S1 24312.4; S2 24241.2. The standout mover TRANSPEK posted a 20% gain while NARMADA slid 52.97% from 36.19 to 17.02. Market-wide Index Options PCR remains not available for this session. Watch how price interacts with the pivot and resistance/support on open, and consider exploring deeper stock-level insights with Swastika's Sarthi AI stock assistant.
Open your trading and demat account here
Reference :
1 : Nseindia
Latest Articles

Equity Trading in the Share Market


Equity trading, also known as stock trading, is the buying and selling of shares of companies in the stock market. It is a fundamental way for investors to grow their wealth and participate in the financial markets. Let's break down the basics of equity trading in simple language.
What Are Equities?
Equities, or stocks, represent ownership in a company. When you buy a share of a company, you own a small part of that company. This ownership entitles you to a portion of the company's profits, which can be paid out as dividends. Additionally, if the company grows and becomes more valuable, the value of your shares can increase, allowing you to sell them for a profit.
What Is Equity Trading?
Equity trading involves buying and selling these shares on the stock market. The stock market is a platform where investors can trade stocks with each other. The two main types of stock markets are:
- Primary Market: This is where companies sell their shares to the public for the first time through an Initial Public Offering (IPO).
- Secondary Market: This is where existing shares are traded among investors. Most of the trading happens in the secondary market.
How Does Equity Trading Work?
Equity trading typically follows these steps:
- Opening an Account: To start trading, you need to open a trading account with a stockbroker. This account allows you to buy and sell shares.
- Placing an Order: You place an order to buy or sell shares through your trading account. Orders can be placed online, through a mobile app, or by calling your broker.
- Order Execution: Once your order is placed, it is sent to the stock exchange where it gets matched with a corresponding buy or sell order. If there is a match, the trade is executed.
- Settlement: After the trade is executed, the shares are transferred to your account, and the money is deducted or credited accordingly. This process usually takes a couple of days.
Types of Equity Trading
There are different ways to trade equities, including:
- Day Trading: Buying and selling stocks within the same trading day. Day traders take advantage of small price movements and aim for quick profits.
- Swing Trading: Holding stocks for a few days to weeks to benefit from expected price swings. Swing traders use technical analysis to make decisions.
- Long-Term Investing: Buying and holding stocks for months or years. Long-term investors focus on the company's fundamentals and growth potential.
- Scalping: Making numerous small trades to earn small profits on each trade. Scalping requires quick decision-making and fast execution.
Key Concepts in Equity Trading
Market Orders and Limit Orders:
- Market Order: An order to buy or sell a stock immediately at the current market price.
- Limit Order: An order to buy or sell a stock at a specific price or better.
Bid and Ask Price:
- Bid Price: The highest price a buyer is willing to pay for a stock.
- Ask Price: The lowest price a seller is willing to accept for a stock.
The difference between the bid and ask price is called the spread.
Bull and Bear Markets:
- Bull Market: A period when stock prices are rising or expected to rise.
- Bear Market: A period when stock prices are falling or expected to fall.
- Diversification: Spreading investments across different stocks to reduce risk. Diversification helps protect your portfolio from the poor performance of a single stock.
Risks and Rewards of Equity Trading
Rewards:
- Potential for High Returns: Stocks have historically offered higher returns compared to other investments like bonds and savings accounts.
- Ownership: Owning stocks means you have a stake in the company's success and can benefit from its growth.
- Dividends: Some companies pay dividends, providing a regular income stream.
Risks:
- Market Risk: Stock prices can be volatile and unpredictable, leading to potential losses.
- Company-Specific Risk: A company's poor performance or adverse news can negatively impact its stock price.
- Economic Risk: Economic downturns can affect the entire stock market and your investments.
Conclusion
Equity trading is an essential part of the financial markets, offering opportunities for wealth creation and participation in a company's growth. By understanding the basics of how equity trading works, the types of trading, and the associated risks and rewards, you can make decisions and develop effective trading strategies. Whether you are a beginner or an experienced trader, staying informed and disciplined is key to success in the stock market.
Stay updated with Swastika for more market insights. JOIN NOW!

Understanding In-The-Money (ITM) Options
In a call option, you have the right, but not the obligation, to buy a stock for a set price (strike price) by a certain date (expiry date). There are different types of call options, and today we'll focus on In-the-Money (ITM) call options. Let's break it down:
- Call Option: You're basically hoping the stock price will go up so you can buy it cheap and then sell it for a profit.
- In-the-Money (ITM): This means the stock's current price is higher than the strike price of your call option.
Example:
Let's say the current price (spot price) of a stock is ₹8,300
- You buy a call option with a strike price of ₹8,200 (your agreed upon this purchase price)
- Since the stock price (₹8,300) is higher than your strike price (₹8,200), your call option is In-the-Money (ITM).
Options can be categorized as:
- In-The-Money (ITM)
- At-The-Money (ATM)
- Out-Of-The-Money (OTM)
These terms help investors decide which options to buy or sell.
- Intrinsic Value: This is the actual value of an option if you used it today. It’s the difference between the current stock price and the strike price.
ITM Options
- Call Option: ITM if the strike price is lower than the current stock price.
Example: Current stock price is ₹1000, and the call option strike price is ₹900. This option is ITM because ₹1000 (current price) - ₹900 (strike price) = ₹100.
- Put Option: ITM if the strike price is higher than the current stock price.
Example: Current stock price is ₹1000, and the put option strike price is ₹1100. This option is ITM because ₹1100 (strike price) - ₹1000 (current price) = ₹100.
Option Premium Components
The price you pay for an option (option premium) has two parts:
- Intrinsic Value
- Time Value
Formula: Option Premium=Intrinsic Value+Time ValueOption Premium=Intrinsic Value+Time Value
Characteristics of ITM, ATM, and OTM Options
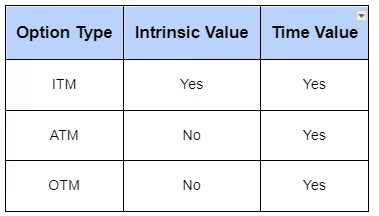
- Intrinsic Value: The real value of an ITM option. It’s the difference between the stock price and the strike price.
- Time Value: The extra amount you pay because the option might become more valuable before it expires. This value decreases as the expiration date gets closer.
Let’s take another example to understand an ITM Call Option:
An ITM call option has a strike price lower than the current stock price.
Example:
- Current Price: ₹8300
- ITM Call Option: Any strike price below ₹8300
- Example Option: NIFTY FEB 8200 CALL (Strike Price = ₹8200, Current Price = ₹8300)
Benefits of ITM Call Options
- Lower Risk: ITM options are less likely to expire worthless because the stock price is already in your favor.
- Good Balance of Leverage and Risk: You can get good returns with a smaller investment compared to buying the stock itself.
- Less Volatile: ITM options are less affected by sudden market changes compared to other options.
Things to Consider with ITM Call Options
- Higher Cost: ITM options cost more because they already have some built-in profit potential.
- Lower Leverage: Higher cost means you have less money left for other investments.
- Time Decay: As the option gets closer to its expiration date, its value decreases faster.
- Limited Profit: Your profit is capped at the strike price plus the premium you paid.
Who Should Use ITM Call Options?
- Investors who are bullish (optimistic) on a stock's price and want to profit from an increase.
- Investors seeking to hedge (protect) their existing stock holdings.
- Investors looking for a balanced approach with some level of built-in profit potential and lower risk.
Conclusion
ITM call options can be a powerful tool, but it's important to understand the costs, risks, and limitations before using them. Carefully consider your investment goals and risk tolerance before diving in.

What is a Circuit Breaker?
A circuit breaker in the stock market is a mechanism that sets a price band within which a stock can be traded on a given day. Circuit breakers operate automatically by halting trading when global exchange values reach predetermined levels. This band includes a lower limit (lower circuit) and an upper limit (upper circuit).
Why is a Circuit Breaker Needed?
Stock prices often fluctuate due to market sentiments, influenced by positive or negative news. Circuit breakers are set up to prevent extreme price movements, protecting investors from sudden, unexpected changes. They also help reduce price manipulation to some extent.
The Securities and Exchange Board of India (SEBI) has defined various circuit levels: 2%, 5%, 10%, and 20%. These levels are based on the stock's closing price from the previous day.
Example:
If XYZ stock closed at ₹100 yesterday and has a 10% circuit limit, today it can only be traded between ₹90 (lower limit) and ₹110 (upper limit). If the stock reaches either limit, trading is halted.
How Circuit Breakers Work
In the trade world, a circuit breaker serves the same purpose as it does in residential electrical circuits. It engages and cuts the circuit when it senses an overload. Circuit breakers are emergency safeguards in the trading industry put in place by stock markets to temporarily or permanently halt trading activity when market prices decline drastically.
Individual Stocks:
If the price hits the upper or lower limit, trading in that particular stock is halted.
Market Indices:
A 10%, 15%, or 20% change triggers a market-wide halt.
Upper and Lower Circuit Limits
The limits prevent excessive speculation and volatility. Depending on the stock category, a stock can shift by 5%, 10%, or a maximum of 20% during a trading day.
Example of Upper Circuit and Lower Circuit
Let's say XYZ stock closed at ₹100 yesterday. If it has a 10% circuit limit:
- Upper Circuit: The upper limit would be ₹110 (10% above ₹100). If the stock price reaches ₹110, trading is halted because it has hit the upper circuit. This indicates strong buying interest, and the price can't go higher for the rest of the day.
- Lower Circuit: The lower limit would be ₹90 (10% below ₹100). If the stock price drops to ₹90, trading is halted because it has hit the lower circuit. This indicates strong selling pressure, and the price can't go lower for the rest of the day.
Market-Wide Circuit Breakers
Time-Based Rules:
- Before 1 PM: A 15% movement halts the market for 1 hour and 45 minutes, followed by a 15-minute pre-opening session.
- Between 1 PM and 2 PM: A 15% movement halts the market for 45 minutes, followed by a 15-minute pre-opening session.
- After 2 PM: A 15% movement halts the market for the rest of the day.
- At Any Time: A 20% movement halts the market for the entire day.
Summary Table of Circuit Breaker Durations

Conclusion
Circuit breakers play a important role in stabilizing the stock market by preventing excessive volatility and protecting investors from sudden, significant price changes.

Understanding Market Capitalization: Meaning, Importance
Ever wondered how much a company is "worth"? The answer lies in a key metric: Market Capitalization. In the stock market, it shows a company's total value based on its current share price and the number of shares available for trading. Instead of looking at revenue or total asset worth, investors use this number to assess a company's size. The market capitalization of a takeover candidate aids in evaluating whether the acquirer will receive a decent deal from the deal.
Formula:
Market Cap = Current Share Price * Total Outstanding Shares
So, if Company W share price is Rs. 200 and there are 5 crore outstanding shares, its Market Cap would be Rs. 1,000 crore (200 * 5 crore).
Why does it matters?
It gives you a snapshot of where a company stands:
- Growth Potential: A smaller company might be newer and have more room to grow, making it an attractive option for growth investors.
- Stability: Larger companies are more stable and less affected by market fluctuations. They often have more financial reserves to cover losses and recover from downturns.
- Risk and Volatility: Small-cap companies can offer high growth potential but come with higher risk and volatility. Large-cap companies are generally more stable but may grow more slowly.
Using Market Capitalization to Diversify Your Portfolio
Diversification is about spreading your investments to manage risk:
- Across Asset Classes: For example, investing in both stocks and bonds.
- Within Asset Classes: Investing in a mix of small-cap, mid-cap, and large-cap stocks to balance potential risks and returns.
Types of Companies
Companies are categorized into different types based on their market capitalization. This helps investors balance their portfolios to minimize risk.
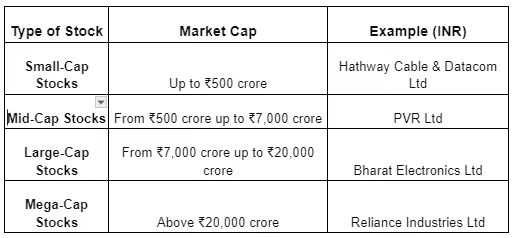
Categories
Small-Cap Stocks
- Market Cap: Up to ₹500 crore.
- Growth Potential: Small-cap companies are often in their early stages and have growth potential. However, they are also more risky.
- High Risk, High Reward: These companies can offer high returns during favorable economic conditions but are more affected by market fluctuations and economic downturns.
- Examples: Hathway Cable & Datacom Ltd.
Mid-Cap Stocks
- Market Cap: From ₹500 crore up to ₹7,000 crore.
- Balanced Growth: Mid-cap companies have a balance between growth potential and stability. They are more established than small-cap companies but still have space for growth.
- Moderate Risk: These companies are less risky than small-caps but more volatile than large-caps. They can provide returns with moderate risk.
- Examples: PVR Ltd.
Large-Cap Stocks
- Market Cap: From ₹7,000 crore up to ₹20,000 crore.
- Stability: Large-cap companies are well-established and financially sound. They are market leaders with a proven track record.
- Lower Risk, Steady Returns: These companies offer more stability and are less likely to experience volatility. They are suitable for conservative investors seeking steady returns.
- Examples: Bharat Electronics Ltd.
Mega-Cap Stocks
- Market Cap: Above ₹20,000 crore.
- Market Dominance: Mega-cap companies are the largest and dominant in their industries. They are often multinational corporations with influence on the market.
- Very Low Risk: These companies provide the highest level of stability and are considered safe investments. While the growth potential might be lower, they offer reliable returns and are ideal for risk-avoid investors.
- Examples: Reliance Industries Ltd.
Conclusion
Market capitalization is an important factor in evaluating stocks and mutual funds. It helps investors take decisions based on their risk tolerance and return expectations. However, while it is a valuable indicator of a company’s financial health, investors should not rely solely on it. A thorough analysis of the company’s overall performance and market conditions is essential before making investment decisions.

How Do Election Results Impact the Indian Stock Market?
Elections are crucial events in any democracy, and India is no exception. The outcomes of elections can have significant impacts on the stock market. This blog explores how election results influence the Indian stock market and what the potential impacts of Prime Minister Narendra Modi’s third term could be.
Political Factors Affecting the Stock Market
Market Sentiment and Stability:
- Market Sentiment: Elections often bring a sense of uncertainty. Investors generally prefer stability, and election outcomes can either boost or reduce their confidence. If the results are in favor of a party or leader perceived to be business-friendly and stable, the market reacts positively.
- Policy Predictability: Stable governments are often able to implement policies more predictably. Investors like predictability as it reduces the risks associated with sudden policy changes.
Economic Policies:
- Pro-Growth Policies: If the elected government has a track record or a plan focusing on economic growth, infrastructure development, and business-friendly regulations, the stock market usually reacts positively.
- Reform Initiatives: Governments promising and delivering structural reforms (like tax reforms, deregulation, and infrastructure spending) can boost investor confidence and drive market rallies.
Fiscal Management:
- Budget and Spending: Election outcomes can impact fiscal policies. Governments that promise sensible fiscal management and reduced deficits tend to be favored by the markets.
- Spending Programs: Conversely, if a new government is expected to increase public spending significantly without a clear plan for managing the budget, it may cause concern among investors about inflation and fiscal health, potentially leading to market volatility.
Global Perception:
- Foreign Investments: Global investors closely watch Indian elections. A government perceived as stable and reform-oriented can attract more Foreign Direct Investment (FDI) and Foreign Institutional Investment (FII), positively influencing the stock market.
- Geopolitical Stability: Election results that contribute to regional stability or enhance diplomatic relations can positively impact the stock market.
Narendra Modi’s Potential Third Term and Its Impact
Prime Minister Narendra Modi, known for his strong leadership and decisive economic policies, could significantly impact the stock market if he secures a third term. Here’s how:
Continuation of Economic Reforms:
Modi’s government has been known for several landmark economic reforms such as the Goods and Services Tax (GST), Insolvency and Bankruptcy Code (IBC), and digitalization initiatives. A third term could mean the continuation and deepening of these reforms, providing a stable and predictable policy environment that is likely to be welcomed by investors.
Infrastructure and Development Projects:
Modi’s focus on infrastructure development, including projects like smart cities, improved transportation networks, and digital infrastructure, could continue. These initiatives can stimulate economic growth, create jobs, and increase demand in various sectors, positively influencing the stock market.
Foreign Investment and Economic Relations:
Under Modi’s leadership, India has improved its ease of doing business rankings and attracted significant foreign investments. A third term could further strengthen India’s global economic relations, encouraging more foreign investments and boosting market confidence.
Political Stability:
A third term for Modi could imply political stability, which is generally favorable for the stock market. Stability reduces uncertainty and helps in long-term planning for both domestic and foreign investors.
Focus on Technology and Innovation:
Modi’s government has also emphasized technology and innovation through initiatives like Digital India and Make in India. Continued focus in these areas could foster a more robust tech ecosystem, providing growth opportunities for tech stocks and start-ups.
Potential Risks:
Implementation Risks: While Modi’s policies are generally market-friendly, the actual implementation of large-scale reforms can sometimes face hurdles, leading to temporary market fluctuations.
Global Economic Conditions: The global economic environment can also impact the effectiveness of Modi’s policies. Trade wars, global slowdowns, or geopolitical tensions can affect market performance regardless of domestic policies.
Conclusion
Election results have a deep impact on the Indian stock market, primarily due to changes in market sentiment, policy direction, and fiscal management. A potential third term for Prime Minister Narendra Modi is expected to bring continued economic reforms, infrastructure development, and political stability, all of which are likely to positively influence the stock market. However, investors should remain mindful of implementation challenges and global economic conditions that can also affect market dynamics. As always, a balanced and insightful approach to investing is crucial in navigating the impacts of election results on the stock market.
Learn more about stock market with Swastika!

What is Prospectus?
A prospectus is a formal document that gives information about an investment offering to the public and is required by the Securities and Exchange Commission (SEC) to be filed. Bonds, mutual funds, and stock offers need the filing of a prospectus. Because it includes a wealth of pertinent information about the investment or security, the prospectus can assist investors in making better-informed investing decisions.
- Preliminary Prospectus
This is the initial offering document provided by the company. It contains most details about the business and the transaction. However, it doesn't include the number of shares or the price.
- Final Prospectus
This document provides all the details of the investment offering to the public. It includes background information, the number of shares or certificates to be issued, and the offering price.
Prospectus Example
In mutual funds, the prospectus covers objectives, investment strategies, risks, and performance, fees, and fund management details.
Requirements for Issuing a Prospectus
To issue a prospectus, a company must:
- File it with local regulatory bodies like SEBI and stock exchanges.
- It must be dated and signed.
- Include all necessary information outlined in the Companies Act 2013.
- Avoid providing misleading information.
Why Read a Prospectus? Here's Why It Matters:
An SEC-mandated prospectus gives investors crucial information regarding an offering of securities.
It disseminates risk information to the public and compiles important details about the investment and the business being invested in.
Investors should take into account the type and degree of risk involved, which is why those facts are usually included early in the prospectus and in more depth later on.
Investors want to know that the firm they are investing in is financially stable enough to fulfill its obligations, therefore the financial standing of the business is also crucial.
Types of Prospectuses
- Red Herring Prospectus: Filed with the registrar before offering shares. Usually lacks details like quantity or price.
- Abridged Prospectus: A brief summary with essential offer details. Must include all documents needed for purchasing the security.
- Deemed Prospectus: Considered deemed if it details the company’s investment offer to the public.
- Shelf Prospectus: Distributed by banks or financial institutions, containing details of multiple investment types.
Details Included in a Prospectus
A prospectus contains the following details:
- Company Information: Name, registered office address, objectives, and background.
- Offer Details: Number of shares or certificates to be issued, offering price, and any minimum subscription amount.
- Financial Information: Audited financial reports, including profit and loss statements, balance sheets, and cash flow statements.
- Management Details: Information about the company's directors, management team, and key personnel.
- Risk Factors: An overview of the risks associated with the investment, including market risks, regulatory risks, and operational risks.
- Legal and Regulatory Information: Details of any legal proceedings, regulatory compliance, and agreements relevant to the offering.
- Use of Proceeds: How the funds raised from the offering will be used by the company.
- Fees and Expenses: Details of any fees, expenses, or charges associated with the investment, including management fees and transaction costs.
- Offering Structure: Any special terms or conditions of the offering, such as underwriting arrangements or distribution channels.
- Other Relevant Information: Any additional information deemed relevant to investors, such as industry trends, competitive landscape, and future growth prospects.
Conclusion
By reading the prospectus carefully, you can:
- Compare different investment options.
- Spot any potential risks.
- See if the investment aligns with your goals and risk tolerance
Big Budget


Popular Articles





.avif)
.avif)

.avif)



START YOUR INVESTMENT JOURNEY
Get personalized advice from our experts
- Dedicated RM Support
- Smooth and Fast Trading App
