


Nifty 50 Morning: 03 Aug 2026 Market Summary




Key Takeaways
- Nifty 50 pivot levels (from the previous session's close): Pivot 24687.92; R1 24860.68; R2 24947.07; S1 24601.53; S2 24428.77.
- Top gainers: AARTISURF 400.85 -> 481.0 (+20.00%), ALPHAGEO 220.13 -> 264.15 (+20.00%), IITL 127.68 -> 153.21 (+20.00%), UEL 153.73 -> 184.47 (+20.00%), VINDHYATEL 1985.9 -> 2383.0 (+20.00%).
- Top losers: INDOTHAI 213.43 -> 170.75 (-20.00%), ZEEL 114.55 -> 98.14 (-14.33%), XPROINDIA 1500.4 -> 1302.8 (-13.17%), NITTAGELA 1922.5 -> 1729.2 (-10.05%), EPACKPEB 267.31 -> 243.95 (-8.74%).
- PCR: Not available for this session.
Nifty 50 Support And Resistance Levels For 03 Aug 2026
Pivot levels are reference points derived from the previous session's close. They are not live intraday data. For Nifty 50: Pivot 24687.92; R1 24860.68; R2 24947.07; S1 24601.53; S2 24428.77.
A pivot is a central reference point. If the price trades above this pivot, the first resistance above it is R1 and then R2; if below, S1 is the first support and S2 is the second.
Nifty Bank Support And Resistance Levels For 03 Aug 2026
Pivot: 57987.28; R1: 58508.62; R2: 58769.28; S1: 57726.62; S2: 57205.28.
The central Pivot is the reference for Bank Nifty; use above/below to gauge intraday direction; R1 and R2 above, S1 and S2 below.


Top 5 Gainers On 03 Aug 2026
| Stock | From | To | Change |
|---|---|---|---|
| AARTISURF | 400.85 | 481.0 | +20.00% |
| ALPHAGEO | 220.13 | 264.15 | +20.00% |
| IITL | 127.68 | 153.21 | +20.00% |
| UEL | 153.73 | 184.47 | +20.00% |
| VINDHYATEL | 1985.9 | 2383.0 | +20.00% |
Top 5 Losers On 03 Aug 2026
| Stock | From | To | Change |
|---|---|---|---|
| INDOTHAI | 213.43 | 170.75 | -20.00% |
| ZEEL | 114.55 | 98.14 | -14.33% |
| XPROINDIA | 1500.4 | 1302.8 | -13.17% |
| NITTAGELA | 1922.5 | 1729.2 | -10.05% |
| EPACKPEB | 267.31 | 243.95 | -8.74% |
Market-Wide Index Options PCR
Market-wide Index Options PCR: Not available for this session.
Frequently Asked Questions
What are the Nifty 50 pivot levels for 03 Aug 2026?
Pivot: 24687.92; R1: 24860.68; R2: 24947.07; S1: 24601.53; S2: 24428.77.
What are the Nifty Bank pivot levels for 03 Aug 2026?
Pivot: 57987.28; R1: 58508.62; R2: 58769.28; S1: 57726.62; S2: 57205.28.
Who were the top gainers on 03 Aug 2026?
AARTISURF: 400.85 -> 481.0 (+20.00%), ALPHAGEO: 220.13 -> 264.15 (+20.00%), IITL: 127.68 -> 153.21 (+20.00%), UEL: 153.73 -> 184.47 (+20.00%), VINDHYATEL: 1985.9 -> 2383.0 (+20.00%).
Who were the top losers on 03 Aug 2026?
INDOTHAI: 213.43 -> 170.75 (-20.00%), ZEEL: 114.55 -> 98.14 (-14.33%), XPROINDIA: 1500.4 -> 1302.8 (-13.17%), NITTAGELA: 1922.5 -> 1729.2 (-10.05%), EPACKPEB: 267.31 -> 243.95 (-8.74%).
Is Market-wide Index Options PCR available for 03 Aug 2026?
Market-wide Index Options PCR: Not available for this session.
Conclusion
These levels are PREVIOUS SESSION closing levels used as reference points for today's trading, not live intraday data. The Nifty 50 pivot is 24687.92 with resistance at 24860.68 and 24947.07 and support at 24601.53 and 24428.77. The Bank Nifty pivot is 57987.28 with resistance at 58508.62 and 58769.28 and support at 57726.62 and 57205.28.
Watch price action around these pivot levels at the open, particularly near S1 24601.53 and R1 24860.68, and consider the five gainers and five losers from yesterday as a guide to sector momentum. For deeper stock-level insights, try Swastika's Sarthi AI stock assistant.
Open your trading and demat account here
Reference :
1 : Nseindia
Latest Articles

A Beginner's Guide to Futures and Options Trading


If you've ever wondered how investors make money by predicting the future movements of stocks, commodities, or indexes, then you're in the right place. In this beginner's guide, we'll explore what futures and options are, how they work, and how you can get started in trading them.
Understanding Futures:
Let's start with futures. A futures contract is a legal agreement to buy or sell a particular asset at a predetermined price on a specified future date. These assets can include commodities like gold, oil, or agricultural products, financial instruments like stocks or indexes, and even currencies.
How It Works:
- Suppose you believe that the price of gold will increase in the future. You can buy a gold futures contract, agreeing to purchase a specific amount of gold at a predetermined price on a set date.
- If the price of gold goes up before the contract expires, you can sell the futures contract at a profit.
- On the other hand, if the price goes down, you may incur a loss.
Key Features:
- Leverage: Futures trading involves leveraging, meaning you only need to put down a fraction of the contract's total value as a deposit, known as margin.
- Standardized Contracts: Futures contracts are standardized in terms of size, expiration date, and quality of the underlying asset, making them easily tradable on exchanges.
Risks:
While leverage can amplify gains, it can also magnify losses, so it's crucial to manage risk carefully when trading futures.
Exploring Options:
Now, let's dive into options. An option is a contract that gives the buyer the right, but not the obligation, to buy or sell an asset at a predetermined price within a specified time frame.
Types of Options:
- Call Option: Gives the buyer the right to buy the underlying asset at a predetermined price (strike price) before the expiration date.
- Put Option: Gives the buyer the right to sell the underlying asset at a predetermined price (strike price) before the expiration date.
How It Works:
- Suppose you expect the price of a stock to rise. You can buy a call option on that stock, allowing you to purchase it at a predetermined price, known as the strike price, within a specified period.
- If the stock price goes up, you can exercise your option and buy the stock at the lower strike price, selling it at the higher market price for a profit.
- If the stock price falls or remains the same, you're not obligated to exercise the option, limiting your losses to the premium paid for the option.
Key Features:
- Limited Risk: Unlike futures, where losses can be unlimited, options trading comes with limited risk. The maximum loss is limited to the premium paid for the option.
- Versatility: Options can be used for various trading strategies, including speculation, hedging, and income generation.
Risks:
- Time Decay: Options have an expiration date, and as they approach expiration, their value tends to decline due to time decay. This can erode the value of an option position, especially if the underlying asset's price doesn't move as expected.
- Getting Started: Now that you have a basic understanding of futures and options, how can you get started in trading them?
- Educate Yourself: Take the time to learn about the mechanics of futures and options trading, including the terminology, strategies, and risks involved. There are plenty of online resources, courses, and books available to help you deepen your knowledge.
- Open a Trading Account: To trade futures and options, you'll need to open a demat and trading account with a company like Swastika Investmart that offers access to these markets, has a user-friendly platform, and excellent customer support.
- Start Small: As a beginner, it's essential to start small and trade with money you can afford to lose. Begin with paper trading or small position sizes to gain experience without risking significant capital.
- Develop a Trading Plan: Define your trading goals, risk tolerance, and strategy before placing any trades. A well-thought-out trading plan will help you stay disciplined and avoid impulsive decisions.
- Stay Informed: Keep yourself updated on market news, economic indicators, and geopolitical events that can impact the prices of underlying assets. Stay flexible and be prepared to adjust your trading strategy as market conditions change.
Conclusion:
Futures and options trading can be a lucrative venture for those willing to put in the time and effort to learn. While these financial instruments offer opportunities for profit, they also come with inherent risks. By understanding the basics, developing a solid trading plan, and practicing prudent risk management, you can increase your chances of success in the futures and options trading.
Happy trading!

Maruti Suzuki Q4 FY24 Result Update
Maruti Suzuki India, announced its fourth quarter financial results (Q4FY24) on April 26:
- Net profit jumped by 48% to ₹3,878 crore in Q4 FY24.
- Total revenue from operations in Q4 FY24 grew by 19.30% year-on-year to ₹38,235 crore, compared to ₹32,048 crore in the previous year's corresponding period.
- EBITDA, a measure of operational performance, rose by 40% year-on-year to ₹4,685 crore in Q4 FY24, up from ₹3,350 crore in Q4 FY23.
- EBITDA margins for Q4 FY24 improved to 12.2% from 10.5% in the same period last year.
- The company's Board recommended a dividend of ₹125 per share for FY24, an increase from ₹90 per share in FY23.


Smart Strategies: Protecting Profits with Stop Loss and Target
Investing in the stock market can be both exciting and daunting, especially for beginners. One of the keys to successful investing is having a clear strategy for managing risk and setting realistic targets. In this blog, we'll discuss two essential concepts for every investor: Stop Loss and Target, and how mastering these can help navigate the market with confidence.
Understanding Stop Loss:
Stop Loss is a risk management tool acts as a safety net to limit your losses. It involves setting a predetermined price level at which a stock will be automatically sold to prevent further losses.
Here's how it works:
Let's say you buy shares of a company at ₹100 per share. You decide to set a Stop Loss at ₹90. If the stock price falls to ₹90 or below, your shares will be sold automatically, helping you minimize losses and preserve capital.
Why is a Stop Loss Important?
The market is unpredictable. A sudden news event or industry shift can send stock prices dropping sharply. A stop loss ensures you don't hold onto a losing position forever.
It helps you:
- Limit Losses: By exiting at a predetermined price, you prevent bigger losses if the stock continues to fall.
- Maintain Discipline: It removes emotions from the equation. You don't panic-sell at rock bottom, but stick to your plan.
- Protect Capital: Preserved capital allows you to invest in other opportunities.
Types of Stop-Loss Orders:
- Market Stop-Loss: This is the most common type of stop-loss order. It triggers a market order to sell your shares at the best available price once the stop-loss price is reached. However, keep in mind that during highly volatile market conditions, you may not always get the exact stop-loss price.
- Limit Stop-Loss: With this order, you specify a minimum price at which you're willing to sell your shares. If the stock price hits your stop-loss price, a limit order is triggered, selling your shares at or above the specified price. This provides more control over the selling price but does not guarantee execution if the price drops too quickly.
Setting Target:
Now, let's talk about the flip side profits! setting a target allows investors to lock in profits and define the desired outcome of a trade. A Target is the price level at which an investor aims to sell a stock to realize gains. It helps investors maintain discipline and avoid getting greedy or holding onto positions for too long.
How it works:
- You buy shares of XYZ Ltd. at ₹150, expecting them to rise.
- You set a target price of ₹200.
- Once the price reaches ₹200 or above, your broker can sell your shares automatically (using a market or limit order).
Why is a Target Price Important?
Greed can be a powerful emotion. You might wait for a higher price, only to see the stock price fall. A target price helps you:
- Book profits: It ensures you don't miss out on gains by waiting too long.
- Plan your next move: Secure profits and use them to invest in other opportunities.
- Manage risk-reward: It balances the potential for higher gains with the risk of missing out if the price dips.
Target Price Explained
- Taking Profits: Selling your shares to realize your gains.
- Profit Target: The specific price point at which you aim to sell for a profit.
Types of Target Orders:
- Limit Target: Similar to a limit stop-loss order, a limit target order allows you to specify a minimum price at which you're willing to sell your shares once the target price is reached. This gives you control over the selling price but may not guarantee execution if the price moves quickly.
- Market Target: This order triggers a market order to sell your shares at the best available price once the target price is reached. While it ensures execution, you may not always sell at your desired price, especially during volatile market conditions.
Setting Stop Loss and Target Prices: A Practical Guide
Now that we understand the basics let's explore some tips for setting effective stop loss and target prices:
- Technical Analysis: Use tools like charts and indicators to identify potential support and resistance levels (areas where the price tends to bounce back or stall). This can help you set realistic stop loss and target prices.
- Risk Tolerance: How much loss are you comfortable with? A conservative investor might set a tighter stop loss, while a more aggressive investor might allow for more wiggle room.
- Reward-to-Risk Ratio: Aim for a target price that offers at least double the potential loss from your stop loss. For example, if your stop loss is ₹10, aim for a target price of at least ₹20 profit.
- Adapt to Market Conditions: Market conditions can change rapidly, so it's essential to adjust your Stop Loss and Target levels accordingly. Stay updated on news, events, and market trends that may impact your investments.
- Stick to Your Plan: Once you've set your Stop Loss and Target levels, stick to your plan. Avoid emotional decision-making and trust your analysis. Remember that losses are a part of investing, and it's crucial to manage them effectively.
- Regularly Review and Reassess: As market conditions evolve, regularly review your Stop Loss and Target levels to ensure they remain relevant. Be flexible and willing to adjust your strategy as needed.
Example
You invest ₹5,000 in 25 shares of PQR Ltd. at ₹200 per share. Here's how to use stop loss and target price:
- Stop Loss: Considering a 10% potential loss, you set a stop loss at ₹180. This protects your capital.
- Target Price: Based on technical analysis and market trends, you set a target price of ₹250. This offers a potential 25% profit.
- Order Types: You choose limit orders for both stop loss and target price. This ensures your shares are sold only at your desired price points or better.
Scenario 1: Profit Taking
The price of PQR Ltd. rises, reaching ₹260. Your limit order for the target price gets triggered, and your shares are sold automatically. Here's the breakdown:
- Selling Price: ₹260 per share
- Profit per Share: ₹260 - ₹200 = ₹60
- Total Profit: ₹60/share * 25 shares = ₹1,500
Scenario 2: Cutting Losses
Unfortunately, the market takes a downturn, and PQR Ltd.'s price falls sharply. Your stop loss order activates at ₹180, limiting your losses. Here's the breakdown:
- Selling Price: ₹180 per share
- Loss per Share: ₹200 - ₹180 = ₹20
- Total Loss: ₹20/share * 25 shares = ₹500
Even though the price dropped, your stop loss prevented a bigger loss. This saved capital can be used for future investments.
- Remember: These are simplified scenarios. Market movements can be unpredictable.
Beyond the Basics: Advanced Techniques
As you gain experience, consider exploring these advanced techniques:
- Trailing Stop Loss: This dynamically adjusts your stop loss as the price goes up, locking in profits while allowing for some price fluctuations.
- Trailing Target: This increases your target price as the stock rises, aiming to capture even higher gains.
Conclusion:
Stop loss and target price are not guarantees, but they are powerful tools for managing risk and maximizing returns. By understanding and applying these concepts, you'll become a more confident and informed investor in the dynamic Indian stock market. Remember, successful investing is a marathon, not a sprint. Discipline, risk management, and continuous learning are key to achieving your financial goals.
Happy Investing!

Positional Trading in the Stock Market: Understanding the Basics
In the dynamic world of the stock market, traders employ various strategies to capitalize on market movements and generate profits. One such strategy that has gained popularity among traders is positional trading. But what exactly is positional trading, and how does it differ from other trading approaches? In this blog, we'll break down the basics of positional trading in simple language, exploring its meaning, strategies, and key differences from other trading styles.
What is Positional Trading?
Positional trading is a trading strategy where traders hold positions in stocks or other financial instruments for an extended period, typically ranging from several days to several weeks or even months. Unlike day trading, which involves buying and selling securities within the same trading day, positional traders aim to capture larger price movements over a more extended timeframe.
Understanding the Positional Trade Meaning
In positional trading, traders take positions in anticipation of sustained price movements in the market. They base their trades on thorough analysis of market trends, technical indicators, and fundamental factors, aiming to ride the trend for maximum profit potential. Positional traders are less concerned with short-term fluctuations and focus instead on the broader market direction.
Positional Trading Strategy
Positional traders employ a variety of strategies to identify profitable trading opportunities. Some common positional trading strategies include:
- Trend Following: Positional traders identify market trends and enter positions in the direction of the trend. They use technical indicators such as moving averages, trendlines, and momentum oscillators to confirm the trend and determine entry and exit points.
- Breakout Trading: Positional traders look for breakout opportunities, where a stock or market breaks out of a trading range or consolidation pattern. They enter positions when the price breaks above resistance levels or below support levels, expecting the breakout to lead to a sustained price move.
- Swing Trading: While swing trading and positional trading is similar in some respects, positional traders typically hold their positions for a more extended period compared to swing traders. Swing traders aim to capture short-to-medium-term price swings within the broader market trend.
Position vs. Holding: Clarifying the Difference
In the context of trading, the term "position" refers to the specific securities or contracts that a trader holds in their portfolio at any given time. It represents the trader's exposure to the market and can include both long (buy) and short (sell) positions. "Holding," on the other hand, refers to the act of retaining ownership of securities over an extended period, irrespective of short-term price movements.
Open Position in Stock Market and Trading
An open position in the stock market or trading refers to a trade that has been initiated but not yet closed. It represents the trader's current exposure to the market and can result in either profits or losses depending on subsequent price movements. Traders may choose to close their open positions to realize gains or cut losses.
Positional Trading vs. Swing Trading
While both positional trading and swing trading aim to capture trends in the market, there are some key differences between the two approaches. Positional trading involves holding positions for a more extended period, often weeks or months, to capitalize on broader market trends. In contrast, swing trading typically involves holding positions for a shorter duration, ranging from a few days to a few weeks, to capture shorter-term price swings within the trend.
Conclusion
Positional trading offers traders the opportunity to capitalize on sustained market trends and generate profits over the medium to long term. By understanding the basics of positional trading, employing effective trading strategies, and managing risk appropriately, traders can harness the power of this approach to achieve their financial goals. Whether you're a seasoned trader or just starting, incorporating positional trading into your trading arsenal can provide you with a valuable tool for navigating the dynamic world of the stock market.
Remember, successful positional trading requires patience, discipline, and a thorough understanding of market dynamics. Stay informed, stay focused, and stay committed to your trading plan as you embark on your positional trading journey. With diligence and perseverance, you can unlock the potential of positional trading and take your trading to new heights.
Happy trading!

Future Trading in India
Ever wished you could lock in a stock price today to buy or sell it later? That's futures trading in a nutshell! It's like making a deal beforehand, saying "I'll buy this stock at ₹17,000 in 2 months," no matter what the price actually is then.
What are Futures Contracts and Why Do They Matter?
Imagine a contract that allows you to agree on a price today to buy or sell a specific asset (like a stock index) at a predetermined future date.
Why Futures?
- Boost your gains: If the stock price goes up, you can buy it at the lower locked-in price and sell it higher for a sweet profit!
- Protect yourself: Worried a stock might crash? Buy a futures contract to lock in a selling price so you don't lose too much.
- Hedge against price fluctuations: Protect your stock portfolio by locking in a selling price (if you expect prices to fall) or a buying price (if you expect prices to rise).
- Speculate on price movements: Profit from anticipating future price movements of stocks or indices.
Buying vs. Selling Futures
- Imagine a contract: This agreement says you'll buy or sell a stock (or a group of stocks like Nifty 50) at a set price by a certain date (expiry).
- Margin Money: Like a deposit you give your broker to hold your spot in the deal. It's usually a percentage of the total contract value (e.g., ₹85,000 for a Nifty 50 contract at ₹17,000).
- Lot Size: The number of shares or index points in a single contract (e.g., 50 for Nifty 50).
- Buying: You think a stock (like Nifty 50) will go up. You buy a futures contract at today's price (₹17,000). If it goes up by expiry, you buy at the lower price and sell at the higher market price, making a profit!
- Selling: You think a stock will go down. You sell a futures contract, locking in a selling price. If it goes down by expiry, you can sell at the higher locked-in price, making a profit! (But if it goes up, you'll lose money).
Getting Started:
- Pick a Broker: Find a trustworthy one registered with the Indian stock exchanges (NSE or BSE) that allows futures trading.
- Open a Futures Account: This is different from your regular stock account. Make sure you understand the margin requirements.
- Trading Tools: Use your broker's platform to analyze charts and make informed decisions.
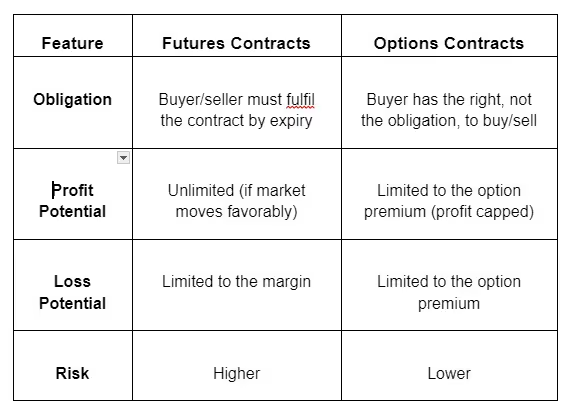
Futures vs. Options: A Quick Comparison
While both futures and options are derivative instruments, key differences exist:
Role of Margin:
A deposit required by the broker, typically a percentage of the contract value, to initiate a futures trade. It acts as a good faith deposit and reduces counterparty risk. (Example: A Nifty 50 contract with a lot size of 50 and a current price of ₹17,000 might require a 10% margin, which translates to ₹85,000).
Let's analyze a hypothetical futures trade to understand the concepts better:
Scenario: You believe the price of Reliance Industries (RIL) will rise due to an upcoming positive earnings report. On 1st March 2024, you buy a Reliance Futures contract (expiry date: 30th April 2024) at a price of ₹2,500 per share. The lot size for Reliance futures is 100 shares, and your broker requires a 15% margin.
Calculations:
- Contract Value (per lot) = Price per Share * Lot Size = ₹2,500 * 100 = ₹2,50,000
- Margin Required (per lot) = 15% of Contract Value = ₹2,50,000 * 15/100 = ₹37,500
Outcome 1: Successful Trade
- By April 30th, the Reliance share price rises to ₹2,800.
- You exercise your right to buy 100 shares at the contracted price of ₹2,500 and immediately sell them at the market price of ₹2,800.
- Profit per share = ₹2,800 - ₹2,500 = ₹300
- Total Profit (excluding brokerage) = Profit per share * Lot size = ₹300 * 100 = ₹30,000
Outcome 2: Unsuccessful Trade
- By April 30th, the Reliance share price falls to ₹2,200.
- You incur a loss, as you're obligated to buy at ₹2,500. The contract is settled in cash, and you realize a loss of ₹300 per share (₹2,500 - ₹2,200).
- Total Loss (excluding brokerage) = Loss per share * Lot size = ₹300 * 100 = ₹30,000
Choosing the Right Futures Contract
With thousands of futures contracts available in the market, it's essential to choose the right one for your trading strategy.
Consider factors such as liquidity, volatility, and expiration dates when selecting a contract. For example, if you're interested in trading agricultural commodities, you might consider contracts for wheat, rice, or soybeans.
Risk Management Strategies
- Risk management is crucial in futures trading to protect your capital and minimize losses.
- Set stop-loss orders to limit potential losses and avoid over-leveraging your positions.
- Diversify your portfolio across different asset classes to spread risk and protect against market downturns.
- Only invest a portion of your money you can afford to lose. Futures trading can be risky!
- Place Stop-loss Orders as they are like an automatic brakes system, these help limit your losses if the price goes against you.
- Learn to read charts to understand past price movements and make better predictions.
The Takeaway:
Futures trading can be a thrilling way to potentially multiply your gains in the Indian stock market. But always prioritize knowledge, manage risks, and never invest more than you can afford to lose.
Happy trading!

Bracket Order vs. Cover Order: A Beginner's Guide to Trading Strategies
Introduction:
Welcome to the world of stock market trading! If you're just starting out, you might feel overwhelmed by all the different terms and strategies. Two strategies you might hear about are Bracket Orders and Cover Orders. In this easy-to-understand guide, we'll explore what these strategies are, how they work, and when you might use them.
Understanding Bracket Orders:
Imagine you're at a carnival playing a game where you have to knock over targets. You set up your throw, and if you hit the target, you win a prize. But you also set up a safety net behind the targets just in case you miss.
That safety net is a bit like a Bracket Order in trading. Here's how it works:
- Initial Order: This is your main trade. It's like saying, "I want to buy this stock at this price.
- Profit Target Order: This is your goal. You decide how much profit you want to make, and if the stock reaches that price, your trade automatically sells to lock in your profit.
- Stop-Loss Order: This is your safety net. If the stock starts going the wrong way and hits a price you're not comfortable with, your trade automatically sells to limit your losses.
Imagine you want to buy shares of a company called XYZ, which is currently selling for ₹100 per share. You set up a Bracket Order like this:
- Initial Buy Order: ₹100 per share
- Profit Target Order: ₹110 per share
- Stop-Loss Order: ₹90 per share
If the stock goes up to ₹110, you sell and make a profit. If it drops to ₹90, you sell to prevent big losses. Otherwise, your initial order stays active until you cancel it.
Understanding Cover Orders:
Now, let's talk about Cover Orders. Think of it like going to a restaurant and ordering a meal with a backup plan. Here's how it works:
- Market Order: This is your main trade. You're saying, "I want to buy or sell this stock at the current market price.
- Stop-Loss Order: This is your backup plan. If things don't go as expected and the stock starts going the wrong way, your trade automatically sells to limit your losses.
Imagine you want to buy shares of XYZ, currently selling for ₹150 per share. You set up a Cover Order like this:
- Market Buy Order: ₹150 per share
- Stop-Loss Order: ₹140 per share
If the stock drops to ₹140 or below, your trade automatically sells to prevent further losses. Otherwise, your market order executes at the current price.
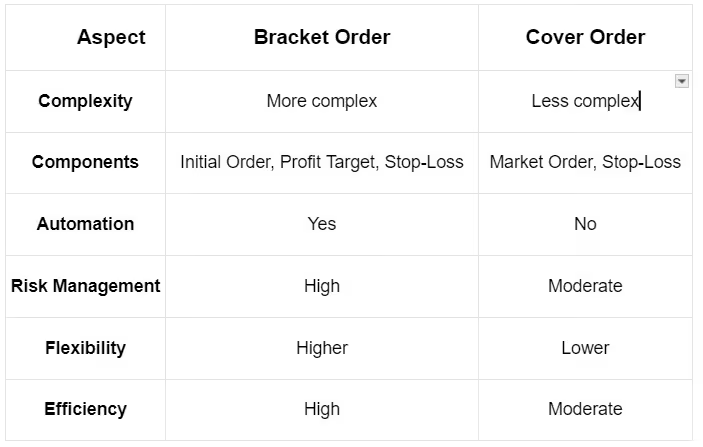
Comparison: Bracket Order vs. Cover Order
Let's compare these two strategies in simple terms:
Conclusion:
Both Bracket Orders and Cover Orders are like safety nets for your trades, helping you manage risks in different ways. Bracket Orders are more like setting specific goals with backup plans, while Cover Orders are more straightforward with a backup plan only.
As a beginner, it's essential to understand these strategies and when to use them. Whether you're aiming for specific goals with Bracket Orders or seeking simplicity with Cover Orders, always remember to manage your risks and make informed decisions.
Big Budget


Popular Articles





.avif)
.avif)

.avif)



START YOUR INVESTMENT JOURNEY
Get personalized advice from our experts
- Dedicated RM Support
- Smooth and Fast Trading App
