


Nifty 50 31 Jul 2026 Morning Market Summary


Key Takeaways
- Prev session close reference: Nifty 50 Pivot 24370.9; R1 24442.1; R2 24500.6; S1 24312.4; S2 24241.2.
- Standout mover: TRANSPEK from 1101.1 -> 1321.3 (+20.00%).
- Biggest loser: NARMADA from 36.19 -> 17.02 (-52.97%).
- Market-wide Index Options PCR: Not available for this session.
Nifty 50 Support And Resistance Levels For 31 Jul 2026
Pivot: 24370.9; R1: 24442.1; R2: 24500.6; S1: 24312.4; S2: 24241.2. The Pivot is the central reference; R1 and R2 above are resistance hurdles, while S1 and S2 below are cushions. All these numbers come from yesterday's close as the basis for today's session.
In plain language, if the price sits above R1, the near-term tone is mildly bullish; above R2, the bias could extend higher; if it slips below S2, the bias could turn bearish. For deeper stock-level insights, Swastika's Sarthi AI stock assistant.
Nifty Bank Pivot Levels For 31 Jul 2026
Pivot: 57271.9; R1: 57404.2; R2: 57543.55; S1: 57132.55; S2: 57000.25. Those levels mirror the same logic as Nifty 50 for the Bank Nifty.


Top 5 Gainers (31 Jul 2026 Session, EQ Series, Liquid Names Only)
| Ticker | From | To | Change |
|---|---|---|---|
| TRANSPEK | 1101.1 | 1321.3 | (+20.00%) |
| UEL | 128.11 | 153.73 | (+20.00%) |
| YASHO | 3215.6 | 3858.7 | (+20.00%) |
| RSDFIN | 92.29 | 110.74 | (+19.99%) |
| DCI | 276.75 | 329.7 | (+19.13%) |
Top 5 Losers (31 Jul 2026 Session, EQ Series, Liquid Names Only)
| Ticker | From | To | Change |
|---|---|---|---|
| NARMADA | 36.19 | 17.02 | (-52.97%) |
| EXPLEOSOL | 906.6 | 802.85 | (-11.44%) |
| THANGAMAYL | 5807.0 | 5226.5 | (-10.00%) |
| ASIANTILES | 60.71 | 54.68 | (-9.93%) |
| SIGNPOST | 311.2 | 283.55 | (-8.88%) |
Market-Wide Index Options PCR
Market-wide Index Options PCR: Not available for this session.
Frequently Asked Questions
Nifty 50 Support and Resistance Levels for 31 Jul 2026
Pivot 24370.9; R1 24442.1; R2 24500.6; S1 24312.4; S2 24241.2. These are reference points for today's trading, derived from yesterday's close.
Nifty Bank Pivot Levels for 31 Jul 2026
Pivot 57271.9; R1 57404.2; R2 57543.55; S1 57132.55; S2 57000.25. These are yesterday's close-based reference levels for today.
Top Gainers on 31 Jul 2026
TRANSPEK: 1101.1 -> 1321.3 (+20.00%); UEL: 128.11 -> 153.73 (+20.00%); YASHO: 3215.6 -> 3858.7 (+20.00%); RSDFIN: 92.29 -> 110.74 (+19.99%); DCI: 276.75 -> 329.7 (+19.13%).
Top Losers on 31 Jul 2026
NARMADA: 36.19 -> 17.02 (-52.97%); EXPLEOSOL: 906.6 -> 802.85 (-11.44%); THANGAMAYL: 5807.0 -> 5226.5 (-10.00%); ASIANTILES: 60.71 -> 54.68 (-9.93%); SIGNPOST: 311.2 -> 283.55 (-8.88%).
PCR for Market-wide Index Options today
Market-wide Index Options PCR: Not available for this session.
Conclusion
Yesterday's close reference levels set the stage for today's open. Nifty 50 pivot at 24370.9 with R1 24442.1 and R2 24500.6; S1 24312.4; S2 24241.2. The standout mover TRANSPEK posted a 20% gain while NARMADA slid 52.97% from 36.19 to 17.02. Market-wide Index Options PCR remains not available for this session. Watch how price interacts with the pivot and resistance/support on open, and consider exploring deeper stock-level insights with Swastika's Sarthi AI stock assistant.
Open your trading and demat account here
Reference :
1 : Nseindia
Latest Articles

A Comprehensive Guide to Choosing the Best Mutual Fund Investments


Introduction:
Investing in mutual funds can be a game-changer in your financial journey. It offers a diversified portfolio managed by professionals, making it an attractive option for both seasoned investors and beginners alike. However, with so many mutual fund options available in the Indian market, selecting the right ones can be very difficult.
Understanding Mutual Funds:
Before diving into the selection process, let's understand the basics of mutual funds. A mutual fund pools money from numerous investors to invest in a diversified portfolio of stocks, bonds, or other securities. These funds are managed by experienced fund managers who make investment decisions based on the fund's objectives.
Types of Mutual Funds:
Mutual funds come in various types, each catering to different investment objectives and risk profiles.
- Equity Funds: These funds primarily invest in stocks, aiming for capital appreciation over the long term. They offer higher potential returns but come with increased volatility.
- Debt Funds: Debt funds invest in fixed-income securities like government bonds, corporate bonds, and treasury bills. They are relatively less risky than equity funds and provide stable returns.
- Hybrid Funds: Also known as balanced funds, hybrid funds invest in a mix of equities and debt instruments to balance risk and return. They offer diversification and are suitable for investors seeking a balanced portfolio.
- Index Funds: Index funds replicate the performance of a specific market index like the Nifty 50 or Sensex. They aim to match the returns of the index they track and typically have lower expense ratios.
- Sector Funds: Sector funds focus on specific sectors like technology, healthcare, or banking. They offer the opportunity to invest in a particular industry but come with higher sector-specific risks.
- Tax-saving Funds (ELSS): Equity Linked Savings Schemes (ELSS) are tax-saving mutual funds that offer tax benefits under Section 80C of the Income Tax Act. They have a lock-in period of three years and primarily invest in equities.
Assessing Your Risk Tolerance:
Before selecting mutual funds, it's crucial to assess your risk tolerance. Your risk tolerance is influenced by factors like your investment goals, time horizon, and financial situation. Here's a simple risk assessment to help you gauge your risk appetite:
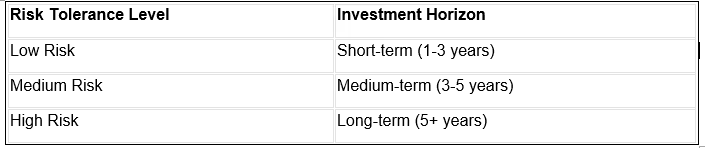
Once you determine your risk tolerance level, you can align it with suitable mutual fund categories. For example, if you have a long-term investment horizon and a high risk tolerance, equity funds may be suitable for you.
Analyzing Fund Performance:
Past performance is often considered an essential factor in selecting mutual funds. While historical performance doesn't guarantee future results, it provides insights into how the fund has performed in different market conditions. When analyzing fund performance, consider the following metrics:
- Annualized Returns: Look at the fund's annualized returns over different time periods (1-year, 3-year, 5-year, and since inception). Compare the fund's performance against its benchmark index and peers in the same category.
- Risk-adjusted Returns: Assess the fund's risk-adjusted returns using measures like Sharpe Ratio and Sortino Ratio. These ratios consider both returns and volatility, providing a more comprehensive view of performance.
- Expense Ratio: Pay attention to the fund's expense ratio, which represents the annual fees charged by the fund house for managing the fund. Lower expense ratios translate to higher returns for investors.
- Portfolio Composition: Evaluate the fund's portfolio holdings to understand its asset allocation, sector exposure, and top holdings. Ensure that the fund's investment strategy aligns with your investment objectives.
- Fund Manager's Track Record: Consider the track record and experience of the fund manager. A skilled and experienced fund manager can add value to the fund's performance through strategic decision-making.
Selecting Top-performing Funds:
Know Yourself: Your Investment Goals and Risk Appetite
Before you dive into the world of mutual funds, it's crucial to understand your own financial situation. Here are two key factors to consider:
• Investment Goals: What are you saving for? A fancy new phone (short-term) or retirement (long-term)? Different goals have different time horizons, which will influence your fund choices.
• Risk Appetite: How comfortable are you with your money going up and down? Higher potential returns often come with higher risk.
Here's a table to help you understand the relationship between risk appetite, time horizon, and suitable fund types:

Remember: This is a general guideline. There are many different types of mutual funds within each category, so do your research!
Do Your Research: Picking the Winning Fund
Now that you know your risk profile and goals, it's time to find the perfect mutual fund. Here are some key things to look for:
- Performance: Check the fund's track record over different time periods (1 year, 3 years, 5 years) and compare it to similar funds and a benchmark index like the Nifty 50. Past performance isn't a guarantee of future results, but it gives you a sense of the fund manager's skills.
- Expense Ratio: As mentioned earlier, a lower expense ratio means more money stays invested in the fund and grows for you.
- Fund Manager's Experience: Research the fund manager's experience and track record. Are they known for making sound investment decisions?
Here's an example: Let's say you're 25 years old and have a high-risk appetite. Your goal is retirement, which is a long-term goal (20+ years). Based on this, you might consider an equity fund that invests in a mix of large-cap and mid-cap companies. You'd then compare different equity funds based on their performance, expense ratio, and the experience of the fund manager.
Once you've analyzed the performance of various mutual funds, shortlist the top-performing funds that align with your risk profile and investment goals. Here's a step-by-step guide to selecting the best mutual funds:
Step 1: Define Your Investment Goals: Determine your investment objectives, whether it's wealth creation, retirement planning, tax-saving, or income generation.
Step 2: Assess Your Risk Tolerance: Evaluate your risk tolerance based on your investment horizon and financial situation.
Step 3: Research Mutual Fund Categories: Understand the different types of mutual funds and their risk-return profiles.
Step 4: Analyze Fund Performance: Review the historical performance, risk-adjusted returns, expense ratio, and portfolio composition of shortlisted funds.
Step 5: Diversify Your Portfolio: Build a diversified portfolio by investing in a mix of equity, debt, and hybrid funds to spread risk.
Step 6: Monitor Your Investments: Regularly review your portfolio's performance and make adjustments if necessary to stay on track with your investment goals.
Conclusion:
Choosing the best mutual funds requires careful consideration of various factors, including your investment goals, risk tolerance, and fund performance. By following the tips outlined in this blog, you can make informed decisions and build a robust mutual fund portfolio that helps you achieve your financial aspirations. Remember, investing is a journey, and staying disciplined and patient is key to long-term success. Happy investing!
Options vs. Futures: Understanding the Basics
Introduction:
Options and futures are two commonly traded financial instruments that offer investors opportunities for profit and risk management in the financial markets. While both options and futures involve contracts to buy or sell assets at specified prices on predetermined dates, they operate in separate ways and cater to different investment strategies. Understanding the differences between options and futures is essential for investors seeking to navigate these markets effectively and make good decisions about their investment portfolios. In this blog, we'll explore the key characteristics of options and futures, their respective advantages and disadvantages, and how they can be utilized in various trading strategies. Whether you're a beginner or an experienced trader, gaining a clear understanding of options and futures can empower you to make more confident and strategic investment decisions. So, let’s break down the basics of options and futures to help you understand how they differ.
What are Options?
Options are contracts that give the buyer the right, but not the obligation, to buy or sell an asset at a predetermined price (called the strike price) on or before a specified date (called the expiration date).
There are two types of options: call options and put options.
- Call Options: A call option gives the buyer the right to buy the underlying asset at the strike price before the expiration date. Let’s take an example, imagine you're interested in purchasing a call option for 100 shares of Company XYZ at a strike price of Rs.50 per share. If the stock price of Company XYZ rises above Rs.50 before the expiration date, you can exercise your option to buy the shares at the lower strike price.
- Put Options: A put option gives the buyer the right to sell the underlying asset at the strike price before the expiration date. For example, suppose you buy a put option for 100 shares of Company ABC at a strike price of Rs.60 per share. If the stock price of Company ABC falls below Rs.60 before the expiration date, you can exercise your option to sell the shares at the higher strike price.
What are Futures?
Futures, on the other hand, are contracts that obligate the buyer to purchase or sell an asset (such as a commodity or financial instrument) at a predetermined price on a specified date in the future. Futures contracts are standardized and traded on organized exchanges.
Consider a farmer who wants to lock in the price of wheat for next year's harvest. They could enter into a futures contract to sell a certain amount of wheat at a specified price per bushel. This allows the farmer to hedge against the risk of falling wheat prices.
Key Differences:
- Obligation: Options give the buyer the right, but not the obligation, to buy or sell the underlying asset, while futures contracts obligate the buyer to fulfill the terms of the contract.
- Flexibility: Options provide more flexibility because the buyer can choose whether or not to exercise the contract. Futures contracts have no such flexibility; they must be fulfilled according to the terms of the agreement.
- Risk: Options involve less risk for the buyer because they only risk losing the premium paid for the option. Futures contracts, on the other hand, expose the buyer to unlimited risk if the market moves against them.
Conclusion:
In summary, options and futures are both types of financial contracts, but they operate in different ways. Options provide the buyer with the right, but not the obligation, to buy or sell an asset, while futures contracts obligate the buyer to fulfill the terms of the contract. Understanding the differences between options and futures can help you make more thoughtful decisions when trading in the financial markets.

Day Trading vs. Swing Trading
When it comes to trading in the stock market, there are different strategies that investors can adopt based on their goals, time commitment, and risk tolerance. Two popular methods are Day Trading and Swing Trading. Both have their own merits and are suitable for different types of traders.
1. Time Frame
Day Trading: Day trading involves buying and selling financial instruments within the same trading day. Traders close all their positions before the market closes to avoid the risk associated with overnight price movements. This approach is ideal for those who thrive on quick decisions and can dedicate the entire trading day to monitor the market.
- Example: A day trader might buy shares of Reliance Industries in the morning when the price dips, and sell them later in the day when the price spikes, all within the same trading session.
Swing Trading: Swing trading, on the other hand, involves holding positions for several days or even weeks. The goal is to capture short- to medium-term price movements. Swing traders are less concerned with daily price fluctuations and more focused on the overall trend.
- Example: A swing trader might hold onto Tata Motors shares for a few weeks, aiming to profit from an expected uptrend after a positive earnings report.
2. Trading Style
Day Trading: Day trading requires quick decision-making and focuses on short-term price fluctuations. Traders often rely heavily on technical analysis, using intraday charts to spot opportunities. It’s a fast-paced trading style that demands constant attention.
Swing Trading: Swing trading offers a more relaxed approach. Traders analyze longer-term charts and trends, allowing them to take advantage of broader market movements. Both technical analysis and fundamental analysis can be used to identify potential trades.
- Example: A swing trader might look at the overall market sentiment and company fundamentals to decide whether to hold onto Infosys shares for several weeks during a positive market trend.
3. Risk and Reward
Day Trading: With day trading, the potential for both gains and losses is higher due to the rapid pace of trading. The frequent buying and selling can lead to significant profits, but also substantial losses if the market moves against you. Therefore, strict risk management is essential.
- Example: If a day trader bets on HDFC Bank shares expecting a quick rise but the stock instead drops sharply, they could face significant losses if they don't exit the position quickly.
Swing Trading: Swing trading generally involves less intense risk per trade, as the holding period allows for price recovery. However, the returns might be lower compared to day trading, as swing traders aim for steady growth over time rather than quick profits.
- Example: A swing trader holding ICICI Bank shares might see moderate gains over a few weeks, which are less risky compared to the high-stakes, rapid gains (or losses) of day trading.
4. Time Commitment
Day Trading: Day trading demands full-time attention. Traders need to monitor the market continuously throughout the trading day, which can be mentally and physically taxing. It’s almost like having a full-time job where every minute counts.
Swing Trading: Swing trading is more flexible, allowing traders to analyze the market at their convenience. They only make trades when they see an opportunity, making it more suitable for those who cannot dedicate the entire day to trading.
- Example: A swing trader could review the market for 30 minutes after work, decide to hold Axis Bank shares for the next two weeks, and then revisit the trade later, allowing them to balance trading with other commitments.
5. Tools and Techniques
Day Trading: Day traders use a variety of technical indicators such as moving averages, Relative Strength Index (RSI), and Moving Average Convergence Divergence (MACD). They also rely on patterns like candlestick charts to make quick trading decisions.
- Example: A day trader might use the RSI to determine if Bharti Airtel shares are overbought or oversold within the day, helping them decide when to enter or exit a trade.
Swing Trading: Swing traders focus on broader trends, using support and resistance levels, trendlines, and momentum indicators. Their analysis spans over days or weeks rather than minutes or hours.
- Example: A swing trader might use trendlines to identify the upward trajectory of Maruti Suzuki shares, planning to hold until the trend shows signs of reversing.
Conclusion
Day Trading and Swing Trading are both viable strategies, but they cater to different types of traders. Day trading is for those who enjoy fast-paced action and can commit their full attention

A Guide to T+0 Settlement Cycle Trading in India
The way trades are settled in the financial industry has changed over time. In the past, it used to take weeks for transactions to be completed. But now, thanks to improvements in technology and how things are done, settlements happen much faster. Here is history of how trade settlements took time:
- Pre-2001 (exact year unknown): T+5 settlement for most stocks in India.
- December 2001: T+5 settlement applies to all stocks in India.
- April 2002: Settlement cycle reduces to T+3 for stocks in India.
- April 2003: T+2 settlement becomes the standard for stocks in India.
- January 2022 (optional): Stock exchanges in India allowed to offer T+1 settlement for certain securities.
Now, regulators like the Securities and Exchange Board of India (Sebi) are pushing for even faster settlements, like "T+0," where transactions are settled on the same day as the trade. This change will start with a test run for a small number of stocks and brokers. Overall, these improvements make trading smoother, safer, and more efficient for everyone involved.
What is Trade Settlement?
Trade Settlement is like closing a deal in the world of trading. When you buy or sell stocks, bonds, or other financial assets, the trade isn't finalized immediately. Trade settlement is the process of making sure everything is squared away and both parties involved in the trade have fulfilled their obligations.
What is T+0?
Normally, when you buy a stock, it takes a few days (usually 2 days, hence T+2) for the settlement to happen. This means you can't sell the stock or access the money until then. T+0 changes this! With T+0 trades, the settlement happens on the same day, allowing you to receive the money and trade the stock freely by the end of the trading session.
How does T+0 trading work?
T+0 trades happen during a shorter trading session in the morning (9:15 am - 1:30 pm). There are no pre-opening sessions or special auctions for these stocks. To identify T+0 stocks, look for a "#" symbol added to the stock code.
What about price limits?
T+0 stocks have price bands to manage volatility. The price can only move up or down by 1% compared to the previous day's closing price of the regular (T+2) stock. This band adjusts throughout the day based on price movements.
How will it be implemented?
SEBI has proposed that the new settlement process will be implemented in two phases in the first phase an optional t plus 0 settlement cycle is proposed for trades until 1:30 p.m. with the settlement of funds and securities to be completed on the same day by 4:30 p.m
In the second phase an optional immediate trade settlement for funds and securities will be introduced allowing trading until 3:30 p.m. after the implementation of this phase 1
Which stocks can I trade with T+0?
List of securities for Trading in T+0 rolling settlement cycle in Equity Segment
The introduction of T+0 settlement in India is a significant development for the stock market. Here's a breakdown of the potential impacts, both positive and negative:
Potential Benefits:
Faster Trades: T+0 settlements mean money moves quickly, so we can react faster to changes in the market. This helps things run smoother.
- More Money Available: With T+0, cash that was tied up in trades becomes available sooner. This means there's more money flowing around, which can make it easier to buy and sell stuff like stocks.
- Less Risk: Since trades settle on the same day, there's less chance of someone not being able to pay up. This makes the whole system safer. Good for Quick Traders: If you're someone who buys and sells stocks on the same day, T+0 is great for you. It lets you move fast and maybe make more money.
- Get Your Money Quicker: Instead of waiting for T+2 to get your cash from trades, you get it on the same day with T+0. This makes it easier to manage your money and maybe invest more.
Potential Challenges:
- More Ups and Downs: Because T+0 stocks have tighter price limits, they can jump around more during the day. This might be scary for people who aren't used to it.
- Stuff Might Go Wrong: Brokers and stock exchanges might have trouble handling all the extra trades and faster settlements with T+0. There could be some bumps in the road as they figure it out.
- Not Many Choices: Right now, there aren't a lot of stocks available for T+0 trading. So, your options might be limited at first, even though more choices should come later.
- Watch Out for Tricks: Faster settlements might make it easier for people to cheat the system, like with pump-and-dump schemes. We need to make sure everyone plays fair.
Overall, the impact of T+0 is likely to be positive for the Indian stock market in the long run. However, careful monitoring and adjustments might be necessary to address potential challenges and ensure a smooth transition.
It's important to note that T+0 is a new feature, and its full impact will become clearer over time. Investors and traders should carefully consider their risk tolerance and trading strategies before participating in T+0 trades.
Who Should Consider T+0 Trading?
T+0 trading can be beneficial for:
- Active Traders: If you frequently trade stocks and look for short-term opportunities, T+0's flexibility and faster settlements can be advantageous.
- Day Traders: The ability to buy and sell stocks within the same day aligns perfectly with a day trader's strategy.
- Investors Seeking Faster Liquidity: If you need quicker access to your funds after selling stocks, T+0 settlements can be a welcome change.
Are there any other things to know?
- There's no separate closing price for T+0 stocks. They use the closing price of the corresponding T+2 stock at the end of the day.
- Block deals (large trades between two parties) are not allowed for T+0 stocks.
- T+0 trades are not included in index calculations.
How can I learn more?
This is a new feature, so talk to your broker for more details and any specific requirements they might have.

Common Mistakes to Avoid in Equity Trading: A Guide to Success
Are you diving into the world of equity trading? Exciting, isn't it? But before you jump in headfirst, let's talk about some common pitfalls that many traders encounter. These mistakes can cost you dearly if left unchecked. However, fear not! We're here to guide you through these mistakes and help you navigate them successfully.
Emotional Trading
One of the biggest traps traders fall into is letting emotions rule their decisions. Fear and greed can cloud judgment, leading to impulsive trades and unnecessary risks. To overcome this, stick to a well-defined trading plan and set clear entry and exit points. Take a step back and analyze the situation objectively before making any decisions.
Lack of Research
Trading blindly without proper research is a recipe for disaster. Many traders skip the due diligence phase and rely on tips or hearsay, which rarely ends well. Make it a habit to thoroughly research the companies you're investing in, understand their financial health, industry trends, and potential catalysts. Knowledge is your best defense against losses.
Overtrading
Trading too frequently can eat into your profits through commissions and fees, not to mention the increased risk of making mistakes. Avoid the temptation to trade excessively and focus on quality over quantity. Be patient and wait for high-probability opportunities that align with your trading strategy.
Ignoring Risk Management
Protecting your capital should be your top priority as a trader. Yet, many overlook the importance of proper risk management. Never risk more than you can afford to lose on any single trade, and consider implementing stop-loss orders to limit potential losses. Diversifying your portfolio can also help spread risk across different assets.
Chasing Performance
It's easy to get caught up in the hype surrounding hot stocks or trends, but chasing performance can be dangerous. By the time a stock becomes widely popular, it may already be overvalued, leaving little room for further upside. Instead of chasing the crowd, focus on value and invest based on fundamentals rather than speculation.
Lack of Discipline
Consistency is the key in equity trading, yet many traders lack the discipline to stick to their plans. Avoid deviating from your strategy based on impulse or short-term fluctuations in the market. Keep a trading journal to track your decisions and learn from both successes and failures.
Failing to Adapt
The market is constantly evolving, and what works today may not work tomorrow. Flexibility is essential for survival in the world of equity trading. Stay updated on market trends, economic indicators, and geopolitical events that could impact your investments. Be prepared to adjust your strategy accordingly to stay ahead of the curve.
In conclusion, equity trading offers lucrative opportunities for those who approach it with caution and diligence. By avoiding these common mistakes and adhering to sound trading principles, you can increase your chances of success in the market. Remember, Rome wasn't built in a day, and neither is a successful trading career. Stay patient, stay disciplined, and your efforts will eventually pay off.

Spotlight on Gold: Understanding its Role in Commodity Trading
In the vast world of commodity trading, few assets hold the allure and prestige quite like gold. Renowned for its timeless value and stability, gold has captured the imagination of traders for centuries. But what exactly makes gold such a sought-after commodity in the trading arena? Let's look into the fascinating world of gold trading and uncover its role in commodity markets.
The Allure of Gold: A Historical Perspective
Gold has long been synonymous with wealth, power, and prestige. From ancient civilizations to modern societies, its allure has transcended time and borders. The scarcity of gold, coupled with its inherent beauty and durability, has made it a symbol of prosperity and a store of value throughout history.
Gold as a Safe-Haven Asset
One of the primary reasons behind gold's prominence in commodity trading is its status as a safe-haven asset. During times of economic uncertainty or geopolitical turmoil, investors flock to gold as a reliable store of value. Unlike currencies or other assets, gold tends to retain its worth, acting as a hedge against inflation and market volatility. This characteristic makes it an indispensable component of diversified investment portfolios.
Industrial and Jewelry Demand
Beyond its role as a safe-haven asset, gold also boasts significant industrial and jewelry demand. Its malleability and conductivity make it a vital component in various industries, including electronics, aerospace, and dentistry. Additionally, gold's intrinsic beauty and rarity have made it a prized material for jewelry and adornment across cultures worldwide. This dual demand from both industrial and consumer sectors contributes to gold's enduring value and liquidity in commodity markets.
Factors Influencing Gold Prices
Understanding the factors that drive gold prices is crucial for commodity traders seeking to profit from gold trading. While supply and demand dynamics play a significant role, several other factors can influence gold prices, including:
Macroeconomic Indicators
Economic indicators such as interest rates, inflation rates, and GDP growth can impact gold prices. For instance, lower interest rates and rising inflation often boost gold demand as investors seek to preserve purchasing power.
Geopolitical Events
Political instability, conflicts, or trade tensions can trigger volatility in gold prices as investors seek refuge in safe-haven assets.
Currency Movements
Since gold is priced in U.S. dollars, fluctuations in currency exchange rates can affect its appeal to international investors.
Trading Gold: Strategies and Considerations
For traders looking to capitalize on gold's price movements, various trading strategies can be employed. These may include:
Technical Analysis
Utilizing charts, patterns, and indicators to identify potential entry and exit points based on historical price data.
Fundamental Analysis
Assessing macroeconomic factors, geopolitical developments, and supply-demand dynamics to anticipate future price movements.
Risk Management
Implementing prudent risk management strategies, such as setting stop-loss orders and diversifying portfolios, to mitigate potential losses.
In commodity trading, gold shines brightly as a symbol of stability, wealth, and resilience. Its unique properties, combined with global demand and market dynamics, make it a prized asset for investors seeking to navigate volatile markets. Whether as a safe-haven hedge, industrial commodity, or jewelry staple, gold continues to captivate traders and investors alike, embodying the enduring allure of precious metals in the realm of finance.
Big Budget


Popular Articles





.avif)
.avif)

.avif)



START YOUR INVESTMENT JOURNEY
Get personalized advice from our experts
- Dedicated RM Support
- Smooth and Fast Trading App
