


360 One Share Price: Investor View On The 360 One Flexicap Fund's 2026 Allocation




Key Takeaways
- The 360 one flexicap fund shifted from 62% large, 21% mid, 14% small at the start of 2026 to 49% large, 22% mid, 26% small by June 2026.
- Small caps have risen to 26% by mid-year, while mid caps look somewhat expensive and large caps offer value amid growth concerns.
- The fund blends growth and value through a bottom-up SCDV framework (Secular, Cyclical, Defensive, Value traps) to guide ideas.
- Long-term themes point to manufacturing, renewables, semiconductors and AI infrastructure, with heavy investment backing and a diversified supply chain outlook.
Investors tracking the 360 one share price face a telling story: a disciplined, bottom up flexicap approach that shifts gears as 2026 unfolds. The 360 one flexicap fund started the year with 62% in large caps, 21% in mid caps, and 14% in small caps, and by June the mix had moved to 49% large, 22% mid, and 26% small. That rebalancing signals a deliberate tilt toward small caps while preserving core exposure to higher quality large caps. The fund’s three year track record of 17.5% versus 11.5% for the BSE 500 TRI highlights the potential of this strategy when executed with discipline.
The fund is built on a bottom up approach across SCDV quadrants–Secular, Cyclical, Defensive and Value Traps–to identify opportunities across the multi cap spectrum. This framework guides allocation without a fixed bias toward any market cap, aligning with the flexible nature of a true flexicap strategy. The large cap component has ranged from a low of 38% to a high of 62, underscoring how nimble positioning is central to navigating evolving macro signals.
In 2026, the narrative has pivoted toward an evolving risk reward mix: small caps may offer a good risk reward at this juncture, while mid caps look somewhat expensive and large caps offer value, even as growth concerns persist in many names. This configuration aims to balance the durability and quality of large cap franchises with the upside potential of smaller companies, creating a diversified ballast for uncertain markets.
June 2026 brings a concise snapshot of the portfolio evolution. Start of 2026 allocations stood at 62% large, 21% mid, and 14% small; by June, the mix shifted to 49% large, 22% mid, and 26% small. The small cap allocation has increased to 26% from 14% at the start of 2026, reflecting a deliberate tilt toward opportunities the team sees as compelling on a risk adjusted basis. The large cap component has demonstrated flexibility within a 38%–62% band, signaling a disciplined tolerance for adapting to price action and earnings trajectory.
The 360 one flexicap fund’s portfolio construction is anchored in a bottom up process that spans four quadrants–Secular, Cyclical, Defensive and Value Traps. This SCDV framework is designed to balance secular growth tailwinds with cyclical turnarounds, while avoiding defensive traps and value traps that don’t earn their valuations. The intent is to blend growth and value with a defensive tilt where warranted, helping to dampen downside risk while keeping room for upside across market cycles.
Beyond the numbers, the fund reflects a broader view: the market breadth and earnings context suggest that a mid to long term rebound in Nifty 500 earnings could emerge as crude, credit, consumption, and capex narratives resolve. In this environment, the flexicap mandate can potentially outperform the Nifty by a healthy margin, provided the product is genuinely managed as a flexicap rather than a fixed bucket strategy. The June 2026 snapshot reinforces a narrative where the fund’s dynamic mix is designed to capture opportunities across manufacturing, renewables, and the AI driven data center ecosystem.
360 One Share Price: Allocation Shifts In The 360 One Flexicap Fund For 2026
The 2026 allocation journey is a concrete example of how a flexicap approach can adapt to evolving market signals without losing sight of core investment objectives. At the start of the year, the fund’s cap breakdown reflected a strong tilt toward large caps (62%), with mid caps at 21% and small caps at 14%. By June, the distribution had shifted to 49% large, 22% mid, and 26% small, illustrating a deliberate increase in small cap exposure to capture growth opportunities outside the top tier of index names.
| Period | Large Cap | Mid Cap | Small Cap |
|---|---|---|---|
| Start of 2026 | 62% | 21% | 14% |
| As of June 2026 | 49% | 22% | 26% |
| Large Cap Allocation Range | 38%–62% | To be announced | To be announced |
The shift toward small caps is underpinned by a belief that the risk reward at this juncture can favor selective exposure to dynamic growth stories, particularly in sectors aligned with India’s long term structural themes. However, the fund remains mindful of valuation constraints in mid caps, and the management team has signaled an intention to book profits where risk reward becomes unattractive. This discipline helps preserve risk controls while staying positioned for upside in areas such as T&D, renewables and EMS where growth dynamics remain intact.
Why Small Caps Are Rising In The 360 One Flexicap Fund Portfolio
The call to raise small cap exposure is grounded in a careful assessment of risk and reward. Small caps may offer a good risk reward at this juncture, while mid caps look somewhat expensive and large caps offer value, albeit with persistent growth concerns in many names. The bottom up, SCDV driven approach keeps the portfolio anchored in quality ideas across market cycles, allowing the fund to tilt toward the segment that offers the most compelling risk adjusted upside at a given moment. In practice, this means stock level ideas are vetted against secular growth drivers, cyclical resilience, defensive characteristics, and potential value traps, creating a structured path through volatility.


Valuation Backdrop: Nifty P/B At 3x And Implications For Flexicap Investing
Context matters for flexicap investing. The market has historically traded in a Nifty price to book band of roughly 2x–4x; currently, the index trades around 3x P/B, placing it near a 20 year median. This valuation envelope supports a balanced approach that mixes value and growth across market caps, enabling a flexicap construct to capture opportunities as earnings cycles evolve. In parallel, the Nifty 500 has demonstrated comparatively stronger earnings growth than the Nifty, with an earnings rebound potentially supported by a blend of crude, credit, consumption and capex dynamics in the second half of the year. This backdrop helps explain why a flexicap fund, when genuinely managed as a flexible bucket, can aim to outperform the broader benchmark over time.
Long-Term Sector Trends Driving Opportunities: Manufacturing, Renewables, Semiconductors And AI Infrastructure
Looking beyond the near term, the long term sectoral narrative remains constructive for India. Manufacturing is described as India's next decade theme, with renewables manufacturing gaining momentum. Five years ago, India imported most solar equipment; today modules are made domestically, and from June onwards solar cells must be made in India too, with wafers likely to follow. Semiconductors are at an early stage but are being tracked closely, given their potential to unlock a wide array of electronics and defense applications. The AI opportunity, while often discussed in terms of software and services, is increasingly tied to second order beneficiaries–data centres and the broader AI infrastructure ecosystem that will underpin scalable AI services.
When you quantify the opportunity, the numbers are persuasive: roughly 14 GW of AI capacity is expected to come up over the next five to seven years, backed by upwards of ₹10 lakh crore of investment. This translates into robust demand for critical supply chains–T&D equipment, cables and wires, diesel gensets and renewable energy equipment–as well as opportunities in defence and electronics manufacturing. The fund’s nomenclature and allocation posture reflect a deliberate tilt toward these secular growth themes, while maintaining a prudent balance with cyclical and defensive bets to weather volatility.
Portfolio Concentration And Risk Management: Industrials As The Second-Largest Holding
Within the fund’s portfolio, after financials, industrials stands as the second largest holding at 13.44%. This concentration underscores the emphasis on domestic manufacturing and infrastructure themes that tend to benefit from macro level policy support and a rebound in capex cycles. The allocation framework emphasizes a blended approach to growth and value, with defense against downside risk via selective positions and a keen eye on earnings quality. The fund’s disciplined stance on risk–recognizing that some stocks have run up–drives profit booking where risk reward becomes unattractive, while growth opportunities remain robust in segments like T&D, renewables and EMS.
Actionable Takeaways For Retail Investors: How To Use This Framework In Practice
For retail investors seeking to translate these insights into portfolio construction, a few practical takeaways emerge. First, embrace a flexicap mindset: let your allocations drift within a defined band to capture opportunities across market cycles rather than forcing a fixed cap tilt. Second, use the SCDV framework as a decision making scaffold–identify secular growth pillars, assess cyclical tailwinds, flag defensive buffers, and screen out potential value traps. Third, monitor valuation context (Nifty P/B around 3x near the 20 year median) and earnings trajectory (Nifty 500 earnings rebound cues) to time entry and exit with a disciplined approach. Finally, leverage intrinsic tools to deepen stock level analysis. For investors who want an AI assisted research companion, Swastika’s Sarthi AI stock assistant can provide institutional level research on any stock or index to retail investors: Swastika's Sarthi AI stock assistant.
Frequently Asked Questions
What is the current allocation mix of the 360 one flexicap fund as of June 2026?
As of June 2026, the fund was allocated 49% to large caps, 22% to mid caps, and 26% to small caps.
How has the allocation changed from the start of 2026 to June 2026?
At the start of 2026 the mix was 62% large, 21% mid, and 14% small. By June 2026 it shifted to 49% large, 22% mid, and 26% small.
Which sector is the fund's second-largest holding after financials?
The Industrials sector is the fund's second-largest holding at 13.44% after financials.
What long-term themes does the fund emphasize?
Manufacturing is a key decade theme, with renewables manufacturing domestically, semiconductors, and AI infrastructure including data centers as major beneficiaries. AI capacity is expected to reach about 14 GW over the next five to seven years, backed by over ₹10 lakh crore of investment.
How does the valuation backdrop influence the fund's strategy?
Nifty’s price-to-book is around 3x, near its 20-year median, which supports a balanced flexicap approach that blends growth and value across cycles and market caps.
Conclusion
In today’s multi cap environment, the 360 one share price and the 360 one flexicap fund’s evolving allocation offer a practical blueprint for retail investors: stay flexible, stay disciplined, and stay focused on the long term themes that should drive earnings across manufacturing, renewables, semiconductors and AI infrastructure. The fund’s journey from 62% large caps at the start of 2026 to 49% by June, with small caps rising to 26%, illustrates how a true flexicap strategy can recalibrate exposure to seize opportunities while maintaining risk controls.
Latest Articles

Sapphire Foods India Limited IPO


Sapphire Foods India limited one of YUM’s franchisee operators in the Indian subcontinent. They are also Sri Lanka’s largest international QSR chain, in terms of revenue. Company also established a presence in the Maldives. Company-owned and operated 209 KFC restaurants in India and the Maldives, 239 Pizza Hut restaurants in India, Sri Lanka and the Maldives, and two Taco Bell restaurants in Sri Lanka. They operate their restaurants in high traffic and high visibility locations in key metropolitan areas and cities across India and develop new restaurants in new cities as part of their brand and food category expansion. The company has an in-house supply chain function and works with vendor partners for food ingredients, packaging, warehousing, and logistics. The company operates warehouses across 5 Indian cities and has invested in building technology solutions in their restaurants. The company employs YUM brand's global online and digital channel solutions to enhance customer experience and achieve operational efficiency and financial control.
- Food services is a key segment in the Indian economy, with a market size of US$26.8 billion in the financial year 2021 growth of the food services sector in India is expected to grow more.
- Company’s franchisee Arrangement also provides a right to use YUM’s system and system property covering all aspects of business operations, as well as the flexibility to undertake, with YUM’s approval, local or regional promotions, while meeting YUM’s global quality assurance standards.
- The organized market, consisting of chain and organized standalone outlets, is expected to increase its share in the food services market in India from 37.8% in financial year 2020 to 51.3% in financial year 2025.
Outlook & Valuation:
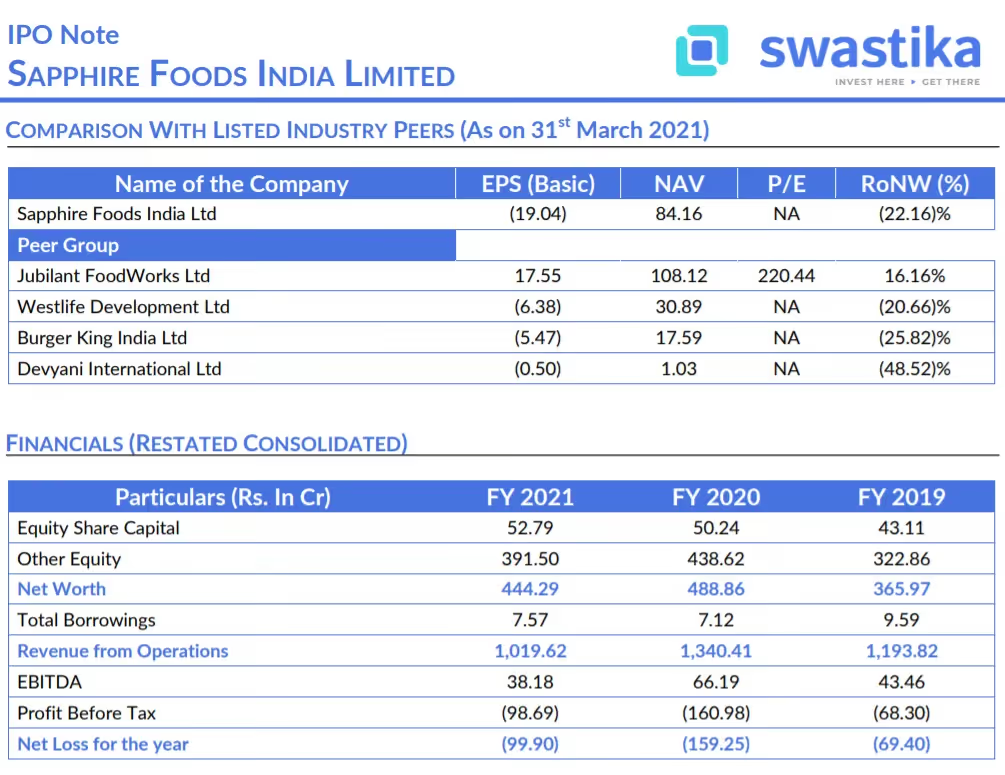
The Company recorded a loss of Rs (99.89) cr. in the financial year FY21 against a loss of Rs (159.25) cr. in the previous year FY20. Revenue from operations in the same period declined to Rs 1,019.62 cr. in FY21 from Rs 1,340.41 cr. in FY20 due to the Covid-19 crisis. The issue is priced at a P/BV of 14.63 based on its NAV of Rs. 80.67 as of June 30. Sapphire Foods is a Leading quick-service restaurant brand with a large market presence and size. Their initial public offer will be a pure offer for the sale of its equity shares; also the company is loss-making in the last three financial years. The company aims to break even in the near future. We are in a bull run of IPO's where new edge businesses are on the front seat. IPO euphoria might lead to listing gain as the IPO is arriving at a P/S of 7x which is half to its peers however we expect the peers to outperform Sapphire Food over the long run. Thus we assign a "SUBSCRIBE" rating with a cautious view.

KEY MANAGERIAL PERSONNEL
- Sanjay Purohit is the Whole Time Director and Group CEO of the Company. He has over 30 years of work experience across consumer product categories including food and apparel retail, packaged food, and paints.
- Sunil Rewachand Chandiramani is the Chairman and Independent Director of the Company. He has experience of over 29 years and has worked in the field of accounting and advisory services.
- Sumeet Subhash Narang is a Non-Executive Director of the Company as a nominee of Sapphire Foods Mauritius Limited.
- Manish Mehta is a Non-Executive Director of the Company as a nominee of Sapphire Foods Mauritius Limited. He has experience of over 17 years.
- Vikram Ranjan Agarwal is a Non-Executive Director of the Company as a nominee of QSR Management Trust for the past 13 years and has worked in the field of private equity.
- Kabir Kishin Thakur is a Non-Executive Director of the Company. He has experience of over 14 years
- Deepa Gopalan Wadhwa is an Independent Director of the Company.
- Anu Ram Aggarwal is an Independent Director of the Company.
COMPETITIVE STRENGTHS
- Leading QSR brands with a substantial market presence and scale
- Strong relationship with YUM
- Continuous focus on delivering great customer experience
- Operational excellence
- Scalable new restaurant economic model for expansion
- Great place to work led by experienced management team and backed by institutional capital
KEY CONCERNS
- Company reported loss for the last three financial years and may incur additional losses in the future.
- The Coronavirus disease (COVID19) pandemic has substantially affected and may continue to affect the business
- Company will not receive any proceeds from the Offer for Sale. The Selling Shareholders will receive the net proceeds from the Offer for Sale.
- Company incurred indebtedness and may incur additional indebtedness in the future which could affect their ability to obtain future financing or pursue any growth strategy.
- There are material outstanding legal proceedings involving the Company, Subsidiaries, and Directors...
Paytm (One97 Communications Ltd) IPO: Outlook & Valuation
Incorporated in 2000, One97 Communications Limited (Paytm) is India’s leading digital ecosystem for consumers and merchants. Paytm offers ‘Payment Services’, ‘Commerce and Cloud Services’, and ‘Financial Services’ to 33.3 crore consumers and over 2.18 crore merchants registered with them, as of June 30, 2021.
Their 2-sided (consumer and merchant) ecosystem enables commerce, and provides access to financial services, by leveraging technology to improve the lives of their consumers and help their merchants grow their businesses.
In 2009, the company launched the first digital mobile payment platform, "Paytm App" to offer cashless payment services to customers and now, it became India's largest payment platform and the most valuable payments brand with a total brand value of US$6.3 billion as per Kantar Brands India 2020 Report.
The app enables customers to do cashless transactions at stores, top-up mobile phones, online money transfers, pay bills, access digital banking services, purchase tickets, play games online, buy insurance, make investments, and more. However, merchants can use the platform for advertising, online payment solutions, offering products to customers, and loyalty solutions. They have created a payments-led super-app, through which they offer their consumers innovative and intuitive digital products and services. They offer their consumers a wide selection of payment options on the Paytm app, which includes:
- Paytm Payment Instruments, which allow them to use digital wallets, sub-wallets, bank accounts, buy-now-pay-later, and wealth management accounts.
- Major third-party instruments, such as Debit and Credit Cards and Net Banking.
Offer services such as Paytm Wallet, Paytm QR, Paytm Soundbox, Gold investments, and Fixed Deposit, Paytm Postpaid, Merchant Cash Advance and FASTag.
Outlook & Valuation
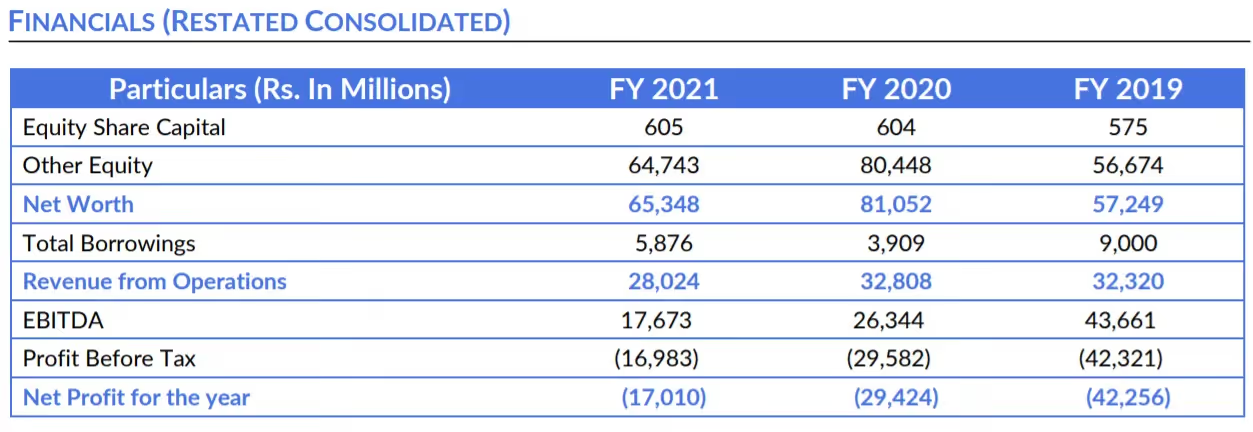
The revenues of the company have been on the declining side, in FY19 revenue was at ₹3,579 cr while in FY21 it was at ₹3,186 cr. Also, it is a loss-making company with a loss of ₹(4,230.9) cr in FY19 which however reduced to ₹(1,701) cr in FY21.
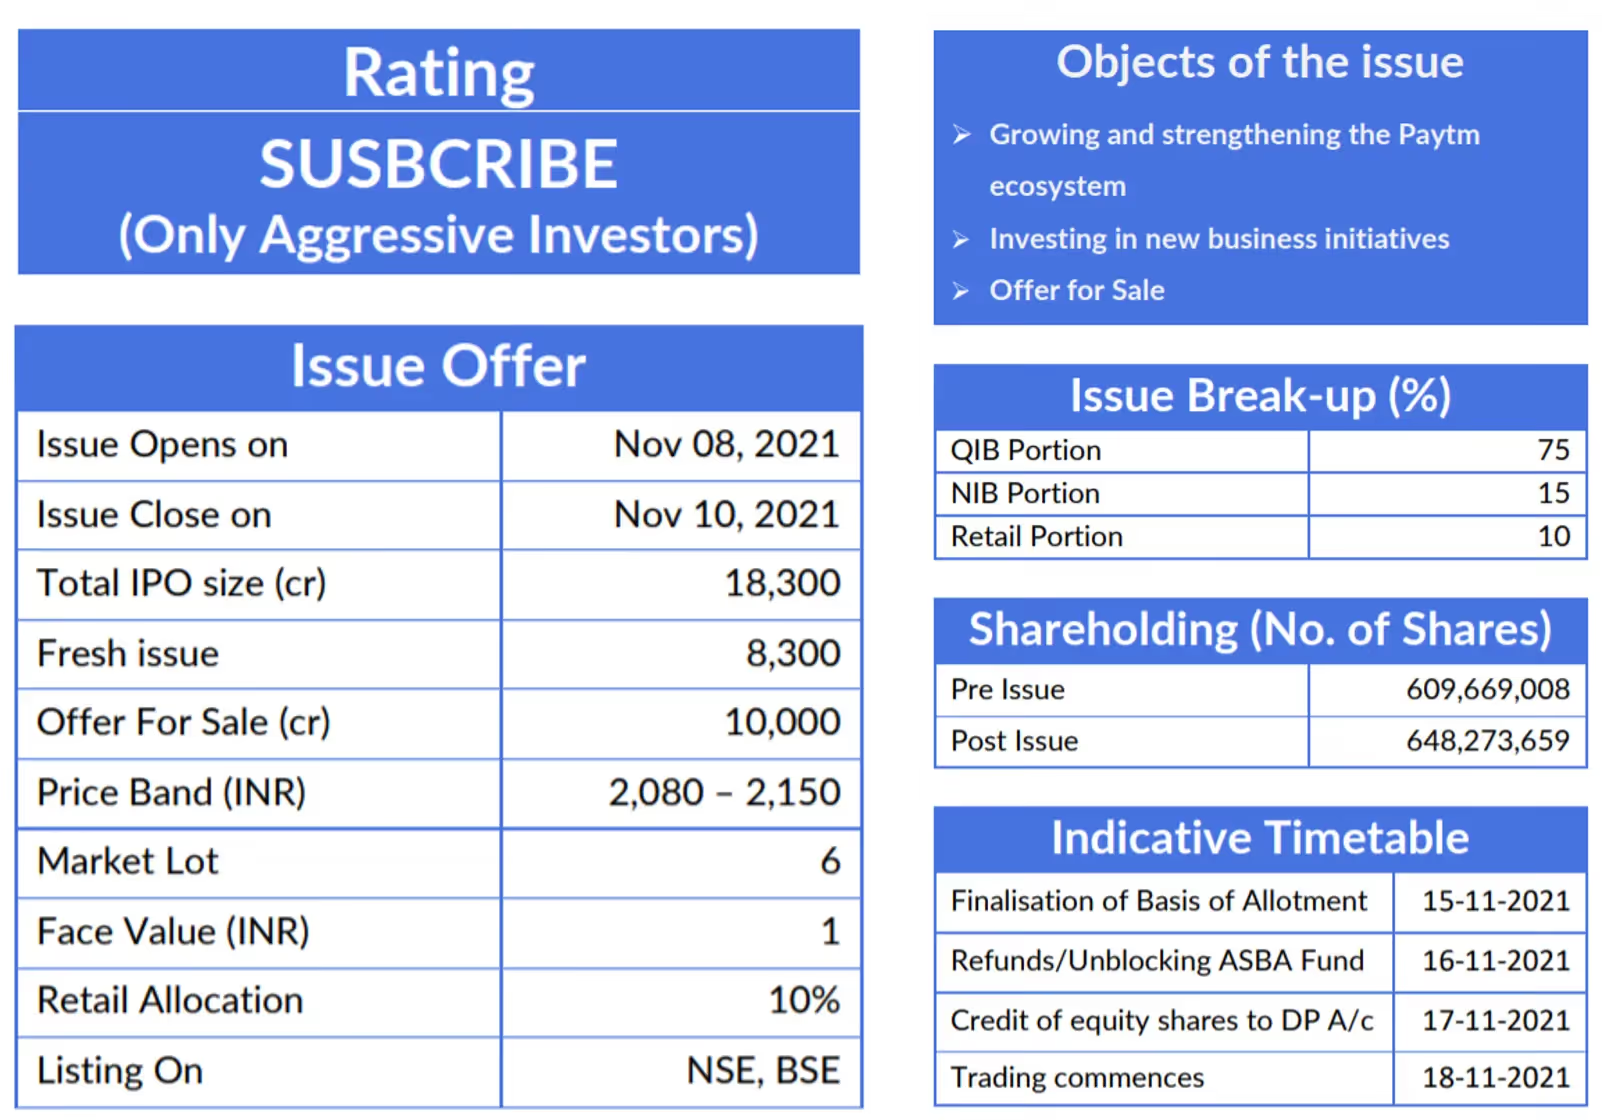
We are in an era of new-age businesses where we have seen many unicorns getting listed recently. It is really arduous to provide a valuation for such types of companies. We expect only leaders will survive over a period of time and only a few such companies will be wealth creators while many can be wealth destroyers. As India is on the verge of digitalization, we may expect the company to get benefited from the same also new acquisition and strengthening of the PAYTM ecosystem from the IPO will be beneficial for the company. Thus we assign a "SUBSCRIBE" rating only for aggressive investors.
KEY MANAGERIAL PERSONNEL
- Vijay Shekhar Sharma is the Founder, Managing Director, and Chief Executive Officer of the company, and the Chairman of the Board. He oversees the Company's key strategic efforts including engineering, design, and marketing.
- Madhur Deora is the President and Group Chief Financial Officer of the company. He has been associated with the company since October 3, 2016.
- Manmeet Singh Dhody is the Chief Technology Officer, Payments. He has been associated with the company since April 1, 2020.
- Vikas Garg is the Chief Financial Officer of the company. He has been associated with the company since May 21, 2014, and was previously associated with the company from August 25, 2008, to September 28, 2012.
- Sudhanshu Gupta is the Chief Operating Officer of Paytm First Games Pvt Ltd, their Subsidiary. He has been associated with Paytm First Games Pvt Ltd since June 1, 2018.
- Bhavesh Gupta is the Chief Executive Officer of the Lending Business of the company. He has been associated with the company since August 4, 2020.
- Renu Satti is the Chief Operating Officer of Offline Payments of the company. She has been associated with the company since October 11, 2006.
- Praveen Kumar Sharma is the Managing Director and Chief Executive Officer of Paytm Payments Services Ltd. He has been associated with the company since September 2, 2019.
- Harinderpal Singh Takhar is the Chief Executive Officer of Paytm Labs Inc, their Subsidiary. He has been associated with Paytm Labs Inc. since June 2013.
COMPETITIVE STRENGTHS
- India's leading digital payment service platform.
- Strong brand identity with a brand value of US$6.3 billion.
- Large customer base with 333 million total customers, 114 million annual transacting users, and 21 million registered merchants.
- Paytm Super-app to access a wide range of digital payment services over mobile phones.
- Strong macro tailwinds.
- Increasing pace of digitization.
- Digital payments in India evolving rapidly
- Under-penetration and rising digitization of financial services
KEY CONCERNS
- They have a history of net losses and we may not be able to achieve profitability.
- The ongoing COVID-19 pandemic and measures intended to prevent its spread have had, and may continue to have, a material and adverse effect on the business and results of operations.
- The company may suffer if they are unable to retain existing customers, acquire new customers, grow the amount of consumer transactions, or increase in the client acquisition expenses.
- Their payment services account for the majority of their income. Their attempts to broaden their service offerings and market reach may not be successful, which might have a negative impact on their income.
- The business might suffer if they do not maintain or develop their technological infrastructure.
COMPARISON WITH LISTED INDUSTRY PEERS
There are no listed companies in India that engage in a business similar to that of the Company. Accordingly, it is not possible to provide an industry comparison in relation to the company
Why Did Paytm Stock Fall Sharply On The First Day Itself?
India’s leading digital payments system company Paytm made history after successfully launching India’s biggest ever IPO in the current month. As per the sources, the total worth of this public offering was Rs 18,300 Crores with the fixed price band at Rs 2080 to Rs 2,150 for each share.
The company hit headlines when the shares of the company made their market debut after much anticipation on Thursday at a 9 per cent discount. Against the expectations, Paytm Stock listed at Rs 1,955 dropped 9% from its issue price on the BSE. After some hours, the stock prices declined further and reached Rs 1,564 a share (a drop of 27.25%) & hit the lower circuit limit at the end of the day trade.
It has been seen that Paytm's market capitalization dropped to about $13.6 billion from its IPO valuation of $20 billion.
Here comes a question: How did India’s greatest IPO fail to give an outstanding performance? Let’s figure it out.
High Valuation Led to Losses for the Investors
Experts said that the company’s high valuation, loss-making business decisions and muted investor’s response are some of the primary reasons for the downfall, even though the company expects to break even by next year or in early 2023.
HNIs or and other powerful investors usually borrow funds for the IPO offerings at highly competitive rates. Hence, the investors will make a profit only if the IPO lists at a higher premium than the cost of funding.
After June 2021, merely 25% of the IPO were listed at a discount which led to a huge loss for the investors.
In the case of Paytm, the debut price was lower than anticipated as the stock opened at Rs 1,955 against the issue price of Rs 2,1050 at the upper end at BSE. The stock price is falling at 9.1 per cent. According to Money control, only aggressive investors were requested to put their money for future investments.
The weak response is being viewed as a sign that investors had become disillusioned with a recent string of IPOs with high valuations.
There are numerous reports out there that have claimed that Paytm’s business model lacks focus and attention.
Macquarie Stock Market Research firm has further said that achieving scale with profitability is the biggest challenge for the company. Also, the target price of Rs 1200 for the stock against its issue price of Rs 2,150 clearly shows the 40 per cent downside risks.
Competition May Drive Down Unit Economics
Also, the research firm points out that competitors of Paytm such as Amazon, Flipkart, Google etc are offering the same services. The competition became tough when new services such as Buy Today Pay Later were launched by the competitors.
This can be clearly seen from the fact that despite Paytm’s offering being much larger than other offerings, the demand was weaker than the recent stock sale. This is because Paytm has lost much of its market share to its competitors like Google and Flipkart.
Stiff Competition with Disruption in Business
Paytm holds its major competition with significant giants in the eCommerce industry like Amazon, GooglePay and Flipkart's Phone Pe. It faces intense competition from these adversaries in specific business areas like purchase currently pay later or buy today and pay later (BTPL)
Although Paytm's Rs. 18,300 crores IPO was listed at the top of the indicator range, it neglected to earn a lot of interest rather than other ongoing IPO events.
The biggest reason behind the market loss to Google Pay and Phone Pe was mainly responsible for this. It is also believed that the company’s FCF (Free cash flow) will not regain its pace till FY 2030.
In addition, the huge development in UPI-based payment structure hampered Paytm's business model.
UPI was presented by GOI in 2019 to build and promote a unified platform for payment in the whole country.
At this point, UPI represents almost 65% of Paytm's GMV, with a strong possibility to reach 85% by FY26
In any case, Paytm actually procures around 70% of its income from the payment business. It is a key part of the mobile wallet section. Nonetheless, this section has lost pertinence because of the advent of UPI payments.
Trouble to Achieve Scale with Profitability
According to a report by Macquarie Research, Paytm needs concentration, innovation and development in its business model. The firm accepts Paytm doesn't have the ability to accomplish scale with productivity.
The digital payment platform is associated with various business verticals, including consumer lending, payment gateway, monetary services etc. It has been consuming a lot of its money while attempting to maintain a few business fragments along with no emphasis on accomplishing benefits. In addition, Paytm procures lower revenue for every dollar it spends through advertising.
As such, the organization has been forced to move into other business segments as it is continuously looking for profitability. In any case, Paytm enjoys a huge client base with 50 million active customers and 22 million merchant banking clients.
Major Decline in Ecommerce Revenue
Paytm Mall, Paytm's internet business arm, contributes around 55% of its income in this income. During FY2019-21, the segment saw a sharp fall in income. This was predominantly because of rising competition from other significant adversaries.
Paytm neglected to stay aware of the internet business giants like Amazon and Walmart-possessed Flipkart. These players accompany a huge client merchant ecosystem and huge buyer offers.
Conclusion
Paytm stock crash tells us a lot. Only a good company is not the one that can offer you amazing benefits. There are certain things you need to ponder before subscribing to an IPO.
Therefore investors, keen to subscribe to SME IPOs must check the company’s financial and fundamentals. Carefully read the financial statements of a company, analyze its strength and weakness and valuations of a company before subscribing to the IPOs.

The IPO Rush: Why 2021 Proves To Be The Best Year of IPOs
Investment bankers and many investors tracking SME IPOs say that 2021 will be a record-breaking year for fundraising.
India is ready to make a record of the biggest IPO launching in the year 2021. In this blog, we will uncover all the reasons that why so many companies are going public this year:
Numerous companies including Policybazaar, Zomato, Paytm have gone public this year. Following the path of these giants, many more firms are expected to launch their IPO later this year.
This year, the companies are planning to raise the highest amount through IPO launching. Despite the impact of COVID 19, the companies are in a rush to go public.
Let’s try to figure out what is the top reason behind the IPO launching:
What is an IPO?
Initial public offering or IPO is a process under which a privately owned company offers its shares to people so that it can generate funds from investors. The process denotes the progress of a privately owned company to a public firm.
If an organization wants to become public, it has to follow two basic processes. Enter in the primary market to launch its IPO. Second, get listed on the stock exchange to become a publicly-traded company.
A few IPOs also include an Offer For Sale (OFS), which permits existing investors or promoters to minimize their shareholding in the listed companies.
Nevertheless, the amount raised through the OFS generally goes to private investors making their value available for sale.
Initial public offerings are a huge achievement for any company. They are raised when the company concludes it requires capital for a specific reason, like development, growth debt clearance, and funding corporate costs.
Any organization or startup doesn't grow immediately since its inception; they in the long run develop over a period to become more profitable and organized.
Different rounds of funding at the beginning stage and the further mixture of capital through private and private supporters lead to a company’s development.
There comes a turning point in any organization where its growth is soaked, and however the development rate may be positive, there is a flattened growth by a reduction in the rate.
At such a period, many companies are planning to go public via IPO to raise capital from the public.
There are times when a company is making a good profit, however, it needs more capital for development, growth and expansion as all the profits generated by it goes into debt clearance.
In such cases, going public not only helps the company to clear its debt but also utilizes its raised capital for the company’s further growth.
How do IPO’s Work?
Before going public, the privately held company seeks approval from the market regulator i.e. SEBI. Once it’s done, it starts revealing key insights regarding the IPO.
The key details include the price band for the IPO, lot size, launching date and distribution of share sales for various types of financial investors — non-institutional financial investors, institutional financial investors, existing employees and angel investors.
When the IPO process has begun, the company’s shares first start trading in the grey market — the informal market for unlisted shares. The process continues to take place till they are listed on the bourses.
It may be noticed that the grey market stocks are exchanged over-the-counter (OTC) and are not presented by the stock exchange; only traders are permitted to deal with them.
Investors normally get a small period i.e. typically 2-3 days to subscribe to a company’s public offering post IPO launching date.
During this period, investors (mostly retail investors) can bid for the offers through different stock trading platforms.
As the time period of IPO gets over, investors are required to check their IPO allotment status at their designation status on accessible channels - either the registrar or at the BSE site.
After the completion of allotment, the shares of the company get listed on the stock exchanges on a predetermined date.
Why IPO Rush: Reasons Why So Many Companies Going Public This year?
It has been seen that Several organizations have gone public regarding fundraising a year ago. Data suggest that organizations raised funds as much as $4.6 billion from IPOs last year. Analysts and investment bankers feel that this sum will be effectively outperformed in 2021 as more organizations are going for public offerings.
A head of investment banking at UBS India told Bloomberg that companies will generate twice the revenue as expected in the last year.
Many organizations have decided on IPOs at the end of 2020, because of the effect of the Covid-19 pandemic on business and the several securities exchange movements.
Experts further suggested that organizations are going public because of the highest performance found in the stock market and higher support of HNIs or high net worth individuals.
A State Bank of India (SBI) report recommended that over 14.2 million new individual investors have taken an interest in the stock market in 2020-21.
Indeed, even as the pandemic hits hard on India's economy, the domestic stock market has not been affected at all.
In fact, stock market indices such as Nifty 50 and BSE 30 have performed better than before.
If we talk about the market performance, a higher percentage of IPOs have done outstandingly well and more investors are hoping to capitalize on this period.
Organizations that are going public either bring capital because of the losses experienced during the Covid-19 pandemic or finance business expansion because of high demand.
Many techs and online delivery companies like Paytm, Nykaa, Zomato have gone public and the key reason is to raise capital and extend the business as the demand grows rapidly.
In the next few years, analysts expect over 50 digital tech companies will get listed on the bourses.
Star Health & Allied Insurance IPO
RatingSUBSCRIBE (Long Term Only)Issue OfferIssue Opens on Nov 30, 2021Issue Close on Dec 02, 2021Total IPO size (cr) 7,249.18Fresh issue 2000.00Offer For Sale (cr) 5,249.18Price Band (INR) 870-900Market Lot 16Face Value (INR) 10Retail Allocation 10%Listing On NSE, BSEObjects of the issue ⮚ To augment the company’s capital base and insolvency level.Issue Break-up (%)QIB Portion 75NIB Portion 15Retail Portion 10Shareholding (No. of Shares)Pre Issue 553,289,944Post Issue 575,620,567Indicative TimetableFinalisation of Basis of Allotment 07-12-2021Refunds/Unblocking ASBA Fund 08-12-2021Credit of equity shares to DP A/c 09-12-2021Trading commences 10-12-2021
SME-IPO of Star Health Insurance is on the boom as Star Health and Allied Insurance Company Ltd is one of the largest private health insurers in India with a market share of 15.8% in Fiscal 2021. From being the first standalone health insurance ("SAHI") company established in India in 2006, it has grown into the largest SAHI company in the overall health insurance market in India, according to CRISIL Research.
Company offer a range of flexible and comprehensive coverage options primarily for retail health, group health, personal accident and overseas travel, which accounted for 87.9%, 10.5%, 1.6% and 0.01%, respectively, of their total Gross written premium (GWP) in Fiscal 2021.
Individual agents are the primary distributors of the company's health insurance plans, accounting for 78.9% of their GWP in Fiscal 2021. In addition, the company has successfully built one of India's largest health insurance hospital networks, with 11,778 hospitals as of September 30, 2021.
⮚ Company consistently ranked first in the retail health insurance market in India based on retail health GWP over the last three Fiscal Years, according to CRISIL Research.
⮚ The retail health market segment is expected to emerge as a key growth driver for the overall health insurance industry in India after the COVID-19 crisis in India.
⮚ As of September 30, 2021 its distribution network had grown to 779 health insurance branches spread across 25 states and 5 union territories in India.
⮚ The company has also successfully built one of the largest health insurance hospital networks in India, with 11,778 hospitals, of which 7,741 hospitals, or 65.7 percent of the total number of hospitals in their network, entered into pre-agreed arrangements with in Fiscal 2021.
Outlook & Company Valuation:
The company has mixed set on financials over the last three years where the company's GWP has increased over the years while the company suffered a loss in FY21. In FY19, the revenues of the company were Rs 3713 cr while in FY21 it grew to 5283 cr.
The Profit was at Rs 128 cr in FY19 while the company suffered a loss of Rs 825 cr in FY21. The health insurance sector is likely to flourish as individuals become more aware of the benefits of health insurance. If we look at the company's financials, we can see that it was doing well until Covid hit last year. The company has the largest market share which is positive for the company however the industry is getting competitive.
The valuation of the company is stretched. At the upper price band of Rs. 900, Star Health is demanding an MCAP to net premium earned multiple of 10.3x, which is at a premium to the peer average.
IPO Note
STAR HEALTH AND ALLIED INSURANCE COMPANY LTD IPO
KEY MANAGERIAL PERSONNEL
⮚ Venkatasamy Jagannathan is the Chairman and CEO of the Company. He holds master’s degree of arts in economics and have more than 47 years of experience in the insurance industry
⮚ Subbarayan Prakash is the Managing Director of the Company. He has several years of experience as a surgeon and has previously worked with Saudi Operation & Maintenance Company Limited.
⮚ Anand Shankar Roy is the Managing Director of our Company. He holds a bachelor’s degree in commerce and he has 21 years of experience in the insurance industry
⮚ Sumir Chadha is a Non-Executive Nominee Director of the Company he has several years of investing experience in Indian companies, both public and private.
⮚ Deepak Ramineedi is a Non-Executive Nominee Director of the Company. He has several years of experience in the private equity industry
⮚ Utpal Hemendra Sheth is a Non-Executive Nominee Director of the Company. He holds a bachelor’s degree in commerce.
⮚ Rohit Bhasin is an Independent Director of the Company
⮚ Anisha Motwani is an Independent Director of the Company.
⮚ Berjis Minoo Desai is an Independent Director of the Company
⮚ Kaarthikeyan Devarayapuram Ramasamy is an Independent Director of the Company
⮚ Rajni Sekhri Sibal is an Independent Director of the Company
⮚ Rajeev Krishnamuralilal Agarwal is an Independent Director of the Company
COMPETITIVE STRENGTHS
⮚ Largest private health insurance company in India with leadership in the attractive retail health segment.
⮚ Largest and well spread distribution network in the health insurance industry.
⮚ Diversified product suite with a focus on innovation and specialized products.
⮚ Strong risk management with superior claims ratio and quality customer services.
⮚ Substantial investment in technology and innovative business processes.
⮚ Demonstrated track record of operating and financial performance.
⮚ Experienced senior management team with strong sponsorship.
KEY CONCERNS
⮚ Star Health Incurred Claim Ratio has increased from average 63.5% (FY2018 to FY2020) to 94% in FY21 and 91% in Q1 FY22. This is the main reason company has negative revenues and losses in the last 1.5 years.
⮚ The recent Covid-19 outbreak has had a significant impact on the company's business and operations.
⮚ They were able to keep their market share because of their strong brand name. However, if they fail to keep such a brand name, their business will suffer.
⮚ Company can be subject to claims by customers and/or regulators for alleged mis-selling.
⮚ Insurance companies depend on the accuracy and completeness of information provided by customers and counter parties for pricing and underwriting their insurance policies.
⮚ Any increase in competition could negatively impact the company’s profitability
IPO Note
STAR HEALTH AND ALLIED INSURANCE COMPANY LTD IPO
COMPARISON WITH LISTED INDUSTRY PEERS (As on 31st March 2021)
Name of the Company EPS (Basic) NAV P/E Net Worth (cr) RoNW (%)Star Health and Allied Insurance Co Ltd (16.54) 63.58 - 3,484.64 (23.69)% Peer GroupICICI Lombard General Insurance Co Ltd.* 32.41 163.56 46.66 7,435.15 19.81%New India Assurance Co Ltd 9.95 112.17 15.30 18,485.38 8.81%
*ICICI Lombard General Insurance Company Ltd. is not strictly comparable with the Company as they operate under general insurance with health insurance not forming a significant component, whereas the Company is a standalone health insurance provider.
FINANCIALS (RESTATED CONSOLIDATED)
Particulars (Rs. In Cr) FY 2021 FY 2020 FY 2019Equity Share Capital 548 491 456Other Equity 3,676 1,153 587Net Worth 4,224 1,644 1,043Total Borrowings 250 250 250Premiums earned (Net) 5,023 4,693 3,580Operating Profit/(Loss) (1,071) 361 165Profit Before Tax (1,046) 413 182Net Profit for the year (825) 268 128

Paytm Debacle Made Mobikwik Firm To Delay its Planned IPO: Key Reasons
A Gurugram based fintech startup Mobikwik, which was planning to go public this year, may defer its plan by two or three months or even more.
The official news of the delayed IPO comes just after Paytm’s gloomy market debut that saw its shares have gone down by 28% or more.
Seeing the current situation in the primary market, the fintech company has been advised to not go ahead with its IPO as it may face difficulties to find right investors both foreign and domestic.
Mobikwik, a small fintech startup compared to Paytm, had submitted its DRHP to SEBI for the SME-IPO in July. This includes a fresh issue of equity of Rs 1500 Crores and an OFfer for Sale (OFS) for another 400 crores.
What was the Original Plan?
The company had plans to hit the markets around Diwali and to raise Rs 1900 Crores approx by issuing its shares to the public. However, the financial advisors had advised the company to wait for the response to Paytm. Also, they suggested not to proceed with the SME-IPO launching, because of the shortening of demand from overseas investors.
After Paytm's debacle, the company is not in a mood to go ahead before January - February 2022.
The firm might have the option to go to the markets in December in case the investors’ reaction is good, if not, the plans might get delayed again.
Paytm's oxymoron listing and proceeding with underperformance, played a vital role in the decision to postpone the IPO plans.
MobiKwik's unlisted stock was trading at around Rs 1,350 before the launch of Paytm's IPO. From that point, the unlisted share price has decreased to about Rs 900, right around 33% lower, according to reports.
MobiKwik has an extraordinary DNA - it was bootstrapped for the initial 4 years and has accomplished its present size of 101 million clients (as of March 2021) having spent just $100 million since its inception.
The fintech startup mainly focuses on Buy Now Pay Later (BNPL) for day to day payments and has the biggest number of pre-supported BNPL users in India at 22.3 million (as of March 2021).
It has consistently adopted a sustainable growth strategy. The organization is seeing solid business development, has a way to productivity and will list at the right time - MobiKwik said according to a report.
Reasons Behind the Fall in the Company Valuations
As Paytm IPO was released with negative reviews, FinTechs have endured the shot and valuations of Mobikwik shares went further downhill by around 30-40 percent.
Indeed, even the retail financial investors are somewhat terrified since the Paytm IPO has drawn down their capital by approx 30%.
In June, the Abu Dhabi Investment Authority put $20 million in MobiKwik, which provided it with a valuation of about $700-750 million. Since the IPO launching, they had been planning to raise a valuation of more than $1 billion. However the reports say that the current financial investors are not in the mood for a public offering.
The interest for anchor books was repressed both from FIIS and domestic financial investors. This could bring about the delaying of the Mobikwik IPO shares. The more demand among anchor financial investors shows the willingness for financial investors to apply for a specific IPO.
A Sneak Peak into Mobikwik
Mobikwik is one of the biggest portable wallets (MobiKwik Wallet) and Buy Now Pay Later (BNPL) players in India dependent on mobile wallet wallet GMV and BNPL GMV, separately, in Fiscal 2021, its DRHP said.
In March, reports recommended that information of almost 110 million clients of MobiKwik was leaked on the dark web available to be purchased by programmers. The dataset included details of KYC documents, Aadhaar cards, Mastercard subtleties, cell phone numbers connected to MobiKwik wallet, and so forth.
The organization, in any case, had denied such information. Resulting reports in October also recommended that this supposed information breach of 3.5 million users at MobiKwik is presently under RBI's scanner.
About MobiKwik
Online wallet firm MobiKwik allows its users to make and get payments across different financial services like loans and insurance protection. It additionally has tie-ups with different monetary firms.
Also, it has been seen that, during the hour of filing DRHP with the SEBI, MobiKwik had a record of conducting nearly 10 Lakh every day transactions on its platform.
Takeaway
Till now, the fintech startup has not published its quarterly monetary outcomes for the Q2 of FY 2021-22. This shows the willingness of the organization to give Mobikwik IPO shares because the evaluated FS of the new quarter should be distributed before somewhere around 135 days after the end of the quarter.
The organization has saved a hole or pre IPO placements for its shares worth up to Rs 400 crore. MobiKwik’s promoters like Upasana Taku, and Bipin Preet Singh, have intended to sell part of their shares in the organization's secondary market according to the papers documented with SEBI.
Like Zomato and Nykaa, numerous different organizations are grappling to produce enough revenue just to legitimize their existence.
Big Budget


Popular Articles





.avif)
.avif)

.avif)



START YOUR INVESTMENT JOURNEY
Get personalized advice from our experts
- Dedicated RM Support
- Smooth and Fast Trading App
