


Nifty 50 31 Jul 2026 Morning Market Summary


Key Takeaways
- Prev session close reference: Nifty 50 Pivot 24370.9; R1 24442.1; R2 24500.6; S1 24312.4; S2 24241.2.
- Standout mover: TRANSPEK from 1101.1 -> 1321.3 (+20.00%).
- Biggest loser: NARMADA from 36.19 -> 17.02 (-52.97%).
- Market-wide Index Options PCR: Not available for this session.
Nifty 50 Support And Resistance Levels For 31 Jul 2026
Pivot: 24370.9; R1: 24442.1; R2: 24500.6; S1: 24312.4; S2: 24241.2. The Pivot is the central reference; R1 and R2 above are resistance hurdles, while S1 and S2 below are cushions. All these numbers come from yesterday's close as the basis for today's session.
In plain language, if the price sits above R1, the near-term tone is mildly bullish; above R2, the bias could extend higher; if it slips below S2, the bias could turn bearish. For deeper stock-level insights, Swastika's Sarthi AI stock assistant.
Nifty Bank Pivot Levels For 31 Jul 2026
Pivot: 57271.9; R1: 57404.2; R2: 57543.55; S1: 57132.55; S2: 57000.25. Those levels mirror the same logic as Nifty 50 for the Bank Nifty.


Top 5 Gainers (31 Jul 2026 Session, EQ Series, Liquid Names Only)
| Ticker | From | To | Change |
|---|---|---|---|
| TRANSPEK | 1101.1 | 1321.3 | (+20.00%) |
| UEL | 128.11 | 153.73 | (+20.00%) |
| YASHO | 3215.6 | 3858.7 | (+20.00%) |
| RSDFIN | 92.29 | 110.74 | (+19.99%) |
| DCI | 276.75 | 329.7 | (+19.13%) |
Top 5 Losers (31 Jul 2026 Session, EQ Series, Liquid Names Only)
| Ticker | From | To | Change |
|---|---|---|---|
| NARMADA | 36.19 | 17.02 | (-52.97%) |
| EXPLEOSOL | 906.6 | 802.85 | (-11.44%) |
| THANGAMAYL | 5807.0 | 5226.5 | (-10.00%) |
| ASIANTILES | 60.71 | 54.68 | (-9.93%) |
| SIGNPOST | 311.2 | 283.55 | (-8.88%) |
Market-Wide Index Options PCR
Market-wide Index Options PCR: Not available for this session.
Frequently Asked Questions
Nifty 50 Support and Resistance Levels for 31 Jul 2026
Pivot 24370.9; R1 24442.1; R2 24500.6; S1 24312.4; S2 24241.2. These are reference points for today's trading, derived from yesterday's close.
Nifty Bank Pivot Levels for 31 Jul 2026
Pivot 57271.9; R1 57404.2; R2 57543.55; S1 57132.55; S2 57000.25. These are yesterday's close-based reference levels for today.
Top Gainers on 31 Jul 2026
TRANSPEK: 1101.1 -> 1321.3 (+20.00%); UEL: 128.11 -> 153.73 (+20.00%); YASHO: 3215.6 -> 3858.7 (+20.00%); RSDFIN: 92.29 -> 110.74 (+19.99%); DCI: 276.75 -> 329.7 (+19.13%).
Top Losers on 31 Jul 2026
NARMADA: 36.19 -> 17.02 (-52.97%); EXPLEOSOL: 906.6 -> 802.85 (-11.44%); THANGAMAYL: 5807.0 -> 5226.5 (-10.00%); ASIANTILES: 60.71 -> 54.68 (-9.93%); SIGNPOST: 311.2 -> 283.55 (-8.88%).
PCR for Market-wide Index Options today
Market-wide Index Options PCR: Not available for this session.
Conclusion
Yesterday's close reference levels set the stage for today's open. Nifty 50 pivot at 24370.9 with R1 24442.1 and R2 24500.6; S1 24312.4; S2 24241.2. The standout mover TRANSPEK posted a 20% gain while NARMADA slid 52.97% from 36.19 to 17.02. Market-wide Index Options PCR remains not available for this session. Watch how price interacts with the pivot and resistance/support on open, and consider exploring deeper stock-level insights with Swastika's Sarthi AI stock assistant.
Open your trading and demat account here
Reference :
1 : Nseindia
Latest Articles

ब्याज दर बढ़ोतरी के संकेतो से सोने-चांदी में मंदी।


अमेरिकी फेडरल रिजर्व की सख्त नीतियों के कारण डॉलर के मजबूत होने से सोने और चांदी के भाव तीन महीने के निचले स्तर के करीब आ गए है। डॉलर 20 साल के उच्चतम स्तर पर पहुंच गया है। निवेशक मंदी को लेकर चिंतित हैं इसलिए मुद्रा को बढ़ावा देने वाली नीतियों को अपना रहे है जिससे कीमती धातुओं के साथ शेयर बाज़ारो में भी गिरावट देखी गई है।
फेड चेयर जेरोम पॉवेल ने स्थिर कीमतों को अर्थव्यवस्था का "आधार" बताया है, साथ ही गुरुवार को हुई स्पीच में कहा कि मुद्रास्फीति को शांत करने के लिए केंद्रीय बैंक की लड़ाई में "कुछ दर्द शामिल रहेगा" क्योंकि उच्च ब्याज दरे सभी को प्रभावित कर सकती है। उनके मुताबिक मुद्रास्फीति का लगातार बढ़ना, ब्याज दर में वृद्धि से ज्यादा घातक होगा।
आर्थिक आकड़ो में, गुरुवार को जारी अमेरिकी मुद्रास्फीति अनुमान से बढ़कर 8.3 प्रतिशत रही जबकि चीन में भी मुद्रास्फीति और पीपीआई के आकड़ो में बढ़ोतरी रही है। भारत में मुद्रास्फीति साल-दर-साल अप्रैल में बढ़कर 7.79 प्रतिशत हो गई है जो पिछले माह 6.95 प्रतिशत पर थी। कीमतों में लगातार बढ़ोतरी प्रमुख केंद्रीय बैंको पर ब्याज दर वृद्धि का दबाव बढ़ा रहा है।
हालांकि, गुरुवार को जारी अमेरिकी प्रोड्यूसर प्राइस इंडेक्स (पीपीआई) ने अप्रैल में महीने-दर-महीने 0.5 प्रतिशत की वृद्धि दिखाई, जो मार्च में 1.6 प्रतिशत की वृद्धि की तुलना में धीमी है, लेकिन ऊर्जा उत्पादों की बढ़ती लागत का दबाव थोड़ा कम रहने से पीपीआई आकड़ो में कमी दर्ज की गई है। बढ़ती हुई मुद्रास्फीति का मुख्य कारण महामारी और युद्ध है। फेड चेयर जेरोम पॉवेल ने जून और जुलाई में 0.50 प्रतिशत की ब्याज दर वृद्धि के संकेत दिए है।
जिससे सोने और चांदी की कीमतों में लगातार दबाव बना हुआ है। घरेलु वायदा सोने के भाव पिछले सप्ताह 2.5 प्रतिशत और चांदी के भाव 6 प्रतिशत टूट गए है। जिससे सोना 50000 रुपये प्रति दस ग्राम और चांदी 58800 रूपये प्रति किलो के निचले स्तरों पर कारोबार कर रही है।
तकनीकी विश्लेषण:
सोने और चांदी के भाव में इस सप्ताह फेड चेयर जेरोम पॉवेल के बयान होने से, भाव दबाव में रह सकते है। सोने में 49500 रुपये पर सपोर्ट है और 51000 पर प्रतिरोध है। चांदी में 56000 रुपये पर सपोर्ट और 60500 रुपये पर प्रतिरोध है।

Delhivery Limited IPO
About Delhivery Limited IPO
- Delhivery Limited (“Delhivery”) was incorporated on June 22, 2011. Delhivery is the largest and fastest-growing fully-integrated logistics services player in India by revenue as of Fiscal 2021.
- Delhivery provided supply chain solutions to a diverse base of 23,113 Active Customers such as e-commerce marketplaces, direct-to-consumer e-tailers and enterprises and SMEs across several verticals.
- Their in-house logistics technology stack is built to meet the dynamic needs of modern supply chains. They have over 80 applications through which they provide various services.
- Delhivery collects, structures, stores and processes vast amounts of transaction and environmental data to guide real-time operational decision making.
- Delhivery operated 21 fully and semi-automated sortation centres and 82 gateways across India (excluding Spoton) as of December 31, 2021.
- They had a Rated Automated Sort Capacity of 3.70 million shipments per day as of December 31, 2021.
- Delhivery operates a pan-India network and provides its services in 17,488 postal index number (“PIN”) codes, as of December 31, 2021.
Outlook & Valuation
The company has a good track record of execution built on its proprietary technology and has scaled up significantly since its incorporation in 2011 to emerge as the largest fully-integrated logistics player in the country.
The runway of opportunity also appears good given India’s long-term growth prospects and the crucial role logistics plays when it comes to commerce. Another point to note is that, in India, the share of organized players is much lower compared to developed countries.
It reported revenue from operations of ₹4,811 crores for the nine months ended December 21. Annualizing this implies a very strong FY19-22 revenue CAGR of around 57 per cent.
However, the high growth of the company is due to the acquisitions made, organic growth has been slower in comparison to overall growth. The company does not have a past track record of profitability given its focus on growth.
While it has reached near break-even on an adjusted EBITDA basis for nine-month FY22 (adjusted EBITDA margin of negative 0.72%), the profitability at net profit levels is yet to be seen and depends on a lot of variables in the future. Investors need to note that the logistics business is a low-margin business and the scale of operation determines the profitability due to operating leverage.
Nevertheless, the current market environment is not conducive to aggressive risk-taking when it comes to unprofitable companies.
The issue is priced at a Price to Sales ratio of 5.4 (based on annualized revenues of 9 months ending December 2021). We suggest investors enter the company post listing after analyzing how the business evolves in terms of revenue growth and profitability. Thus, we recommend “Avoid” the issue.
KEY MANAGERIAL PERSONNEL
- Sahil Barua is the Managing Director and Chief Executive Officer of the company. He has previously been associated with Bain & Company India Pvt. Ltd. as a Consultant.
- Sandeep Kumar Barasia is the Executive Director and Chief Business Officer of the company. He was previously associated with Bain & Company India Pvt. Ltd. as a Vice-President (Partner).
- Kapil Bharati is the Executive Director and Chief Technology Officer of the company. He has previously served as Founder and Chief Technology Officer at Athena Information Solutions Pvt. Ltd. and as Senior Manager of Technology at Sapient and Publicis Sapient.
- Ajith Pai Mangalore is the Chief Operating Officer of the company. He has been associated with the company since April 6, 2013.
- Amit Agarwal is the Chief Financial Officer of the company. He has been associated with the company since August 4, 2012.
- Pooja Gupta is the Chief People Officer of the company. She has been associated with the company since April 1, 2021.
- Sunil Kumar Bansal is the Vice President - of Corporate Affairs, Company Secretary and Compliance Officer of the company. He has been associated with the company since August 23, 2021.
COMPETITIVE STRENGTHS
- Rapid growth, extensive scale and improvement in unit economics
- The proprietary logistics operating system
- Vast data intelligence capabilities
- The integrated portfolio of logistics services
- Strong relationships with a diverse customer base
- Extensive ecosystem of partners, enabling an asset-light business model and extended reach
KEY STRATEGIES
- Expand investments in infrastructure and network
- Continue to build scale in existing business lines
- Deepen the customer relationships
- Enhance the technology (software and hardware) capabilities
- Expand into high-growth international markets similar to India
KEY CONCERNS
- The company is not yet profitable.
- The issue is overvalued compared to its peers.
- The high growth is due to acquisitions, thus organic growth remains slower.
- The overall industry is highly competitive
COMPARISON WITH LISTED INDUSTRY PEERS (AS OF 31ST MARCH 2021)
Name of the CompanyEPS (Basic)NAVP/ETotal Income (Cr)RoNW (%)Delhivery(8.05)54.79*●+38,382.91(14.66)Peer GroupBlue Dart Express Ltd42.91249.48150.3732,923.6017.08TCI Express Ltd26.15112.8966.888,516.4023.12Mahindra Logistics Ltd4.1679.65119.3932,811.905.05
FINANCIALS (RESTATED CONSOLIDATED)
Particulars (Rs. In Millions)FY 2021FY 2020FY 2019Equity Share Capital16.339.759.58Other Equity27,997.6531,302.5933,481.53Net Worth28,367.9731,704.0633,882.83Revenue from Operations36,465.2727,805.7516,538.97EBITDA(1,370.71)(1,720.47)(1,003.79)Loss Before Tax(4,157.43)(2,688.02)(17,833.04)Net Loss for the year(4,155.37)(2,679.61)(17,837.63)

Benefits of Investing in Multi Asset Funds
Multi-asset funds are usually meant for those investors who are risk averse. They don't have much experience in the stock market, but want to earn good stock trading returns on their investments.
These funds invest in stocks, bonds and other fixed income instruments. The percentage of each depends on the fund manager's market analysis. They can keep the same equity exposure or increase it if they think the market is going up.
This makes multi asset funds less volatile than pure equity funds, as they also invest in fixed income instruments which provide stability to the portfolio. Multi asset funds have lower returns than pure equity funds, but higher than debt funds.
Get the detailed information about Multi-asset funds Call us at 0120 4400700
How is a multi-asset fund different from an equity mutual fund or a debt mutual fund?
A multi-asset fund is a type of mutual fund that invests in a variety of asset classes.
While most funds invest only in stocks (equity funds), or in bonds (debt funds), or in a combination of stocks and bonds (balanced funds), multi-asset funds take this concept to the next level and invest in other asset classes as well.
These asset classes include real estate, gold, commodities, and international stock exchanges.
The allocation between these asset classes depends on the underlying objective of the fund.
For example, if the objective is capital protection, then the fund will have a relatively higher allocation towards debt and gold, while equity exposure will be low.
If the objective is moderate growth with modest volatility, then the allocation will be more towards equity than debt.
Benefits of Investing in Multi-asset Funds
There are many good and valid reasons to invest in Multi-Asset Funds. These funds can be a boon for investors who have a low-risk appetite or are looking to diversify their portfolio.
Here are some benefits of investing in Multi-Asset Funds
1. Diversification and Lower Risk
One of the most important advantages of multi-asset funds is diversification.
Apart from diversification across sectors, they also offer diversification across asset classes such as equity, debt, real estate, gold etc.
Investing in different asset classes means diversifying your portfolio to spread out your risk. It is advisable not to put all your eggs in one basket.
2. Flexibility of Investments
Multi-asset funds offer greater flexibility as they can invest in any class or combination of asset classes depending on the market conditions and the fund manager’s outlook towards particular assets.
Such flexibility enables them to outperform over longer periods of time when compared to other single asset class investment options such as equity or debt mutual funds.
3. Managing Inflation
If you’re investing for the long term, managing the impact of inflation is critical to ensure that your savings retain their value over time.
By investing in multi-asset funds, you are investing in a basket of assets that have a higher return potential than a single asset class, helping you beat inflation.
4.Portfolio Customization
Multi-asset funds also offer the flexibility to invest in different asset classes with varying risks and returns.
For example, if an investor has excess exposure to equities through their SIPs, they can invest in a multi-asset fund that has exposure to debt and other asset classes like gold.
This offers them the flexibility to customize their portfolio based on risk appetite and investment goals. Want to know more about Multi-asset Funds feel free to contact us.
Final Note
A multi-asset fund is an all-weather option for an investor, as it invests across various asset classes and sectors, thereby reducing the overall risk of the portfolio. This makes multi-asset funds suitable for investors who have a moderate risk appetite.

Life Insurance Corporation of India IPO
About LIC
Life Insurance Corporation of India (“LIC”) was established on September 1, 1956, under the LIC Act by merging and nationalizing 245 private life insurance companies in India. LIC has been providing life insurance in India for more than 65 years and is the largest life insurer in India, with a 61.6% market share in terms of premiums (or GWP), a 61.4% market share in terms of New Business Premium (or NBP), a 71.8% market share in terms of a number of individual policies issued, an 88.8% market share in terms of a number of group policies issued for Fiscal 2021, as well as by the number of individual agents, which comprised 55% of all individual agents in India as at December 31, 2021.
- LIC is ranked 5th globally by life insurance GWP (comparing the LIC’s life insurance premium for Fiscal 2021 to the global peers’ life insurance premium for 2020) and 10th globally in terms of total assets (comparing the LIC’s assets as of March 31, 2021, with other life insurers’ assets as at December 31, 2020).
- LIC is the largest asset manager in India as of December 31, 2021, with AUM of ₹40.1 trillion, on a standalone basis which is 1.1 times the entire Indian mutual fund industry’s AUM.
- The company’s product focus is more on PAR Products
- The primary distribution channel for an individual business is the agency, which accounted for 96.2% of NBP for individual products as of Dec ’21.
- The favourable demographic tailwinds support India’s growth story, combined with under penetration in life insurance. GWP for life insurers is forecasted to grow at 14-15% CAGR in FY21-26 to reach Rs. 12.4 lakh crore.
Issue Offer
Issue Opens on May 4, 2022Issue Close on May 9, 2022Total IPO size (cr)19,517- 20,557Fresh issue(cr)-Offer For Sale (cr)20,557Price Band (INR)902 - 949Market Lot15 shares Face Value (INR)10 Retail Allocation 35% Listing On May 17, 2022
Issue Break-up (%)
QIB Portion50NIB Portion15Retail Portion35
Shareholding (No. of Shares)
Pre Issue6,324,997,701Post Issue6,324,997,701
Indicative Timetable
Finalisation of Basis of Allotment May 12, 2022Refunds/Unblocking ASBA Fund May 13, 2022Credit of equity shares to DP A/c May 16, 2022Trading commences May 17, 2022
Objects of the Issue
- To carry out an offer for
- To achieve the benefits of listing
Outlook and Valuation
LIC's embedded value, which is a measure of the consolidated shareholder's value in an insurance company, is around Rs 5.4 lakh crores as of September 30, 2021. So, at a valuation of ~Rs. 6 lakh crores, the issue is priced at a Price to Embedded Value of ~1.1, which is at a discount compared to its listed Indian as well as global peers. LIC is synonymous with insurance in India and enjoys a huge competitive advantage in terms of brand value, a huge network of agents and behemoth scale.
However, there are concerns with the company like losing market share to private players, lower profitability & revenue growth compared to private players, lower VNB margins and short term persistency ratios, but the valuation at Price to Embedded Value of 1.1 discounts the above concerns.
The company plans to focus on protection products, non-par products, and linked products to improve its VNB margins in the future. The issue has an Rs. 60 discount for policyholders and an Rs. 45 discount for employees and retailers.
Nevertheless, investors must be aware that the business of insurance is long term in nature; therefore we recommend this issue for the long term only.
KEY MANAGERIAL PERSONNEL
- Raj Kumar is the Managing Director of LIC. He joined LIC in the year 1984 and has experience in the insurance sector. He has also served as the CEO of LIC Mutual Fund Asset Management Ltd and was also the zonal manager, Bhopal, executive director (estate and office services), Mumbai, amongst others, of LIC. He was also the senior divisional manager of the Gorakhpur and Jaipur divisions of LIC.
- Siddhartha Mohant, Ipe Mini, and Bishnu Charan Patnaik are the other three managing directors.
- Pramod Ranjan Mishra is the Executive Director (investment operations) and Chief Investment Officer of LIC. Previously, he has held various other positions in LIC and has also held the position of CEO, LIC (Nepal) Ltd.)
- Muraleedharan Purushothaman is the Executive Director – of marketing/ product development and chief marketing office of LIC. He joined LIC on November 1, 1985. He has also held several other positions in LIC and was also the CEO of Life Insurance Corporation (Nepal) Ltd.
- Sunil Agrawal is the Chief Financial Officer of LIC. He joined LIC on February 21, 2022.
- Tablesh Pandey is the Executive Director (investment – risk management and research)/ chief risk officer/ actuarial core group central office) of LIC. He joined LIC on February 22, 1988.
- Pawan Agrawal is the Company Secretary and Compliance Officer of LIC. He joined LIC on April 16, 2021.
COMPETITIVE STRENGTHS
- 5th largest life insurer globally by GWP and the largest player in the fast-growing and underpenetrated Indian life insurance sector.
- A behemoth, having a huge scale leading to one of the lowest operating expense to income ratios in the Industry.
- Great brand value and product recall.
- The largest network of agents.
- One of the largest distribution networks and geographical reach.
- Largest asset manager in India with an established track record of financial performance and profitable growth.
KEY STRATEGIES
- Increasing market share of bancassurance channel by tying up with more bank partners and improving their productivity by providing them with digital solutions for on-boarding customers for their products.
- Increasing up-selling and cross-selling to individual customers and beneficiaries of group products to cover their varied financial needs.
- Improving the share of non-participating products by increasing the focus on sales of Ulip, protection products, pension/annuity products and health insurance.
- Increasing direct sales of their individual products on their website by increasing marketing of their corporation’s website and adding more products that are available for purchase on their website.
KEY CONCERNS
- The government will still be the major shareholder and key manager, thus any future government intervention or adverse action might be detrimental to shareholders.
- Insurance is a complex business for novice investors to understand.
- There are concerns with the company like losing market share to private players, lower profitability & revenue growth compared to private players, lower VNB margins, and short-term persistency ratios.
- High dependency on agency network, increasing its commission costs.
COMPARISON WITH LISTED INDUSTRY PEERS (AS OF 31ST MARCH 2021)
Name of the Company EPS (Basic)EV Rs. BNP/EV Total Income (Cr)RoNW (%) Life Insurance Corporation of India 4.705, 396.81.1405, 85045.65% Peer Group SBI Life Insurance Co.14.55302.03.7750,25014.00%HDFC Life Insurance Co.6.74295.43.9638,58015.75%ICICI Prudential Life Insurance Co.6.66302.02.4935,73010.48%
FINANCIALS (RESTATED CONSOLIDATED)
Particulars (Rs. In Millions)FY 2021FY 2020FY 2019Equity Share Capital100.00100.00100.00Other Equity6,705.47891.66798.44Net Worth6,514.64854.65815.33Premium Earned405,398.50382,475.52339,971.63Income from Investments285,520.42242,836.31225,043.54EBITDA2,980.352,718.522,642.37Net Profit for the year2,974.142,710.482,627.38
Low-Risk Investment Options
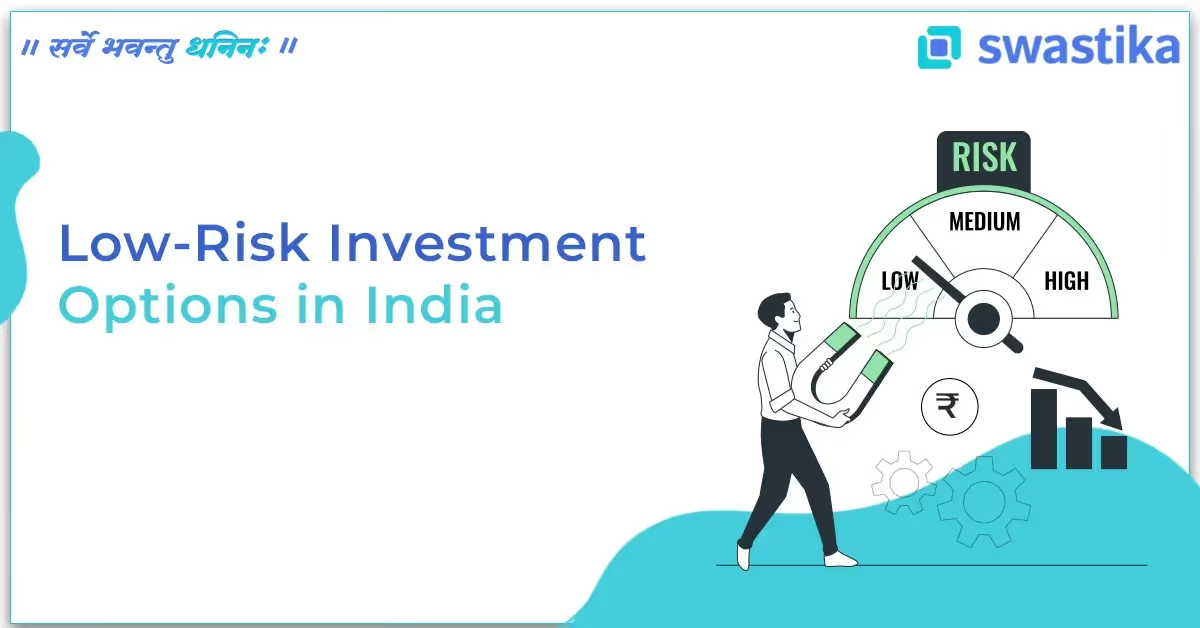
Nowadays, everyone is looking for better returns. But the higher the return, the higher the risk. This is where low-risk investment options in India come into play.
If you are an investor who prefers safety to risk, then you are probably interested in low-risk investments.
The challenge with low-risk investments is that they don't offer super returns. They mostly guarantee capital preservation and a modest rate of return.
One way to maximize your income while minimizing risk is to diversify your investments across different asset classes. Here's a list of some of the most popular low-risk investment options in India.
Get the detailed Information about low-risk investments in India - call us at 0120 4400700
List of Low-Risk Investment Options in India
Public Provident Fund (PPF)
Public Provident Fund (PPF) is a long-term investment and savings instrument that is backed by the Government of India.
It offers an attractive rate of interest and returns are fully exempted from tax. It can be opened at any post office or designated branch of public sector banks in India. PPF accounts can now also be opened online.
Tenure - 15 Years
Objective - Long-term Investment Goals
Tax on returns - Nil
Interest rate - 7.9 percent
Tax on investments Nil up to Rs 1.5 lakh under Section 80C of Income Tax Act, 1961
Also Read - PPF Vs Mutual Fund SIP: Which Investment Instrument Gives You Better Returns
Reserve Bank of India (RBI) Bond
The Reserve Bank of India (RBI) Bond is the most popular low-risk investment option in India. It offers tax benefits under Section 80C and the interest earned is taxable as per your income tax slab rate.
If you choose to invest in RBI Bonds, here are a few things you need to know:
Eligibility for investment: You should be an Indian citizen above the age of 18 years.
Max amount allowed for investment: You can only invest up to 10 lakhs in these bonds.
Rate of interest: 7.75 per cent, payable annually.
Mutual Funds
Investing in mutual funds is a low-risk, high-return investment avenue. They invest in both equity and debt instruments, thereby generating returns for investors by offering them a steady stream of income and capital appreciation.
Mutual funds are managed by professional fund managers who invest an investor’s hard-earned money in different types of securities like stocks, bonds, and gold to earn a higher return on investment.
In the past 10 years, the average return generated by mutual funds was 12 per cent annually.
Though the returns vary depending on the asset class you choose. In equity mutual funds, the returns may be higher or lower than the average depending on the fund category you have chosen. Consult with our experts about investing in Mutual Funds
Gold ETFs
Gold has always been perceived as one of the safest investment options. It is also considered to be a hedge against inflation.
But gold in physical form does not generate any income and requires safe storage facilities. Also, there are security-related problems involved in storing gold at home.
However, if you invest in gold exchange-traded funds (ETFs) instead of buying physical gold, then these problems can be avoided. Gold ETFs invest in physical gold and track its price movements.
The only difference between investing in a Gold ETF and investing in physical gold is that the former is more liquid compared to the latter.
As per the latest data available on the website of the Association of Mutual Funds of India (AMFI), the average return generated by Gold ETFs over one year is 21%.
Also Read - Investment in Commodity Trading
Stocks
Investing in the stock market is risky and requires a lot of research from the investor to understand the fundamentals of investing.
If you want to trade in stocks or invest in equity funds, you need to have your PAN card ready as it is mandatory to trade in equity.
For those who want to invest directly in stocks, it is important to know how much money you want to invest and how long you are willing to wait for your investment to grow.

Step-Up SIP - Working, Aim and Benefits
Step-Up SIP
A Step-Up SIP is an investment option through which the SIP investor can increase the monthly installment of the SIP by a predetermined percentage every year.
The investment amount gets increased every successive year for a specific period of time. Step-UP SIP helps the investors save more money as their income increases with time.
Investors can put more money into the mutual fund scheme and benefit from compounding with such an investment option.
If you are looking for ways to beat inflation and increase your wealth, then a Step-Up SIP might be the right choice for your investment portfolio.
To know more about Step-Up SIPs, feel free to call us at - 0120 4400700
How Do Step-Up SIPs Work?
To begin a Step-Up SIP, choose an investment amount you can afford to contribute monthly and continue increasing it by a fixed percentage each year.
For instance, with a SIP of ₹5,000 per month (increasing by 10 per cent every year), you can set aside ₹60,000 over one year;
After one year, the amount increases to ₹5,500 per month (₹5,000 plus 10 percent), you will be able to save ₹66,000 in the second year.
The total investment will be higher than if you were to invest ₹6,000 from the start.
AIM of Step-Up SIP
Mutual funds have become a popular investment option because of their benefits. These include the potential to earn higher returns, risk diversification, and professional money management.
However, many people are prone to getting impatient with their investments and making poor decisions in haste. For such investors, step-up SIPs can be an ideal solution.
Key Benefits of Step-Up SIPs
Helps You Beat Inflation
Inflation is one of the biggest factors that affect your personal finance and long-term investments.
When inflation rises, your expenses will also rise accordingly, which means you will need more money in the future than today to maintain your standard of living or achieve your financial goals.
This is where Step-Up SIPs can help you beat inflation over the long term. Step-up SIPs are good for investors with a high-risk appetite and who want to invest their money in equity funds.
When you invest in an equity fund through SIP, the cost of each SIP installment increases by a specified fixed amount every year (say 10%) until the completion of the investment period (say 10 years). This helps you increase your investment value over time as per inflation rates.
Regular Increase in Investment Amount:
The SIP installment amount increases at a predefined interval, which helps build a corpus to meet future financial goals.
This helps increase the investment value over time and helps investors maintain their lifestyle while investing more. In other words, the investor saves money on the interest rate and tax benefits.
Step-Up SIPs have various advantages over other forms of savings schemes. Firstly, you can make investments in small amounts over regular intervals.
Secondly, investors need not worry about market fluctuations as they regularly invest small amounts of money.
Thirdly, Step-Up SIPs are ideal for meeting future financial goals such as children's education, marriage expenses, and retirement planning.
Rupee Cost Averaging
Rupee cost averaging works in your favor by buying more units when the market is down and less when the market is up. As a result, you end up paying a lesser cost per unit.
Power of Compounding and Long-Term Capital Appreciation:
As the investment amount increases, you can make the most of compounding and reap big rewards in the long run.
Convenience
Step Up SIPs are automated and convenient as they are deducted directly from your bank account on a pre-agreed date.
There is no need to prepare cheques, and you don't have to stress about forgetting to make the payment or keeping track of renewal dates.
Tax Benefits
Your investment in mutual funds/equity-linked savings schemes (ELSS) is exempted under Section 80C of the Income Tax Act up to Rs 1,50,000/-, which reduces your taxable income.
Returns
Mutual funds invest in stocks and shares of the market, which gives you better returns than FDs and other fixed-income investments.
Conclusion
Step-Up SIPs offer a great way to increase your investment amount with time. They help you stay invested during market downturns and ensure that you reap the benefits of compounding through long-term investing.
Big Budget


Popular Articles





.avif)
.avif)

.avif)



START YOUR INVESTMENT JOURNEY
Get personalized advice from our experts
- Dedicated RM Support
- Smooth and Fast Trading App
