


Nifty 50 31 Jul 2026 Morning Market Summary


Key Takeaways
- Prev session close reference: Nifty 50 Pivot 24370.9; R1 24442.1; R2 24500.6; S1 24312.4; S2 24241.2.
- Standout mover: TRANSPEK from 1101.1 -> 1321.3 (+20.00%).
- Biggest loser: NARMADA from 36.19 -> 17.02 (-52.97%).
- Market-wide Index Options PCR: Not available for this session.
Nifty 50 Support And Resistance Levels For 31 Jul 2026
Pivot: 24370.9; R1: 24442.1; R2: 24500.6; S1: 24312.4; S2: 24241.2. The Pivot is the central reference; R1 and R2 above are resistance hurdles, while S1 and S2 below are cushions. All these numbers come from yesterday's close as the basis for today's session.
In plain language, if the price sits above R1, the near-term tone is mildly bullish; above R2, the bias could extend higher; if it slips below S2, the bias could turn bearish. For deeper stock-level insights, Swastika's Sarthi AI stock assistant.
Nifty Bank Pivot Levels For 31 Jul 2026
Pivot: 57271.9; R1: 57404.2; R2: 57543.55; S1: 57132.55; S2: 57000.25. Those levels mirror the same logic as Nifty 50 for the Bank Nifty.


Top 5 Gainers (31 Jul 2026 Session, EQ Series, Liquid Names Only)
| Ticker | From | To | Change |
|---|---|---|---|
| TRANSPEK | 1101.1 | 1321.3 | (+20.00%) |
| UEL | 128.11 | 153.73 | (+20.00%) |
| YASHO | 3215.6 | 3858.7 | (+20.00%) |
| RSDFIN | 92.29 | 110.74 | (+19.99%) |
| DCI | 276.75 | 329.7 | (+19.13%) |
Top 5 Losers (31 Jul 2026 Session, EQ Series, Liquid Names Only)
| Ticker | From | To | Change |
|---|---|---|---|
| NARMADA | 36.19 | 17.02 | (-52.97%) |
| EXPLEOSOL | 906.6 | 802.85 | (-11.44%) |
| THANGAMAYL | 5807.0 | 5226.5 | (-10.00%) |
| ASIANTILES | 60.71 | 54.68 | (-9.93%) |
| SIGNPOST | 311.2 | 283.55 | (-8.88%) |
Market-Wide Index Options PCR
Market-wide Index Options PCR: Not available for this session.
Frequently Asked Questions
Nifty 50 Support and Resistance Levels for 31 Jul 2026
Pivot 24370.9; R1 24442.1; R2 24500.6; S1 24312.4; S2 24241.2. These are reference points for today's trading, derived from yesterday's close.
Nifty Bank Pivot Levels for 31 Jul 2026
Pivot 57271.9; R1 57404.2; R2 57543.55; S1 57132.55; S2 57000.25. These are yesterday's close-based reference levels for today.
Top Gainers on 31 Jul 2026
TRANSPEK: 1101.1 -> 1321.3 (+20.00%); UEL: 128.11 -> 153.73 (+20.00%); YASHO: 3215.6 -> 3858.7 (+20.00%); RSDFIN: 92.29 -> 110.74 (+19.99%); DCI: 276.75 -> 329.7 (+19.13%).
Top Losers on 31 Jul 2026
NARMADA: 36.19 -> 17.02 (-52.97%); EXPLEOSOL: 906.6 -> 802.85 (-11.44%); THANGAMAYL: 5807.0 -> 5226.5 (-10.00%); ASIANTILES: 60.71 -> 54.68 (-9.93%); SIGNPOST: 311.2 -> 283.55 (-8.88%).
PCR for Market-wide Index Options today
Market-wide Index Options PCR: Not available for this session.
Conclusion
Yesterday's close reference levels set the stage for today's open. Nifty 50 pivot at 24370.9 with R1 24442.1 and R2 24500.6; S1 24312.4; S2 24241.2. The standout mover TRANSPEK posted a 20% gain while NARMADA slid 52.97% from 36.19 to 17.02. Market-wide Index Options PCR remains not available for this session. Watch how price interacts with the pivot and resistance/support on open, and consider exploring deeper stock-level insights with Swastika's Sarthi AI stock assistant.
Open your trading and demat account here
Reference :
1 : Nseindia
Latest Articles

What is a Covered Call? Overview of a Covered Call Strategy


As an investor, navigating the stock market can often involve balancing potential profits with risks. One strategy that stands out for its is the Covered Call Strategy. This approach allows you to generate income from your stock holdings Let's dive into what a covered call is and how this strategy can benefit you as an investor.
Understanding a Covered Call Strategy
Imagine you own shares of a company. You believe the stock may rise in the long run but don't expect gains in the near term. However, you still want to earn some income from these shares in the meantime. This is where a covered call strategy comes in
In a covered call strategy, an investor sells a call option on a stock they already own. This nets them a premium from the sale of the option. the call option is sold as an Out of The Money (OTM) call, meaning the option's strike price is higher than the current stock price. The call option would not get exercised unless the stock price increases above the strike price. Until then, the investor retains the premium as income, making this strategy attractive for those who are neutral to moderately bullish about their stock.
How a Covered Call Strategy Works
To use a covered call option strategy, you must first own the stock of a company. Let's assume you already hold the stock, showing a bullish movement. Over time, you become unsure about the stock's short-term upside potential and don't expect a significant price increase. Here's what you can do:
- Sell a Call Option: You sell a call option contract at a strike price higher than your stock's purchase price. The buyer of the call option pays you a premium for this contract.
- Collect the Premium: Regardless of whether the option is exercised, you keep the premium. This becomes your immediate income from the stock.
- Outcome Scenarios: After executing a covered call strategy, one of three scenarios can occur:some text
- Stock Price Remains Stable or Falls: The call option expires worthless, and you keep both the premium and your shares.
- Stock Price Rises Slightly: The stock price increases but remains below the strike price. The call option still expires worthless, allowing you to keep the premium and benefit from the stock's appreciation.
- Stock Price Rises Significantly: The stock price rises above the strike price. The call option is exercised, and you must sell your shares at the strike price. You keep the premium and receive the strike price for your shares, potentially missing out on further gains beyond the strike price.
When to Use a Covered Call
The covered call strategy works particularly well in the following situations:
Generating Income
The primary use of the covered call strategy is to generate income. If you own assets like stocks or ETFs that you're willing to sell at a certain price, selling a covered call can help generate additional income.
Neutral or Slightly Bullish Market
The covered call strategy is effective in a neutral or slightly bullish market. If you expect the price of an asset to remain relatively stable or increase slightly, selling a covered call can allow you to generate income while still owning the asset and benefiting from modest price increases.
Reducing Risk/Hedging
By selling a call option, you can theoretically limit downside risk if the price of the underlying stock falls. If the stock price drops below the strike price of the call option, the option will expire worthless, and you'll still own the underlying stock, which you can sell or hold for potential future gains.
When to Avoid a Covered Call
A covered call should be avoided in the following situations:
Expecting a Stock Price Rise
If you expect the stock to rise significantly in the near future, selling a covered call may limit your potential upside. It's better to hold onto the stock and let it appreciate.
Facing Serious Downside
If the stock looks like it's going to drop significantly, using a covered call to get extra cash might not be wise. In such cases, it’s probably best to sell the stock or consider short selling to profit from its decline.
Advantages of a Covered Call Strategy
- Generates Income: Covered calls generate income from holdings that wouldn't otherwise provide a cash flow stream.
- Adds to Returns: Investors periodically sell covered call options to enhance a position's return.
- Acts as a Hedge: A covered call offers some protection by reducing the breakeven price due to the premium.
- Low-Risk Strategy: Selling covered calls is easy and low-risk because the stock position "covers" the short call.
Conclusion
In summary, covered calls can be a strategy for investors looking for risk management and income generation. By merging stock ownership with the sale of call options, investors can increase their potential returns in a moderate appreciation of stock price. This strategy provides a balance between earning additional income and managing risks, making it a valuable tool for an investor.
Learn more about financial terminologies with Swastika!
How to Use Open Interest for Intraday Trading
What is Open Interest?
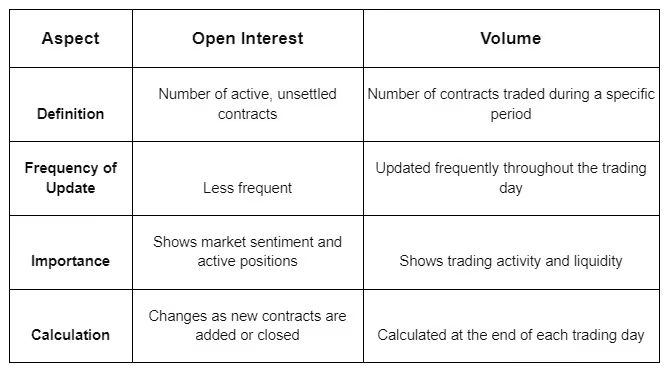
Open interest refers to the total number of outstanding options and futures contracts that have not been settled, closed out, or exercised. In simple terms, it's the number of active positions in options and futures contracts. For example, if a buyer and a seller enter into a new call option contract, open interest increases by one. Conversely, if the same buyer and seller close their contract by taking an opposite position, open interest decreases by one. If the buyer sells their contract to another buyer, the open interest remains unchanged, as there is no net change in open positions.
How to Use Open Interest for Intraday Trading
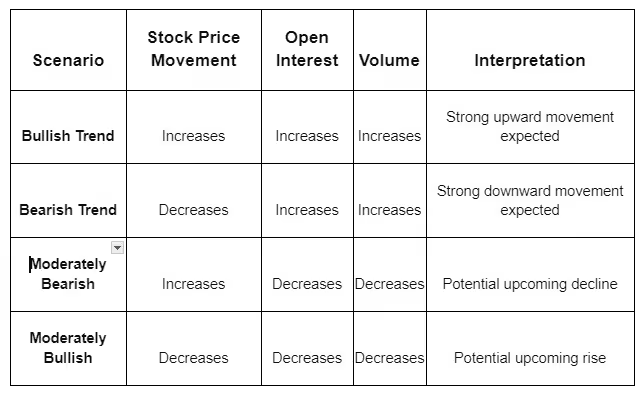
- Bullish Trend: If the stock price rises along with an increase in open interest and volume, it shows a bullish trend.
- Bearish Trend: If the stock price falls along with an increase in open interest and volume, it shows a bearish trend.
- Moderately Bearish: If the stock price rises but open interest and volume decrease, it shows a moderately bearish trend.
- Moderately Bullish: If the stock price falls but open interest and volume decrease, it shows a moderately bullish trend.
Open Interest vs. Volume
Importance of Open Interest
Monitoring open interest provides valuable insights for making decisions in financial markets. Here are some key points:
- Market Sentiment Indicator: Changes in open interest shows bullish or bearish sentiment of the market.
- Price Trend Confirmation: Rising open interest signal uptrends, while falling open interest may signal downtrends.
- Reversal Indication: Sudden changes in open interest can hint at trend reversals.
- Liquidity and Trading Activity: High open interest shows increased market liquidity and trading activity.
- Options Expiry Consideration: Important in options trading, helps in influencing decisions around expiry dates.
- Contrarian Indicator: Analyses extreme open interest situations for potential contrarian trading opportunities.
Example in INR
Suppose an investor is tracking a stock with the following details:
- Current Stock Price: ₹500
- Open Interest: 10,000 contracts
- Volume: 5,000 contracts
Conclusion
By analyzing open interest along with volume and price action, you can identify market trends. Once you've identified the trend, you can take appropriate positions. To get specific open interest data for an asset, use an open interest calculator, which is often available online for free.

Stock Market Vs Commodity Market
What is the Equity Market?
The equity market, commonly known as the stock market or share market, is a platform where people buy and sell shares of companies. In India, these shares are traded on stock exchanges or directly between individuals. To trade shares online in India, you need a "demat account" and a "trading account." These accounts function like digital wallets for your shares.
What is the Commodity Market?
Commodities are important resources that can be traded for other commodities of the same type. They are divided into two categories: hard commodities like gold and oil, and soft commodities like agricultural products and cattle. The commodity market is a place where these commodities are bought and sold, either physically or virtually. Investments in commodities can be made directly or through commodity futures contracts.
Key Differences: Equity Market vs. Commodity Market
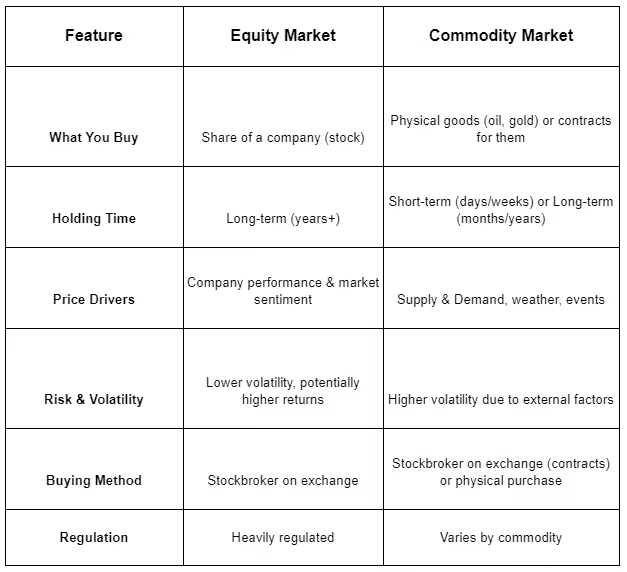
Knowing the differences between these two markets can help you decide which one suits your investment goals better. Here are some key differences:
Performance Comparison
The stock market and commodity market can perform differently:
- Stock Market: Historically, the stock market has provided higher returns, with an average annual return of around 10% over the last 100 years.
- Commodity Market: The commodity market has averaged around 3% annual returns.
Factors influencing these markets differ as well. Stock market performance is driven by company earnings, economic growth, interest rates, and geopolitical events. Meanwhile, the commodity market is influenced by supply and demand factors like weather conditions, production levels, and geopolitical events.
Which Market Should You Choose?
Choosing between the stock market and the commodity market depends on your investment goals, risk tolerance, and investment horizon:
- Long-Term Growth: The stock market may be better for long-term growth and capital appreciation.
- Short-Term Speculation: The commodity market may be suitable for short-term speculation and hedging against inflation.
Both markets carry risks. The stock market is subject to market volatility and company-specific risks, while the commodity market is influenced by supply and demand factors and geopolitical risks. It's essential to conduct thorough research and consult with a financial advisor before making any investment decisions.
Example: Comparing Returns in INR
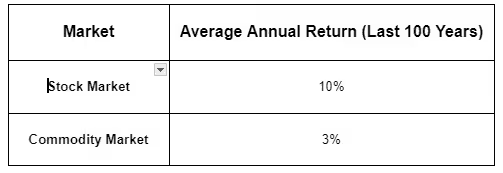
For instance, if you invested ₹1,00,000 in the stock market, you could expect an average return of ₹10,000 annually. In contrast, the same investment in the commodity market would yield around ₹3,000 annually.
Conclusion
Both the equity and commodity markets offer unique opportunities and risks. Understanding these differences and how each market works can help you make informed investment decisions. Whether you're looking for long-term growth in the stock market or short-term gains in the commodity market, it's crucial to align your investments with your financial goals and risk tolerance.
Understanding Commodity Transaction Tax (CTT): A Comprehensive Guide
In the realm of financial markets, various taxes and fees play a crucial role in regulating transactions and generating revenue for the government. One such tax that impacts commodity trading in India is the Commodity Transaction Tax (CTT). In this comprehensive guide, we will delve into the details of CTT, exploring its purpose, impact, and implications for traders and investors.
What is Commodity Transaction Tax (CTT)?
Commodity Transaction Tax (CTT) is a tax imposed by the Indian government on transactions executed on commodity exchanges. Introduced in the Finance Act, 2013, CTT is similar to the Securities Transaction Tax (STT) imposed on equity transactions. The primary objective of CTT is to generate revenue for the government and discourage speculative trading in commodity markets.
How Does CTT Work?
- CTT is imposed on the value of taxable commodities transactions conducted on recognized commodity exchanges in India. The tax rate varies depending on the type of commodity and the nature of the transaction. As of the latest guidelines, the following rates apply:
- CTT tax is 0.01% for non-agricultural commodities futures contracts and 0.05% for non-agricultural commodities options contracts. While agricultural commodities are exempt.
- CTT is typically collected by the commodity exchange at the time of the transaction and passed on to the government. It is applied to both buy and sell transactions, thereby impacting both buyers and sellers in the commodities market.
Purpose and Objectives of CTT
The imposition of CTT serves several purposes and objectives, including:
- Revenue Generation: CTT serves as a source of revenue for the government, contributing to the overall tax collection and fiscal management.
- Discouraging Speculative Trading: By imposing a tax on commodities transactions, especially in non-agricultural commodities, CTT aims to discourage speculative trading and promote more stable and orderly commodity markets.
- Level Playing Field: CTT helps create a level playing field between different asset classes by subjecting commodity trading to similar taxation as equity trading, where STT is applicable.
- Regulatory Oversight: CTT also serves as a regulatory tool, enabling authorities to monitor and regulate commodities transactions more effectively.
Impact of CTT on Traders and Investors
The imposition of CTT has several implications for traders and investors active in commodity markets:
- Cost of Transactions: CTT adds to the overall cost of trading in commodities, as traders are required to pay the tax on every transaction executed on the exchange.
- Impact on Trading Volumes: The introduction of CTT may have an impact on trading volumes in commodity markets, as it could discourage high-frequency traders and speculators from participating in the market.
- Risk Management: Traders and investors need to factor in the impact of CTT when creating their trading strategies and risk management plans. The tax can influence decision-making regarding position sizing, trading frequency, and holding periods.
- Market Liquidity: CTT may affect market liquidity in commodity markets, as it could lead to reduced trading activity and narrower bid-ask spreads.
- Compliance Requirements: Market participants need to ensure compliance with CTT regulations and reporting requirements to avoid penalties and legal repercussions.
Challenges and Criticisms of CTT
While CTT serves certain objectives, it has also faced criticism and challenges:
- Impact on Market Efficiency: Critics argue that CTT may hamper market efficiency by reducing liquidity and increasing transaction costs, especially for small investors and hedgers.
- Competitive Disadvantage: Some stakeholders believe that the imposition of CTT puts Indian commodity exchanges at a competitive disadvantage compared to global counterparts where similar taxes are not levied.
- Need for Review: There have been calls for a review of CTT rates and structures to ensure that they strike the right balance between revenue generation and market development.
Conclusion
In conclusion, Commodity Transaction Tax (CTT) is a tax levied on transactions conducted on commodity exchanges in India. It serves various purposes, including revenue generation, discouraging speculative trading, and promoting regulatory oversight. While CTT has implications for traders and investors in commodity markets, it also faces challenges and criticisms regarding its impact on market efficiency and competitiveness. As the commodities market continues to evolve, it remains essential for policymakers to review and adapt CTT regulations to ensure a balance between revenue objectives and market development goals.
Start Investing Today!

Trend Analysis in Share Market for Better Stock Picks
Spotting the Trend: How Trend Analysis Can Help You Pick Winning Stocks
The stock market can feel like a wild ride sometimes, with prices constantly going up and down. But what if you could predict these ups and downs, at least a little bit? Well, that's where trend analysis comes in!
What is Trend Analysis?
Trend analysis is like looking at the flow of the water. Is it uptrend? Is it sideways trend? Or is it downtrend?
By analyzing past price movements and trading volume, trend analysis helps you understand the overall direction of a stock's price. It is a technique used to examine data points over time to identify patterns and predict future movements.
Here's a breakdown of the key ideas:
- Data Points: This could be anything from stock prices to website traffic, depending on what you're analyzing.
- Patterns: By looking at past data points, you can see if there are any recurring trends, like prices going up and down in a specific cycle.
- Predictions: Based on the identified patterns, you can make an educated guess about what might happen in the future.
Types of Trends
There are three main types of trends in the stock market:
- Upward Trend (Bull Market Trend): Prices are generally moving higher over time. This is a good sign for investors looking to buy stocks.
- Downward Trend (Bear Market Trend): Prices are generally moving lower over time. This can be a time to be cautious or even sell some stocks.
- Sideways Trend: Prices are fluctuating within a certain range. This can be a time to wait and see before making a move.
How to Use Trend Analysis
There are many types of trend analysis tools and techniques, but here are two simple ways to get started:
- Moving Averages: This is a line on a stock chart that shows the average price over a certain period (like 50 days or 200 days). An upward sloping moving average suggests an uptrend, while a downward sloping suggests a downtrend.
Picture a line on a stock chart that shows the average price of a stock over a certain period, like the past 50 days or 200 days. If this line is going up, it means the average price is rising, suggesting the stock is on an uptrend. For example, if a stock's 50-day moving average is slowly increasing and is currently at ₹100, while the current price is ₹110, it indicates an uptrend. On the other hand, if the moving average is sloping downward and is at ₹100, while the current price is ₹90, it signals a downtrend.
- Support and Resistance Levels: These are price levels where the stock price has historically found difficulty breaking through. Support levels are areas where the price tends to bounce back up, while resistance levels are areas where the price tends to get rejected and fall back down. Imagine certain price points where a stock tends to bounce back up after falling (support) or struggles to break through and falls back down (resistance).
Let’s say a stock has a support level at ₹120. Whenever the price drops to ₹120, it tends to bounce back up because investors see it as a good buying opportunity. Similarly, if there's a resistance level at ₹150, whenever the price approaches ₹150, it struggles to go higher as investors start selling their shares, causing the price to fall back down.
How to Use Trends to Pick Stocks
Here's how you can use trend analysis to pick better stocks:
- Spot the Trend: First, find out if a stock is on the rise (uptrend) or falling (downtrend). That tells us if it's a good time to buy or sell.
- Double-Check: Use different tools to make sure you're seeing the trend right.
- Time Your Moves: Wait for the right moment to buy or sell.
- Stay Safe: Always have a plan to protect your money. Use stop-loss and take that much risk what you can afford to lose.
Trend analysis can be a powerful tool for stock pickers, but it's important to use it alongside other investment strategies. By understanding trends, you can increase your chances of making profitable investments.
Conclusion
Trend analysis is a valuable tool for identifying stock market movements and making informed investment decisions. By analyzing patterns, using moving averages, and identifying support and resistance levels, investors can spot potential opportunities. However, it should be combined with other strategies and risk management techniques for better results. Understanding trends can enhance decision-making and improve the chances of picking winning stocks.
Learn more about financial terminologies with Swastika!

Understanding the Different Types of Brokers in the Stock Market
Stock market investing can be a great way to grow your wealth, but it can also seem complicated, especially for beginners. One of the first decisions you'll need to make is who will help you navigate this exciting world: a full-service broker or a discount broker? Today, we'll be exploring the types of brokers you can choose when entering the exciting world of stock trading.
What is a Stock Broker?
Before we dive into the different types of stockbrokers, let's first understand what a stock broker actually does. A stockbroker is a professional who helps in the buying and selling of stocks and other securities on behalf of investors. They act as intermediaries between buyers and sellers in the stock market. Share market investment advisors and registered representatives (RRs) are other names for stockbrokers.
Types of Stock Brokers:
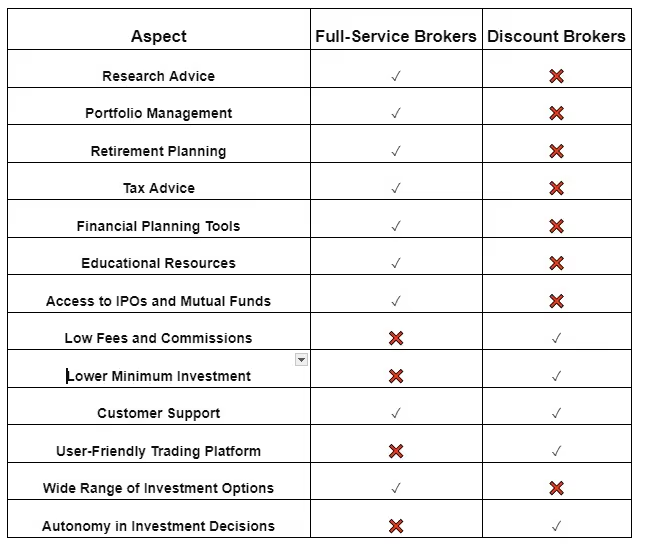
- Full-Service Brokers: Picture them as your financial advisors, offering complete services to guide you through the complex world of investing. Here's what you can expect:
- Personalized Advice: Full-service brokers provide customized investment advice based on your financial goals, risk tolerance, and market conditions.
- Diverse Investment Options: Full-service brokers provides a wide range of investment options, including stocks, bonds, mutual funds, and more.
- Research Reports: They offer in-depth research reports and market analysis to help you make better investment and stock trading decisions.
- Portfolio Management: Many full-service brokers offer portfolio management services, where they actively manage your investments on your behalf.
- Complete Financial Planning: Beyond just buying stocks, full-service brokers offers complete financial planning services, covering areas like retirement planning, tax optimization, and estate planning.
- Additional Services: From retirement planning to tax advice, full-service brokers go the extra mile to meet all your financial needs.
- Examples of full-service brokers in India include Swastika Investmart, ICICI Direct, HDFC Securities, and Kotak Securities.
- Discount Brokers: A discount broker or online stockbrokers would typically just buy and sell on behalf of their clients.
- Cost-Effective Trading: Discount brokers take lower fees and commissions compared to their full-service brokers, making them an attractive option for investors for more affordable trading.
- User-Friendly Trading Platforms: Discount brokers provide simple and user-friendly trading platforms with features for executing trades efficiently.
- Independent Investing: With a discount broker, you have full control over your investment decisions. Whether you're buying stocks, ETFs, or options, you have the complete independence to execute trades according to your investment strategy and market analysis.
- Minimal Account Maintenance Requirements: Discount brokers often have lower minimum account balance requirements, making them affordable to a broader range of investors.
- Limited Customer Support: While discount brokers may offer basic customer support services, they generally provide less personalized assistance compared to full-service brokers. Examples of discount brokers in India include Tradingo, Zerodha, Upstox, and 5paisa.
Comparison of Different Types of Brokers: Let's compare the key features of full-service, discount, and online brokers in the table below:
Conclusion:
Choosing the right type of broker is an important decision for any investor. Whether you prefer personalized advice and portfolio management or are comfortable making your own investment decisions, there's a broker out there to suit your needs. We hope this guide has helped understand the types of stock market brokers.
Learn more about Stock Market!
Big Budget


Popular Articles





.avif)
.avif)

.avif)



START YOUR INVESTMENT JOURNEY
Get personalized advice from our experts
- Dedicated RM Support
- Smooth and Fast Trading App
