


Nifty 50 Morning: 03 Aug 2026 Market Summary



Key Takeaways
- Nifty 50 pivot levels (from the previous session's close): Pivot 24687.92; R1 24860.68; R2 24947.07; S1 24601.53; S2 24428.77.
- Top gainers: AARTISURF 400.85 -> 481.0 (+20.00%), ALPHAGEO 220.13 -> 264.15 (+20.00%), IITL 127.68 -> 153.21 (+20.00%), UEL 153.73 -> 184.47 (+20.00%), VINDHYATEL 1985.9 -> 2383.0 (+20.00%).
- Top losers: INDOTHAI 213.43 -> 170.75 (-20.00%), ZEEL 114.55 -> 98.14 (-14.33%), XPROINDIA 1500.4 -> 1302.8 (-13.17%), NITTAGELA 1922.5 -> 1729.2 (-10.05%), EPACKPEB 267.31 -> 243.95 (-8.74%).
- PCR: Not available for this session.
Nifty 50 Support And Resistance Levels For 03 Aug 2026
Pivot levels are reference points derived from the previous session's close. They are not live intraday data. For Nifty 50: Pivot 24687.92; R1 24860.68; R2 24947.07; S1 24601.53; S2 24428.77.
A pivot is a central reference point. If the price trades above this pivot, the first resistance above it is R1 and then R2; if below, S1 is the first support and S2 is the second.
Nifty Bank Support And Resistance Levels For 03 Aug 2026
Pivot: 57987.28; R1: 58508.62; R2: 58769.28; S1: 57726.62; S2: 57205.28.
The central Pivot is the reference for Bank Nifty; use above/below to gauge intraday direction; R1 and R2 above, S1 and S2 below.


Top 5 Gainers On 03 Aug 2026
| Stock | From | To | Change |
|---|---|---|---|
| AARTISURF | 400.85 | 481.0 | +20.00% |
| ALPHAGEO | 220.13 | 264.15 | +20.00% |
| IITL | 127.68 | 153.21 | +20.00% |
| UEL | 153.73 | 184.47 | +20.00% |
| VINDHYATEL | 1985.9 | 2383.0 | +20.00% |
Top 5 Losers On 03 Aug 2026
| Stock | From | To | Change |
|---|---|---|---|
| INDOTHAI | 213.43 | 170.75 | -20.00% |
| ZEEL | 114.55 | 98.14 | -14.33% |
| XPROINDIA | 1500.4 | 1302.8 | -13.17% |
| NITTAGELA | 1922.5 | 1729.2 | -10.05% |
| EPACKPEB | 267.31 | 243.95 | -8.74% |
Market-Wide Index Options PCR
Market-wide Index Options PCR: Not available for this session.
Frequently Asked Questions
What are the Nifty 50 pivot levels for 03 Aug 2026?
Pivot: 24687.92; R1: 24860.68; R2: 24947.07; S1: 24601.53; S2: 24428.77.
What are the Nifty Bank pivot levels for 03 Aug 2026?
Pivot: 57987.28; R1: 58508.62; R2: 58769.28; S1: 57726.62; S2: 57205.28.
Who were the top gainers on 03 Aug 2026?
AARTISURF: 400.85 -> 481.0 (+20.00%), ALPHAGEO: 220.13 -> 264.15 (+20.00%), IITL: 127.68 -> 153.21 (+20.00%), UEL: 153.73 -> 184.47 (+20.00%), VINDHYATEL: 1985.9 -> 2383.0 (+20.00%).
Who were the top losers on 03 Aug 2026?
INDOTHAI: 213.43 -> 170.75 (-20.00%), ZEEL: 114.55 -> 98.14 (-14.33%), XPROINDIA: 1500.4 -> 1302.8 (-13.17%), NITTAGELA: 1922.5 -> 1729.2 (-10.05%), EPACKPEB: 267.31 -> 243.95 (-8.74%).
Is Market-wide Index Options PCR available for 03 Aug 2026?
Market-wide Index Options PCR: Not available for this session.
Conclusion
These levels are PREVIOUS SESSION closing levels used as reference points for today's trading, not live intraday data. The Nifty 50 pivot is 24687.92 with resistance at 24860.68 and 24947.07 and support at 24601.53 and 24428.77. The Bank Nifty pivot is 57987.28 with resistance at 58508.62 and 58769.28 and support at 57726.62 and 57205.28.
Watch price action around these pivot levels at the open, particularly near S1 24601.53 and R1 24860.68, and consider the five gainers and five losers from yesterday as a guide to sector momentum. For deeper stock-level insights, try Swastika's Sarthi AI stock assistant.
Open your trading and demat account here
Reference :
1 : Nseindia
Latest Articles

Krsnaa Diagnostics IPO Ltd


Krsnaa Diagnostics Ltd provides a comprehensive variety of technology-enabled diagnostic services to public and private hospitals, medical institutions, and community health centres across India, including imaging (including radiology), pathology/clinical laboratory, and teleradiology. Across many divisions, the company delivers high-quality, all-inclusive diagnostic services at reasonable prices. Krsnaa Diagnostics Ltd's Initial Public Offering (IPO) will commence for bidding on August 4, 2021, and end on August 6, 2021. A new offering of Rs 400 crore will be part of the company's IPO. It also includes an offer by the company's existing promoters and shareholders to sell up to 8.53 million or 85.30 lakh shares. PHI Capital Growth Fund will sell 1.6 million or 16 lakh shares, Kitara PIIN 1104 will sell up to 3.34 million or 33.4 lakh shares, Somerset Indus Healthcare Fund I Ltd will sell up to 3.56 million or 35.6 lakh shares, and Lotus Management Solutions will sell up to 21,380 shares in the Offer for Sale (OFS).
About the IPO
Krsnaa Diagnostics plans to raise Rs 1,213.33 crore through its first public offering. The issue is made up of a new issue of Rs 400 crore and an offer for sale (OFS) for Rs 813.33 crore, comprising 8,525,520 equity trading shares having a face value of Rs 5 each. On August 3, a day before the IPO opens for subscription, all anchor reservations will take place. The issue price range was Rs 933 to Rs 954 per equity share, with a face value of Rs 5 per share. It's an IPO with a book-built issue. The offering has a grey market premium of Rs 400, implying that the shares are trading on the unlisted market at a premium of Rs 1,333 to Rs 1,354 per share. The minimum lot size for the Krsnaa Diagnostics IPO is 15 shares, with an associated application fee of Rs 14,310. On the top end of the lot, there are 195 shares with a Rs 186,030 application amount. Retail investors can apply for up to 13 lots at the higher end of the lot size for this issue.
Strength
For starters, it is one of India's most well-known diagnostic chains. The company's financial picture. It also provides a broad and diversified variety of diagnostic services because of its complicated network and presence in 13 locations, it has a large market footprint. In addition, the firm has a solid financial track record.
Objectives
- A proposal to funding the establishment of diagnostics centres in Punjab, Karnataka, Himachal Pradesh, and Maharashtra.
- Repayment/prepayment, in whole or in part, of our Company's borrowings from banks and other financial institutions.
- General business objectives
Strategies:
- Continually grow our footprint in India
- Expand diagnostic services with an emphasis on specialist diagnostics
- Increase your digital footprint
- Maintain a high level of social impact
- Continue to increase profit and efficiency
- Opportunistic purchases expand business and geography.
Investment allocation:
When it comes to investment allocations, the retail part is only 10%. The SME IPO has a 75 percent reservation for qualified institutional buyers (QIBs) and a 15% reservation for non-institutional investors (NIIs).
Financial Highlights:
The firm was able to sustain a high level of performance. For the fiscal year ending March 31, 2020, the film earned Rs 271.38 crore in total revenue. This was increased from Rs 214.31 crore the previous year. The company's net losses increased to Rs 111.95 crore in FY20, up from Rs 58.05 crore the previous year. Krsnaa Diagnostics, on the other hand, had a significant decrease in spending and an increase in income.For the nine-month period ending December 31, 2020, the net profit and sales were Rs 195.93 crore and Rs 562.7 crore, respectively. This trend was caused by increased income from operations as a result of the pandemic's outbreak.
Recommendation: The business model is scalable, and in the present climate, where post-COVID health consciousness is at an all-time high, this industry is only going to grow in the next years. This represents a big market for the firm as well as significant potential.The firm intends to use the proceeds of the offering to pay down debt, which is usually valued accretive for service-oriented enterprises. ) The IPO price for Krsnaa Diagnostics discounts the most recent year's profits at roughly 21X, which is lower than the comparable group. We recommend you to subscribe(Aggressive Investors).
Rolex Rings IPO
Introduction:
Rolex Rings, Incorporated in 2003, based in Rajkot, Gujarat, is one of the country's largest makers of forged and machined components. The business has established a long-term relationship with its clients.
Rolex Rings made a profit of Rs 86.95 crore for the fiscal year ended March 31, 2021, up from Rs 52.94 crore the previous year, its net profit at a compounded annual growth rate stands at 21.3%.
More than half of the company's revenue comes from outside the country, with 60 customers in 17 countries, including India.
Domestic and worldwide markets are spread across two-wheelers, passenger vehicles, commercial vehicles, off-highway vehicles, electric vehicles), industrial machinery, wind turbines, and railways, among other areas.
It produces a diverse range of bearing rings, that are appropriate for a wide range of end-users.
Some of the main worldwide and local names that Rolex Rings serves are SKF India, Timken India, and NRB etc.
About the IPO
The SME IPO is worth Rs.731 crore. The new issue is worth 56 crore rupees. This will be utilized to meet long-term working capital needs as well as other corporate needs. The promoters are given a sale offer for the remaining 675 crores. The issue opens on July 28, 2021, and will close on July 30, 2021. The issue is priced at 880 to 900 per equity share.
The IPO allocation is as follows:
About 50 per cent is kept for Qualified Institutional Buyers,15 per cent for non-institutional buyers, and 35 per cent for retail investors.
Objective:
The funds obtained through the IPO will be used in the following manner:
- To support the company's long-term working capital needs as for other corporate objectives.
- Rolex Rings intends to gain from the listing of its equity shares on stock exchanges
- the improvement of its brand name among existing and future customers the establishment of a public market.
- The net proceeds would be used to support the company's day-to-day operations to the tune of Rs 45 crore.
Key details
Rolex Rings IPO details
Subscription Dates: 28 – 30 July 2021
Price Band
INR880 – 900 per share
Fresh issue
INR56 crore
Offer For Sale
7,500,000 shares (INR660 – 675 crore)
Total IPO size
INR716 – 731 crore
Minimum bid (lot size)
16 shares
Face Value
INR10 per share
Retail Allocation
35%
Listing On
NSE, BSE
Strengths:
- Among the leading forging companies in India.
- Long-standing customer relationships
- Broad product portfolio
- Manufacturing capabilities giving scalability, flexibility,
- Location advantage
- Domain experts and management team
- Experienced promoters
- Strong financial performance track record
Risks:
- The company has resulted in a CDR because of debt
- Highly reliant on the performance of India's and other nations' automotive sectors.
- Impact of the COVID-19 outbreak.
- Substantial impact on operations, revenues, financial condition, cash flows.
- the government puts more focus on the electric car segment
Financials:
- For the past two years revenue falls by 16% per year. This stands at around 619.75 crores
- The company's total assets have increased during the same time span. 796.92 crore is the total asset for FY 20-21.
- Rolex Rings made a profit of Rs 86.95 crore in the previous fiscal year, up from Rs 52.94 crore the year before.
- In 2020-21, the company's operating sales were Rs 616.36 crore, up from Rs 666 crore the previous year.
- The firm has also increased its margins, which were 9.2 per cent in FY18 and 14.1 per cent in FY21.
Recommendation:
- The casting and forging industry is anticipated to increase at a rate of 13 per cent -14 per cent, up from 5 per cent -7 per cent now, thanks to the government's attempts to revive the economy.
- Infrastructure, oil and gas, mining, railroads, and defence are all projected to make significant contributions. The company's valuations appear to be appealing, with the IPO coming at a PE of 24x, compared to the industry average PE of 47x.
Conclusion
Rolex Rings, a global vehicle parts producer, is ready to launch its public offering as the comeback gathers steam.
By investing in renewable energy, the corporation hopes to lessen its reliance on changing electricity costs and lower its carbon footprint.
The company now operates wind turbines with an installed capacity of 8.75 MW. The company is in the midst of extending its solar project capacity by 12 MW and has already placed purchase orders for the necessary equipment.
The automobile industry is slowly rebounding in 2021 after a tough ride in 2020. Auto sales are being driven by a number of factors, including the relaxation of lockout restrictions and pent-up demand.
Knowledge Byte: IMPULSE RISE IN SOYBEAN PRICES
Soybean is one of the primary commodities which is traded on NCDEX. These days vast blow has been viewed in its prices as trading around its all period high. It is because of the lack of supply in the physical market and the increase in demand.
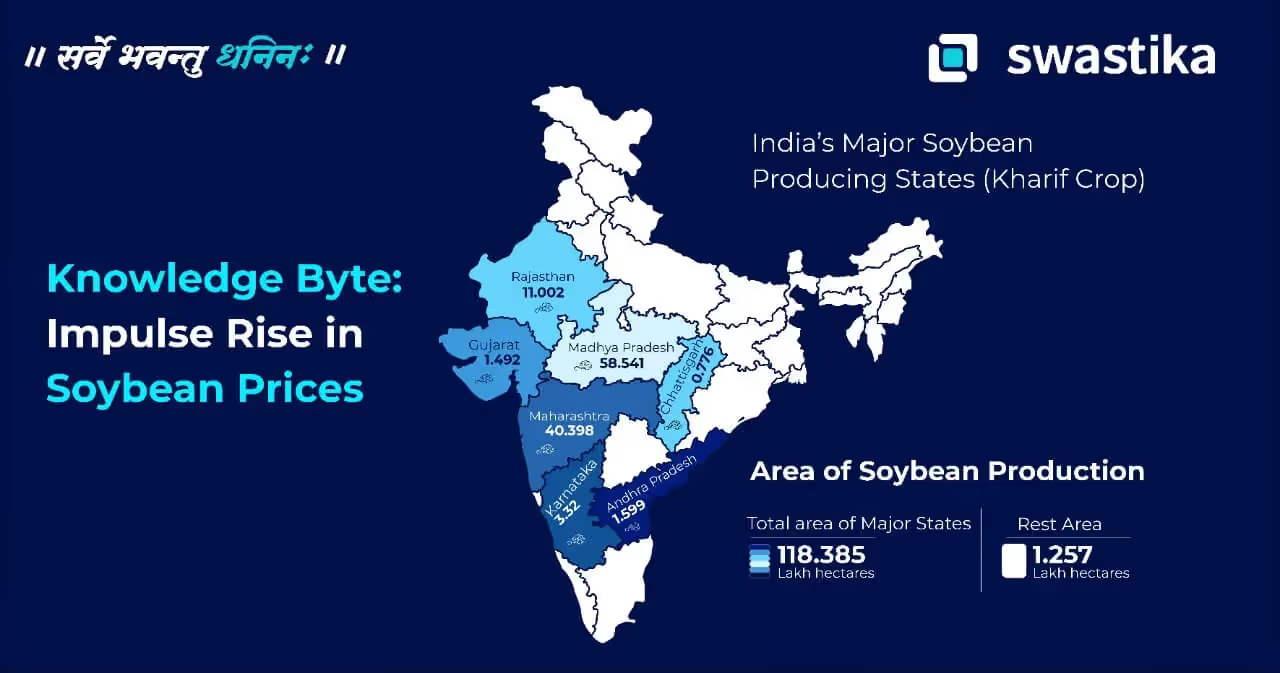
Another reason is monsoon stipulations as excess rainfall has been seen within more than a few soybean producing states like Maharashtra where the sowing has been affected badly because of delay in monsoon the sowing in Madhya Pradesh also got affected.
But looking at the contemporary situation, it is anticipated to have good sowing in Madhya Pradesh in the near term because of ongoing monsoon conditions namely as each of these states makes a contribution in accordance with around 89% in the quantity produced.
WORLDWIDE SOYBEAN PRODUCTION (ACTUAL & FORECASTED)
YearUSBrazilArgentinaChinaIndia2021-2022 119.884144521911.22020-2021112.5491374719.610.452019-202096.667128.548.818.19.32018-2019120.515119.755.315.96710.932017-2018120.065123.437.815.2838.35
As per SOPA, the worldwide soybean production has been increased over the years and the 2021-2022 forecast has also been increased compared to the last few years.
Last year the prices surged because of the buying done from China’s end as because of fear of coronavirus cases China was continuously buying it to meet its domestic demand in future but as it got sufficient supply, the correction was seen in the prices of soybean.
In addition to this, soybean was used as feed for the cattle in the cattle industry and poultry farms but now it has been substituted with wheat and rice which also led to the low import of it. Since China is the biggest importer of Soybean and Soy complex so any action from their end has direct on the prices of soybean worldwide.
India's Major Soybean Producing States
As in the past few days or last week, multiple times circuit has been seen in the prices of soybean, SOPA said that it is completely taken over by the speculators, the end-users of soybean or soybean meal like poultry industry/aquaculture are extremely suffering because of such speculation activities.
To support its claim, SOPA said, "In the last seven trading sessions, the soybean futures contract on NCDEX has gone up by 21.77% and the upper circuit had to be applied 4 times." In addition to this SOPA also said that there is no physical stock in NCDEX warehouses and the demand and supply for oil in the year 2020-2021 were slightly tight.
"To curtail speculation, we request to increase margin money from current 25% to 50% for lean season contracts and that the circuit limit in lean season should be reduced to 2% a day, "said SOPA in a release.
But recently it came into the news that the exchange denied the SOPA request, as per the NCDEX there is no speculation and prices are trading fairly as there is non-availability of the soybean in the physical market and demand is increasing rapidly. So we can say that in the near term some more upside view can be seen in the prices of soybean.

Wondering How to Make the Best Use of Your Excess Funds? Park It in Liquid ETF
Investment is something that gives you outstanding returns if done properly. If you have excessive funds lying in your bank account, save them wisely. You might have heard the above statement from every stock analyst who manages your wealth profile. This is because money is always measured in terms of time.
How to Make the Best Use of Your Excess Funds?
The time value of money states that the amount of money you have in present is worth more than that the same amount of money you will have in the future. Instead of letting your money sit idle, it would be much better if you park your surplus fund with liquid ETFs.
Liquid ETFs or Liquid Exchange Traded Funds are the mutual funds whose units are traded on the stock exchange. Unlike normal ETFs, the investment in liquid ETFs generally happens in overnight securities such as Repo or Reverse Repo securities, landing obligations and collateralized borrowings.
The primary motive of liquid ETF is to provide an income filled with low risk, at the same time gives a high liquidity level.
Investors who park their funds in liquid ETFs can earn significant returns on idle funds while at the same time remaining liquid to benefit from lucrative investment opportunities.
Liquid ETFs are only suited for large retail investors, portfolio management service (PMS) providers. Futures and Options (F&O) brokers and institutions invest directly in equities, HNI (High Net-worth Individuals).
These are several liquid ETF funds that are readily available to trade. These liquid funds can be traded immediately.
Equity market investors and traders have a habit of making continuous profits from transactions. However, sometimes they even face a loss but these are part of daily work.
The investors who have a tremendous amount of money, always find a better alternative so that they can increase their profit to a greater extent. One such alternative is liquid ETFs. Investing in ETFs enables investors to earn extra profit from excessive funds.
NSE and BSE are the funds that are available for trading where buyers and sellers quickly perform the transactions during the stock market hours on any stock trading days.
ETFs are gaining a lot of popularity these days as many investors consider liquid ETFs as the best instrument that can do wonders with their money.
However, if you are deprived of several benefits of investing in liquid ETFs or exchange-traded funds, this blog will help you out.
ETFs are Preferred Because of their High Liquidity
ETFs are not for long term investment. They are for short term investments and provide high liquidity, these are always preferred by high profile investors. Like other stocks, these funds are also listed in stock exchanges which are traded during the day. These funds are inter-linked with intraday trading and therefore the prices of the ETF heavily depend on the intraday trades.
For instance, if the intraday rates of the underlying assets change, the ETF prices also change. ETF investors are the experienced ones, and therefore they know what they have paid and what they will receive at the selling.
With liquid ETFs, investors move money from one place to another, construct strategies around their investment and manage intraday portfolios. Investing in ETFs allows investors to successfully invest in a diversified portfolio such as stocks, bonds, commodities, derivatives.
Smooth Fund Management
ETFs are passively managed funds that are specially designed to offer low-risk returns and high liquidity. Investors invest in an ETF when they sell equities from their portfolio. Many stockbrokers enable investors to reinvest 100 per cent of the proceeds into an ETF that too on the same day.
The stock market follows a settlement cycle of T+2 days, i.e. ETF units will get credited to investors’ accounts on the settlement day.
ETFs offer many benefits as in this type of scheme, individual investors hold their investment until they find a better alternative to move their funds. Another advantage of ETFs is that investors can forward the funds as a pledge against cash margins if investing in derivative segments.
Many brokerage houses accept ETFs as a cash margin if they want to trade in the derivatives segment.
Portfolio Diversification and Risk Management
Liquid exchange-traded funds offer investors better portfolio management by allowing them to invest in various sectors, industries, and country categories. They provide investors easy exposure to desired stock market segments.
ETFs are now available in the major asset classes, thus making them a good investment option. Also, investors can select to trade ETFs during stock market volatility or continue to invest based on their financial plans to earn profits.
Reduced Costs
The cost of investing in ETFs is quite less than mutual funds as the lower the costs, the higher the returns. Operational costs are an integral part of the structured investment as these costs include portfolio management fees, marketing costs, administrative expenses, distribution costs and more.
Here, lowering the costs means non-involvement of fund managers which means lower expenses of the funds. ETFs have lower expenses in transfers, monthly statements. Unlike open-ended funds, brokerages do require to send regular updates to the investors.
Tax Advantages
Mutual funds have more taxes than ETFs. This is because ETFs have a lower capital gain. The rate of capital gain tax applied to ETFs is also less as compared to mutual fund investments.
Returns
Liquid ETFs have only one dividend option. The daily earned dividends get reinvested into ETFs. Some ETF funds will credit bonus to its investors account weekly or monthly. Since the stock trading returns are low, brokerages waive off brokerage fees and depository participant changes on these funds.
Conclusion
Mutual funds and ETFs are similar investment types. However, the difference lies in the services they provide. ETFs provide higher liquidity than mutual funds and are also convenient to tap when cash flow is needed.

सोना-चांदी पर रिपोर्ट
अमेरिकी फेड की नरमी से सोना -चांदी तेज़।
सोना दो सप्ताह के उच्च स्तर के पास पहुंच गया है और 21 मई के बाद से अपने सबसे बड़े साप्ताहिक बढ़त के साथ कॉमेक्स में 1830 डॉलर प्रति औंस के स्तरों पर है। कॉमेक्स वायदा चांदी के भाव भी 26 डॉलर के करीब पहुंच गए है। अमेरिकी फेडरल रिजर्व द्वारा पिछले सप्ताह की बैठक में संकेत मिले है कि छोटी अवधि में संपत्ति की कमी शुरू करने और ब्याज दरों में वृद्धि की संभावना नहीं है।डॉलर जो सोने के विपरीत दिशा में चलता है, एक माह के निचले स्तरों पर पहुंच चुका है। पिछले सप्ताह अमेरिका से जारी होने वाले बेरोज़गारी के आंकड़े भी फेड के अनुरूप रहे जिसमे बेरोज़गारी दावों में बढ़त दर्ज की गई है। एसपीडीआर गोल्ड ट्रस्ट में पिछले एक महीने के बाद 0.6 प्रतिशत की बढ़त दर्ज की गई है। घरेलु वायदा बाजार में सोना सप्ताह मे निचले स्तरों से 1000 रुपये तेज़ हो कर 48200 प्रति दस ग्राम रुपये के स्तरों पर है। चांदी पिछले सप्ताह निचले स्तरों से 2300 रुपये तेज़ हुई है और इसके भाव 68200 रुपये प्रति किलो के करीब रहे। 10 साल की अमेरिकी बांड उपज निचले स्तरों 1.25 प्रतिशत पर ही बनी हुई है। जिससे सोने और चांदी के भाव को सपोर्ट है।
महत्वपूर्ण आंकड़े
इस सप्ताह के महत्वपूर्ण आर्थिक आंकड़े जिनमे सोमवार को अमेरिकी आइएसएम मैन्युफैक्चरिंग पीएमआई, बुधवार को एडीपी नॉन फार्म एम्प्लॉयमेंट चेंज, आइएसएम सर्विस पीएमआई, गुरुवार को ब्रिटैन की मौद्रिक नीति और शुक्रवार को अमेरिकी पैरोल के आंकड़े प्रमुख है।
तकनिकी विश्लेषण
इस सप्ताह सोने और चांदी में तेज़ी रहने सम्भावना है। सोने में 47800 रुपये पर सपोर्ट और 48500 रुपये पर प्रतिरोध है। चांदी में 66000 रुपये पर सपोर्ट और 69000 रुपये पर प्रतिरोध है।

Glenmark Life Sciences IPO Date, Price, GMP and more.
Introduction:
Glenmark Life Sciences is a wholly-owned subsidiary of Glenmark Pharmaceuticals Ltd. Incorporated in 2011 and is situated in Maharashtra, India. Glenmark Life Sciences IPO is in news these days because it is open for a subscription (Initial Public Offering) from 27th July 2021 till 30th July 2021.
About the company:
The company is responsible for manufacturing and supplying high-quality APIs for gastrointestinal disorders, cardiovascular disease, pain management, and diabetes, anti-infectives, central nervous system disease and other therapeutic areas. The revenues it has generated in India in the last two years have grown at 71.62%. While revenues generated internationally since 2019 have grown at 25.61%.The major competitors of the Glenmark Life sciences IPO within the API market contain Laurus Labs, Divis Labs, Shilpa Medicare, Aarti Drugs, and Solara Active Pharma Sciences.
What are its objectives for raising an IPO?
- Paying off outstanding purchase considerations
- For funding capital expenditures
- Geographic expansion
- Growth in API and CDMO business
Financial highlights:
- Sales that are the total revenues stands at Rs 1885.98 crore for FY21
- PAT of FY21 is Rs 351.58 crore
- Net margin dropped to 18.64% from 20%. in FY21
- The debt to equity ratio is 1.27 times.
- Return on net worth is 46.71% for 2021.
- Net cash generated from operations was for FY 21 is Rs 388.11crore, for FY20 is Rs 195.01 crore, and FY19 is Rs 10.35 crore.
- Earnings Per Share is around Rs.32.61
- The price/earnings ratio is about 21.31 – 22.08
- Net Asset Value stands at Rs.69.82 per share
Fresh equity shares up to a total of Rs 1,060 crore will be issued. Under this public issue, the issue particularly includes an offer for the sale of 63 lakh equity shares by Glenmark Pharma. In this way, a total of Rs 1,513.6 crore will be available at the upper level of the price range under the SME IPO. The company had planned to issue fresh equity for Rs. 1160 cr but then the issue size got reduced to Rs. 1060 cr. Even to the astonishment of investors, the shareholder quota was totally skipped. It then was termed as investor unfriendly move as it sent wrong signals in the primary market. The equity trading of the corporate is going to be listed on BSE and NSE. Glenmark shares are available at a premium of ₹300 within the grey market, that's from the difficulty price of ₹695 to ₹720 about 40 per cent higher. GMP is very volatile because the Glenmark shares were available within the grey market at a premium of ₹200 to ₹205. So, the share market trading is predicted to reply strongly to the public issue.
Strengths:
- Strong growth in top-line, bottom-line expansion
- Strong margins
- It has a great financial performance track record and it provides return ratios
- It holds leadership in APIs and has a strong relationship with global generic companies.
- High-quality product manufacturing.
IPO Details:
- Glenmark Life Sciences IPO details
- Subscription Dates:27 – 29 July 2021
- Price Band: INR695 – 720 per share
- Fresh issue: INR1,060 crore
- Offer For Sale: 63,00,000 shares (INR437.85 – 453.60 crore)
- Total IPO size: INR1,497.85 – 1,513.6 crore
- Minimum bid (lot size): 20 shares
- Face Value: INR2 per share
- Retail Allocation: 35%
- Listing On: NSE, BSE
Whom to Invest and How Much to Invest
The reservation was kept in the following manner half of the total issue is for qualified institutional buyers, 35 per cent is kept for retail investors, and the remaining 15 per cent is for non-institutional investors. Glenmark Life Sciences has reduced its IPO size as compared to earlier. Also, if you want to invest in it, then at least 14 to 15 thousand will have to be spent. The company has made a lot of 20 shares. A person can buy at most 13 lots. The company will pay its expenses and borrow from the money earned from this IPO.
Conclusion:
Grey market observers are attracted by Glenmark shares. API business is expected to reach USD 306 bn by the year 2027 due to the coronavirus. The second reason being we are becoming independent as of now in China so we don’t plan to export drugs from China. The issue when compared to its peers is reasonably priced in terms of price to its earnings ratio. Hence, we recommend subscribing to the IPO.
Big Budget


Popular Articles





.avif)
.avif)

.avif)



START YOUR INVESTMENT JOURNEY
Get personalized advice from our experts
- Dedicated RM Support
- Smooth and Fast Trading App
