All Blog


बैंकिंग संकट के बढ़ते दबाव से सोने की कीमतों में तेजी
.webp)

पिछले सप्ताह मौद्रिक नीति पर फेड के कम आक्रामक रहने से सोने की कीमतों में तेजी आई। ब्याज दर बढ़ोतरी की सीमित गुंजाइश की प्रत्याशा में, अमेरिका और यूरोप में हाल के बैंकिंग संकट ने कीमती धातुओं की मांग को बढ़ा दिया है, और डॉलर इंडेक्स को सात सप्ताह के निचले स्तर पर खींच लिया। फेड ने संकेत दिया कि वह आगे की आर्थिक प्रतिकूलताओं को रोकने के लिए अपनी तंग मौद्रिक नीति में नरमी पर विचार कर सकता है।
जबकि फेड ने उम्मीद के मुताबिक ब्याज दरों में बढ़ोतरी की और कहा कि यह मुद्रास्फीति को रोकने के लिए प्रतिबद्ध है, फेड की भाषा में बदलाव से बाजार को उम्मीद है की ब्याज दर बढ़ोतरी का पीक निकट है। डॉलर इंडेक्स में गिरावट रहने से सोने -चांदी के साथ अन्य कमोडिटी के भाव को भी फायदा मिल रहा है। फेड ने पिछले सप्ताह उम्मीद मुताबिक 0.25 प्रतिशत ब्याज दरें बढ़ाई है और अर्थव्यवस्था को नुकसान से बचाने के लिए लिए मौद्रिक नीति में नरमी रखने के संकेत दिए है। फेड ने अभी ब्याज दर कटौती से इंकार किया है। लगातार ब्याज दर वृद्धि होने के कारण अमेरिका के कुछ बैंक दिवालिया हो गए है और कई बैंको की वित्तीय हालत ख़राब होने से आगे ब्याज दरों में बढ़ोतरी बैंकिंग संकट को बढ़ा सकता है। वित्तीय संकट की सम्भावना के चलते निवेशकों में निवेश के लिए सुरक्षित आश्रय की मांग बढ़ी है जिससे सोने और चांदी की चमक लगातार बढ़ती दिख रही है। फेड के अतिरिक्त यूरोपियन सेंट्रल बैंक ने 0.5 प्रतिशत और बैंक ऑफ़ इंग्लैंड ने 0.25 प्रतिशत ब्याज दरों में बढ़ोतरी की है। हालांकि, पिछले सप्ताह प्रमुख बैंको की मौद्रिक नीति रहने के चलते सोने के भाव में उठा-पटक देखि गई और सप्ताह में सोना मामूली बढ़त दर्ज करते हुए 59500 रुपये प्रति दस ग्राम पर रहा, जबकि चांदी के भाव में 3 प्रतिशत की साप्ताहिक बढ़त दर्ज की गई है और इसके भाव 70400 रुपये प्रति किलो के स्तरों पर पहुंच गए है।
तकनिकी विश्लेषण:
इस सप्ताह कीमती धातुओं में तेज़ी रहने की सम्भावना है। सोने में सपोर्ट 58000 रुपये पर है और रेजिस्टेंस 60000 रुपये पर है। चांदी में सपोर्ट 68000 रुपये पर है और रेजिस्टेंस 72000 रुपये पर है।

ग्लोबल बैंकिंग संकट की आशंका से बढ़ी सेफ हैवन मांग
सोने और चांदी की कीमतों में पछले सप्ताह ग्लोबल बैंको में संकट बढ़ने के कारण, हैवन डिमांड देखि गई। एमसीएक्स में सोना पिछले सप्ताह 3.8 प्रतिशत तेज़ हो कर 58250 रुपये प्रति दस ग्राम के स्तरों पर रहा, जबकि चांदी वायदा सप्ताह में 7 प्रतिशत तेज़ हो कर 67200 रुपये प्रति किलो पर रहा। बैंकिंग संकट की आशंकाओं और मौद्रिक नीति पर अनिश्चितता ने कीमती धातुओं की सुरक्षित आश्रय अपील को बढ़ाया है। अमेरिका सिलिकॉन वैली बैंक दिवालिया होने के बाद स्विस बैंक क्रेडिट सुइस भी वित्तीय संकट का सामना कर रही है। हालांकि, क्रेडिट सुइस को मदद मिलने, और यूरोपियन सेंट्रल बैंक द्वारा ब्याज दरों में 0.5 प्रतिशत की बढ़ोतरी से कीमती धातुओं में पिछले सप्ताह के अंत मे मुनाफा वसूली रही। बैंकिंग संकट के चलते निवेशकों को उम्मीद है की फेड मौद्रिक नीति पर नरमी रखेगा। फेड के दर-वृद्धि चक्र में किसी भी रुकावट से सोने को फायदा होगा और डॉलर के मुकाबले सोने की मांग बढ़ेगी, और गैर-उपज वाली संपत्ति रखने की अवसर लागत भी कम रहेगी। बैंकिंग संकट और ब्याज दर बढ़ोतरी पर अनिश्चितता कीमती धातुओं को सपोर्ट कर रही है। हालांकि, मुद्रास्फीति स्थिर रहने के कारण फेड मौद्रिक नीति पर कठोर रह सकता है। मार्च में होने वाली फेड की बैठक पर निवेशकों की नज़रे रहेंगी जिसमे ब्याज दर बढ़ोतरी कितनी होगी, यह स्पष्ट नहीं हुआ है।
इस सप्ताह के आर्थिक आंकड़े कीमती धातुओं के लिए महत्वपूर्ण रहेंगे जिसमे फेड की बैठक, ब्रिटैन की मॉनेटरी पॉलिसी और यूरोप के मैन्युफैक्चरिंग आंकड़े शामिल है।
तकनिकी विश्लेषण:
इस सप्ताह कीमती धातुओं के भाव में अस्थिरता रहने की सम्भावना है। सोने में सपोर्ट 57000 रुपये पर है और रेजिस्टेंस 59000 रुपये पर है। चांदी में सपोर्ट 65400 रुपये पर है और रेजिस्टेंस 69000 रुपये पर है।
बुलियन, कमोडिटी, बेस मेटल्स, एग्रीकल्चरल कमोडिटीज से जुडी हुई एक्सपर्ट रेकमेंडेशन्स के लिए आज ही अपना फ्री डीमैट अकाउंट खोले

IMC Green Bond -All details here
The Indore Municipal Corporation (IMC) in Madhya Pradesh will issue green bonds as a public issue on February 10 to raise funds for building a solar power plant. This will be a first of its kind in India.
The green bond issue will open on February 10 and close on February 14. the bond is expected to list on the National Stock Exchange after February 22.
What is a Green Bond?
A green bond is a type of debt security that a company issues to finance or refinance projects that have a beneficial impact on the environment and the climate. A climate bond is another name for a green bond.
About IMC
The chief municipal corporation for the city of Indore is the Indore Municipal Corporation (IMC). The Commissioner (Nagar Aayukt) of the Issuer is Smt. Pratibha Pal, an IAS, and the Mayor are Shri Pushyamitra Bhargav. IMC is secured under the AMRUT Scheme of the Indian Government. Additionally, Indore Municipal Corporation owns 50% of Indore Smart City Development Limited (ISCDL), a Special Purpose Vehicle established under the Companies Act of 2013 to carry out Indore Municipal Corporation's Smart City Mission plan to build a smart city (SCM). ISCDL has contributed to the successful execution of a number of projects.
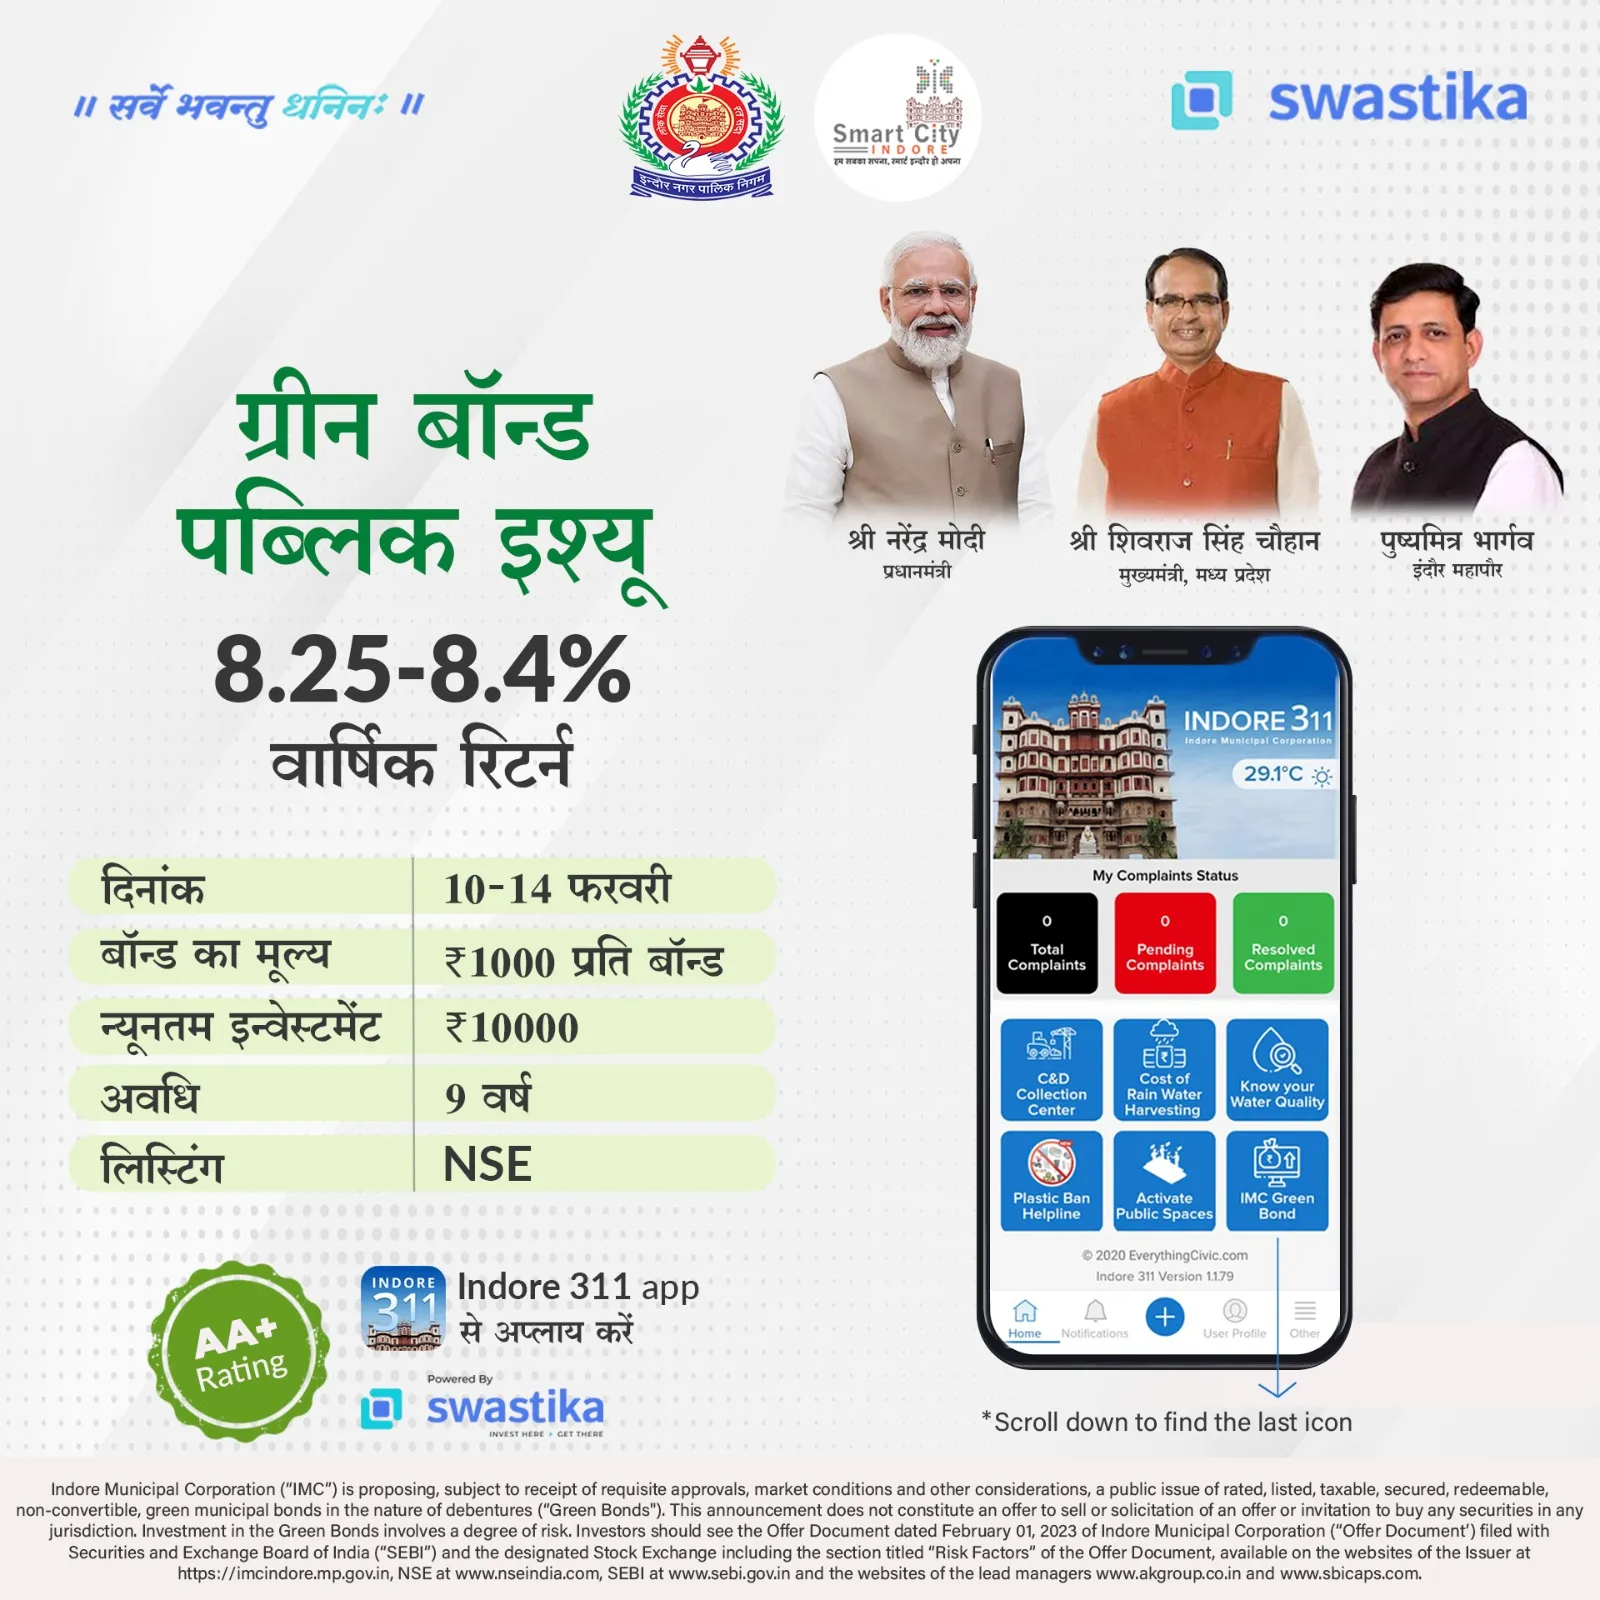
IMC Green Bond Details
According to DRHP, the corporation would issue four individually transferable and redeemable principal parts non-convertible debentures (NCDs) with a face value of Rs 1,000 each (STRPP). Each NCD of Rs 1,000 will include one STRPP A, one STRPP B, one STRPP C, and one STRPP D, each with a face value of Rs 250. The duration of STRPP A is 3 years, STRPP B is 5, STRPP C is 7, and STRPP D is 9 years.
The green bond issue would need a minimum application size of Rs 10,000 (or 10 NCDs), with subsequent applications coming in multiples of Rs 1,000.
India Ratings & Research gave the proposed green bonds an AA+ rating with a stable outlook. Care Ratings has given the issue an AA rating with a stable outlook, nonetheless.
According to the Income Tax Act of 1961, NCD holders are not entitled to any special tax benefits. If the NCD is held for less than 12 months the holder must pay short-term capital gains on interest income or for more than 12 months, the holder must pay long-term capital gains on interest income.
The book-running lead managers for the issue are AK Capital Services Limited, SBI Capital Markets Limited, and Vistra ITCL (India) Limited, while KFin Technologies is the registrar.
Objective
According to the source, the civic corporation of the nation's cleanest city hopes to raise at least Rs 245 crore through green bonds that will be utilized to build a 60 MW solar power at the villages of Samraj and Ashukhedi in the Madhya Pradesh district of Khargone and the electricity from it will be used to pump water to Indore from the Narmada river in Jalud village, which is located in the nearby Khargone district and is around 80 km distant.
The official projected that Rs 300 crore will be needed to build up the solar power facility.
A solar power plant building tender has already been announced, and once it is approved, construction will take two years, the municipality will save Rs 25 crore per month after the projected solar power facility at Jaludis constructed.
Financials of IMC Bond
The corporation's revenue income for the financial year 2021–2022 was Rs 1,739.95 crore as compared to Rs 1,508.10 crore in the same time the previous year.
While the corporation expenditure was Rs 1,107.88 crore in FY22, excluding interest and depreciation.
The total debt in 2021–22 was Rs 579.43 crore, down from Rs 648.45 crore in the same time the previous year.
Return & Ratings
The Green Bonds Issue offers an effective return of 8.42% annually and a coupon rate of 8.25% p.a. payable every six months. the NCDs are intended to be listed on both NSE and BSE. CARE Ratings Limited and India Ratings & Research Private Limited have rated the Green Bonds as "CARE AA: Stable" and "IND AA+/Stable," respectively.
To Invest in IMC green Bond Issue with the Swastika app or visit the link or apply through the Indore 311 App.

Stock Market Timings All over the World
Should the Indian Stock Market Timing be Extended to 5 PM?
The Indian stock market timing is currently set at 3:30 pm, but there is talk of extending it to 5 pm. The move is being considered for a variety of reasons. One of the primary reasons is to align India's market timings with that of other major global markets, which will enable traders to calculate all their losses at once. Another reason is to increase liquidity and trading volumes. Longer trading hours provide more opportunities to transact, which can lead to more trading volumes. Additionally, the longer time frame can also help traders manage overnight market risk more effectively, which can attract more market participants eventually.
However, it is important to note that the volume in the market is concentrated towards the first and last hour. Despite the extension of trading hours by an hour in 2010, there has been a negligible effect on volume growth in the markets. Furthermore, India has lost a chunk of its trading volume to Singapore and Dubai due to taxes and risk hedging, and not due to trading hours.
The extension of trading hours can also help in hedging the risk in domestic markets, but it may not be beneficial for active retail F&O traders in the long term. Tracking P&L for long hours can be stressful and may affect their mental health. Additionally, active traders do not make money primarily due to over-trading, and longer hours may accentuate this problem.
While the move could boost revenues for the capital markets business in the short term, it may lead to lower participation and liquidity in the long run, which will affect everyone. Therefore, it is important to consider all the factors before extending the trading hours.
Below are the Stock Market Timings All over the World
- United States: The two major US stock exchanges (NYSE and NASDAQ) are open. From Monday through Friday, 9:30 a.m. to 4:00 p.m. Eastern Time
- Canada: the Toronto Stock Exchange is open from 9:30 a.m. to 4:00 p.m., similar to Eastern Time.
- China's Shanghai Stock Exchange is open from 9:00 a.m. to 3:00 p.m. local time. For lunch, it closes between 11:30 a.m. and 1:00 p.m.
- The Hong Kong Stock Exchange is located in Hong Kong and is open from 9:00 am to 4:00 pm. It is closed from 12:00 am to 1:00 pm for lunch.
- Japan: The Tokyo Stock Exchange is open from 9:00 am to 3:00 pm local time, however, it is closed from 11:30 pm to 12:30 pm for lunch.
- India: The Bombay Stock Exchange opens from 9:15 a.m. to 3:30 p.m. local time.
- Europe: The London Stock Exchange opens in the United Kingdom from 8:00 a.m. to 4:30 p.m. local time (GMT).
- Germany: The Frankfurt Stock Exchange is open from 8:00 a.m. to 8:00 p.m.
- France: The hours of operation for Euronext Paris are 9:00 a.m. and 5:30 p.m.
- Switzerland: Local time for the Swiss Exchange is 9:00 a.m. to 5:30 p.m.
- Australia: Local time for the Australian Securities Exchange is 10:00 a.m. to 4:00 p.m.

Tech Layoffs 2023
With its high salary and stable jobs, the technology sector is frequently regarded as one of the most profitable and secure industries in the world. This illusion has been dispelled for many employees, however, by the current trend of tech layoffs. Numerous IT firms announced significant layoffs in 2023, leaving thousands of employees scrambling to find their next position. This article will describe how tech layoffs are now happening in 2023 and offer advice on how employees may deal with layoffs and look for new opportunities.
The global recession is one of the main causes of the present trend of IT layoffs. The COVID-19 pandemic has significantly slowed down the world economy, which has resulted in a decline in the demand for technological products and services. In an effort to reduce costs, several businesses that are struggling to preserve their profitability have turned to layoffs. In addition, the rapid rate of technological advancement has led to the automation of many jobs, which has rendered them redundant and left employees without work.
The impact of tech layoffs is far-reaching, affecting not just the employees who lose their jobs, but also their families and the local communities in which they live. While the employees may receive some financial support in the form of severance packages or unemployment benefits, they still face the stress of finding a new job in an uncertain job market.
What can employees do to deal with layoffs in the IT industry and discover new opportunities? Here are some suggestions:
- Stay Positive: Losing a job can be a traumatic experience, and it is important to stay positive and maintain a healthy outlook. Focus on the skills and experience you have gained and look for new opportunities to utilize them.
- Network: Your network is your biggest asset when looking for a new job. Reach out to your friends, family, and former colleagues for support and let them know that you are looking for work. Attend industry events and join professional organizations to expand your network and make new connections.
- Update your resume: Your resume is your personal marketing tool, and it is important to keep it up-to-date. Highlight your skills, experience, and accomplishments, and tailor your resume to the job you are applying for.
- Explore new opportunities: The current job market may not be as favorable as it once was, but there are still many opportunities available. Consider exploring new industries or roles that you may not have considered before. You may be surprised at what you find.
- Stay current: The technology industry is constantly evolving, and it is important to stay current with the latest developments. Attend training and educational programs, read industry publications, and stay updated on the latest technologies.
Conclusion
IT layoffs are a reality in today's market, and they can be challenging to manage. You may improve your chances of landing a new job by staying positive, networking, updating your resume, exploring new opportunities, and staying current. Just keep in mind that your talents and experience will help you thrive in your future position and that your layoff is not an indication of your ability level.

Challenges in Hiring
Any organization must prioritize recruitment since it affects both the talent pool and the business's ability to develop. But finding the proper candidates is frequently difficult for the HR department. Let's examine some of these difficulties and how to get beyond them.
Finding Candidates with the Right Skills -
The search for people with the necessary skills and qualifications is one of HR's biggest challenges. To find the best applicants, HR might use pre-employment evaluations and competency testing. Additionally, they can work with educational institutions to find suitable applicants and offer training courses to help current employees improve their abilities.
Ghosting-
which occurs when an applicant abruptly ceases responding to communications from a potential employer, is a regular problem that HR must deal with. This delays the hiring process because HR must locate a substitute. Finding and hiring a new employee can be expensive, especially if the hiring process is starting from scratch. Ghosting can lead to the loss of potentially excellent applicants who might have been a good fit for the business.
Time and Cost -
The recruitment process can be time-consuming and expensive.
Solution: Automation of the recruitment process can reduce the time and cost involved. By using online job portals, resume databases, and applicant tracking systems, HR can streamline the recruitment process.
Retaining Top Talent -
Once the right candidates are recruited, retaining them is another challenge faced by HR. To retain top talent, HR can offer competitive salary packages, flexible work arrangements, and opportunities for professional growth.
Diversity and Inclusion -
Another challenge faced by HR is ensuring diversity and inclusion in the recruitment process. HR can implement diversity and inclusion policies and conduct bias training for all employees involved in the recruitment process. They can also use blind resume screening to eliminate unconscious bias. In conclusion, recruitment is a challenging process for HR departments, but with the right solutions, it can be made smoother and more effective. Automation, collaboration with educational institutions, implementing diversity and inclusion policies, and offering attractive employment packages can help HR overcome the challenges of recruitment and bring in top talent.

Yield Curve- And the Repercussions of its Inversion
Economists deal with ups and downs in graphs for a living, but when the Yield Curve gets toppled on its head, it causes all the mayhem. Its inversion is the stuff of nightmares for economists and this aversion towards its inversion isn’t without a reason. If we turn our clocks and look back to the past, we can see the flip of the curve has preceded every single recession, notably in the US, for the past half-century or so.
But before we dive deeper into why it is such a big deal for policymakers and investors alike, and how it helps them predict the state of the economy, first let's wrap our heads around what a yield curve is.
First and foremost, the yields in the discussion here are yields from Bonds, more specifically the highest rated Bonds of any country, like the treasury bills in the US or Government bonds in India.
All these bonds offer a fixed coupon payment (Interest) to the holder. However, Yield and Coupon rates are entirely different. While Coupon Rate is applied on the face value of the bonds, Yield is the rate of return an investor gets on the price he paid for such bonds.
For Instance,
Face Value of a Bond- Rs. 1000/ -
Interest Rate- 6% p.a.
Current Market Price- Rs 1200/ -
Yield=Interest/Current Market Price
Yield= 60 /1200=5%
Thus, if the market price decreases, the yield increases, and vice versa, establishing an inverse relationship between the market price of a bond and its yield. For those who stick with the bond till its maturity, this yield won't matter much, but for people who buy and sell bonds at market prices, Yield is a quintessential parameter in deciding whether the bond is worth investing in or not.
Now that we have gone over what Yield means, let’s figure out what yield curve is. When the maturity period of different bonds (say from 3 months to 10 years) are plotted on X- Axis and their corresponding yields are plotted on the Y-axis, we get a ‘yield curve’.
Here is the yield curve of Indian Government bonds, from Overnight Bonds to Bonds with 40- Year Bonds.
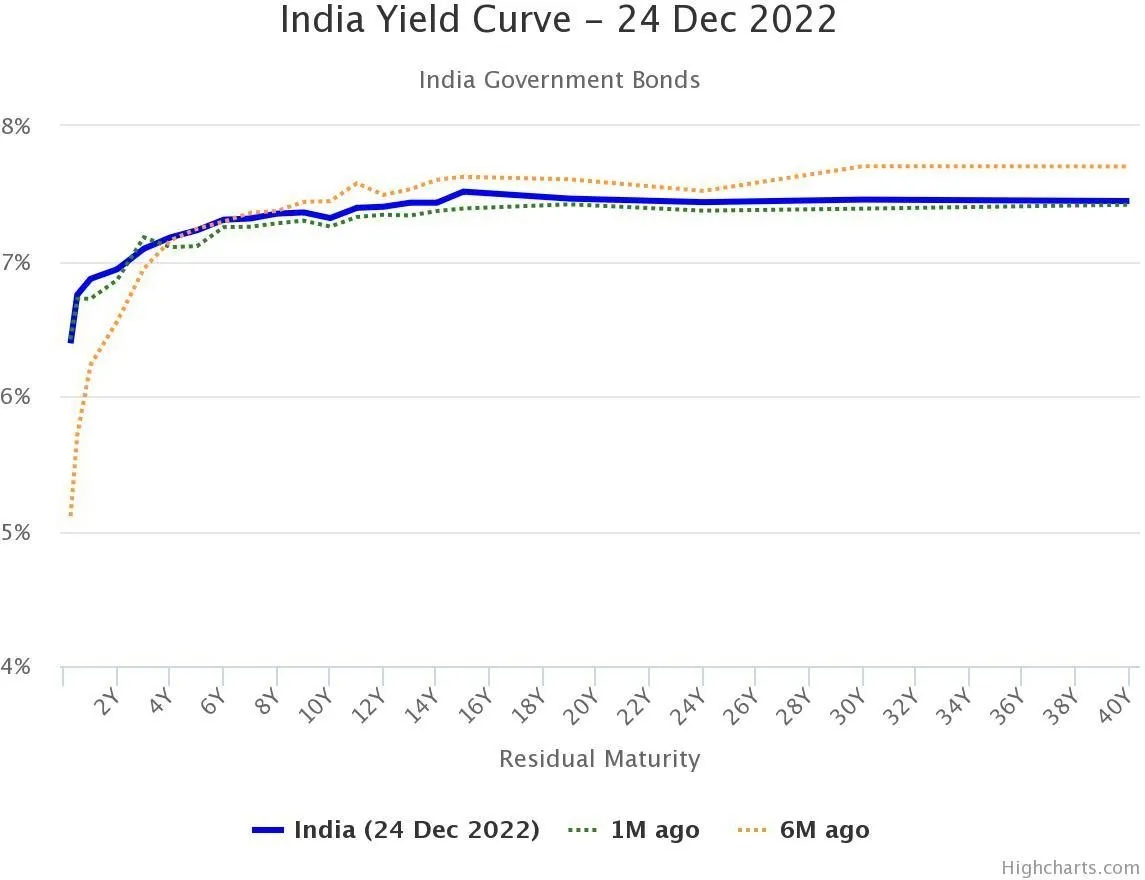
The rationale behind this is called 'Liquidity Premium Theory'. Investors who are investing their money for longer periods will obviously demand higher coupon payments and at the same time, are willing to pay a lower price.
These two factors result in a higher yield for long-term bonds, thus giving the yield curve is rising slope.
But when this curve gets inverted, it can get all tipsy-turvy. The inversion is caused when Long Term Yield is lower than the Short term Yield.
This happens when Investors start investing in long-term Bonds resulting in an increase in their prices, which consequents in a decrease in the long-term yield.
This isn’t a good situation for an Economy to be in, because a preference toward long-term bonds indicates that investors don’t have strong confidence in the economy’s short-term prospects and want to secure their long-term payments, at the cost of earning better returns.
And, this preference toward bonds over equity results in a decline in equity investments. As a consequence, economic activities plummet, which ultimately worsens the blow to the economy, as it spirals down toward a gloomy spell of recession.
Make no mistake, the inversion of the yield curve is not the cause of a recession, but it's merely a predictor of it and a very good one at that. Economists all over the globe have long ago recognized it as one of the crucial indicators of economic health, and now that you have apprehended why it is so highly regarded, keep an eye out for the next inversion. It might be closer than you think…Until next time.

कठोर मौद्रिक नीति की सम्भावना से टूटे सोना-चांदी
प्रमुख केंद्रीय बैंको द्वारा कठोर मौद्रिक नीति को लगातार बनाये रखने की सम्भावना के चलते कीमती धातुओं में पिछले सप्ताह बिकवाली का दबाव रहा। पिछले तीन सप्ताह में सोना अपने उच्चतम स्तर से 3000 रुपए प्रति दस ग्राम और चांदी हाल के उच्च स्तरों से 8000 रुपए प्रति किलो तक सस्ती हो चुकी है। अमेरिका से जारी मुद्रास्फीति के आंकड़ों में कीमती धातुओं के भाव के लिए मिश्रित रुझान रहा जिसने अर्थव्यवस्था और मौद्रिक नीति के मार्ग पर कुछ अनिश्चितता पैदा कर दी है, साथ ही अमेरिकी डॉलर इंडेक्स में भी बढ़त देखने को मिली है। जनवरी माह के लिए अमेरिका के वार्षिक मुद्रास्फीति के आंकड़े पिछले माह की तुलना में कम रहे जबकि मासिक मुद्रास्फीति में बढ़ोतरी दर्ज की गई है। भारत के थोक और खुदरा मुद्रास्फीति के आकड़ो में भी साल-दर-साल बढ़ोतरी दर्ज की गई है। मुद्रास्फीति के आकड़ो के बाद निवेशक प्रतीक्षा में है कि फेडरल रिजर्व डेटा पर कैसे प्रतिक्रिया करेगा, यह ध्यान रखते हुए कि फेड ने मुद्रास्फीति के खिलाफ बड़े पैमाने पर बयानबाजी की है। मुद्रास्फीति एक स्तर पर स्थिर बनी हुई है जिससे फेड के निकट भविष्य के लिए ब्याज दरों में वृद्धि जारी रहने की संभावना है। लेकिन, ब्याज दरों में आगे भी बढ़ोतरी इनवर्टेड यील्ड कर्व के अंतर को बढ़ा सकता है जो आर्थिक मंदी की और संकेत पहले से दे रहा है, जिससे कीमती धातुओं में गिरावट सीमित रह सकती है। पिछले सप्ताह अमेरिकी पीपीआई और बेरोजगारी दावों के आंकड़े उम्मीद से बेहतर आने से कीमती धातुओं पर बिकवाली का दबाव बढ़ता दिखा। हालांकि, फिली फेड मैन्युफैक्चरिंग इंडेक्स कमजोर बना रहा, जो अमेरिका में धीमी विनिर्माण गतिविधि का संकेत देता है, जिसने बुलियन की कीमतों को निचले स्तर पर समर्थन दिया। निकट भविष्य में कीमती धातुओं में गिरावट का रुझान रह सकता है क्योंकि निवेशक आगे कठोर मौद्रिक नीति की उम्मीद कर रहे हैं।इस सप्ताह फेड बैठक के मिनट्स और अमेरिका की जीडीपी के आंकड़े कीमती धातुओं के लिए महत्वपूर्ण रहेंगे।
तकनिकी विश्लेषण:
इस सप्ताह कीमती धातुओं में बिकवाली का दबाव बने रहने की सम्भावना है। सोने में सपोर्ट 55400 रुपये पर है और रेजिस्टेंस 56700 रुपये पर है। चांदी में सपोर्ट 63000 रुपये पर है और रेजिस्टेंस 66500 रुपये पर है।

Understanding the Various Types of Financial Markets
1. Introduction
Financial markets are where people buy and sell different types of assets, like stocks and bonds. These markets are essential because they help determine how much things are worth, make it easier to buy and sell assets, and provide opportunities for people to invest and grow their money.
2. Capital Markets
Definition: Capital markets are places where you can trade long-term investments, like stocks and bonds. They help companies and governments raise money for long-term projects or operations.
Types:
- Stock Markets: This is where you buy and sell shares of companies. Each share represents a small ownership stake in the company. In India, major stock markets include the Bombay Stock Exchange (BSE) and the National Stock Exchange (NSE).
Example: If you buy shares of Tata Consultancy Services (TCS) on the NSE, you are participating in the stock market. Your money helps TCS grow, and you may benefit if the company does well. - Bond Markets: Here, you can buy and sell bonds, which are like loans given to companies or governments. When you buy a bond, you are lending money to the issuer in exchange for regular interest payments and the return of the loan amount at maturity.
Example: Investing in Indian government bonds is an example of participating in the bond market. These bonds are considered safe because they are backed by the government.
3. Money Markets
Definition: Money markets are for short-term borrowing and lending. These transactions usually last less than a year. They help manage day-to-day cash needs and provide a place to invest surplus cash safely.
Types:
- Treasury Bills (T-Bills): These are short-term government securities with maturities of up to one year. They are low-risk investments.
Example: If you invest in a 90-day T-Bill issued by the Reserve Bank of India (RBI), you're lending money to the government for 90 days and getting a small return in interest. - Commercial Paper: This is short-term, unsecured debt issued by companies to raise money quickly. It’s usually used for short-term needs.
Example: A company might issue commercial paper to cover its immediate expenses, like paying suppliers. - Certificates of Deposit (CDs): These are savings accounts with a fixed term and interest rate, offered by banks.
Example: Depositing money in a 6-month CD at a bank means you’ll earn interest over six months before you can withdraw your money.
4. Derivatives Markets
Definition: Derivatives markets involve trading contracts whose value depends on the value of other assets, such as stocks or commodities. These contracts are used to manage risk or speculate on future price movements.
Types:
- Futures Contracts: These are agreements to buy or sell an asset at a set price on a specific future date. They help businesses and investors manage price risks.
Example: If you agree to buy Nifty futures, you’re committing to buy the Nifty 50 index at a set price on a future date. - Options Contracts: These give you the right, but not the obligation, to buy or sell an asset at a specified price before a certain date.
Example: If you buy an option to purchase shares of Infosys at ₹1,500, you can choose to buy Infosys shares at this price before the option expires.
5. Forex Markets
Definition: Forex (foreign exchange) markets involve buying and selling currencies. This market is the largest in the world and operates 24 hours a day.
Types:
- Spot Market: Currencies are bought and sold for immediate delivery.
Example: If you exchange Indian rupees for US dollars at the current rate, you’re participating in the spot market. - Forward Market: Currencies are traded for delivery at a future date based on a predetermined rate.
Example: If a company plans to buy US dollars in three months, it might enter into a forward contract to lock in the current exchange rate.
6. Commodities Markets
Definition: Commodities markets involve trading raw materials or primary products. These markets help in setting prices and managing risks related to physical goods.
Types:
- Agricultural Commodities: Includes products like grains, coffee, and cotton.
Example: Trading futures contracts for wheat helps farmers and traders lock in prices and manage risks related to crop production. - Energy Commodities: Includes oil and natural gas.
Example: Trading crude oil futures on the Multi Commodity Exchange (MCX) allows companies to hedge against future price changes in oil. - Metals: Includes precious metals like gold and silver, as well as industrial metals like copper.
Example: Buying gold futures can be a way to invest in gold or hedge against inflation.
Conclusion
Each financial market serves a unique purpose and caters to different investment needs. Understanding these markets helps you make better investment decisions and manage risks effectively. Whether you’re interested in stocks, bonds, currencies, or commodities, knowing how each market works can help you navigate the financial world more confidently.

ट्रेज़री यील्ड में बढ़ोतरी से दबाव में कीमती धातुए
एमसीएक्स सोने और चांदी के भाव में ऊपरी स्तरों पर दबाव रहा। चांदी की कीमतों में पिछले सप्ताह 1 प्रतिशत से अधिक की गिरावट दर्ज की गई है जबकि सोने में मामूली बढ़त दर्ज की गई है। मुद्रास्फीति अभी बड़ी हुई है और इसको कम करने के लिए फेड के सदस्यों द्वारा आगे भी ब्याज दर वृद्धि होते रहने का अनुमान जताया है। फेड चेयर पॉवेल ने, 2022 में लगातार हुई ब्याज दर वृद्धि तक अमेरिका में अवस्फीति की परिस्थिति को बताया, और आगे भी ब्याज दर वृद्धि करने का समर्थन किया है। अमेरिका से जारी होने वाले रोज़गार बाजार के आकड़ो का बेहतर प्रदर्शन, लगातार ब्याज दर बढ़ोतरी की सम्भावना के अनुकूल है। जिससे सोने और चांदी की कीमतों में दो हफ्तों से दबाव बना हुआ है। कीमती धातुओं में दिवाली के बाद से शुरू हुई तेज़ी, लगातार ब्याज दर वृद्धि के लिए जगह होने से, थमने लगी है। हालांकि, ब्याज दर बृद्धि के कारण आर्थिक मंदी का डर अभी बना हुआ है। छोटी अवधि की अमेरिकी ट्रेज़री यील्ड, लम्बी अवधि की यील्ड से अधिक हो चुकी है जो अर्थव्यवस्था के लिए खतरे के संकेत दे रही है। छोटी अवधि की ट्रेज़री यील्ड में बढ़ोतरी होने से कीमती धातुओं में ऊपरी स्तरों पर दबाव बना हुआ है। बांड यील्ड में बढ़ोतरी होने से अमेरिकी डॉलर इंडेक्स में सुधार हुआ है। वर्ल्ड गोल्ड कॉउंसिल के मुताबिक पिछले साल प्रमुख केंद्रीय बैंको द्वारा सोने की खरीद अब तक के उच्च स्तरों पर है। यूरोपीय बैंकों ने सोने की बिक्री बंद कर दी और रूस, तुर्की और भारत जैसी उभरती हुई अर्थव्यवस्थाओं ने खरीदारी की है। केंद्रीय बैंको का रुझान सोने की खरीद पर बढ़ा है क्योंकि अशांत समय में यह अपना मूल्य बनाए रखता है, और मुद्राओं और बांड के विपरीत, यह किसी भी जारीकर्ता या सरकार पर निर्भर नहीं है।
इस सप्ताह अमेरिका से, मंगलवार को मुद्रास्फीति (सीपीआई), बुधवार को रिटेल सेल्स और गुरुवार को पीपीआई के आंकड़े कीमती धातुओं के भाव के लिए महत्वपूर्ण रहेंगे।
तकनिकी विश्लेषण
इस सप्ताह कीमती धातुओं में दबाव बने रहने की सम्भावना है। सोने में सपोर्ट 56000 रुपये पर है और रेजिस्टेंस 57400 रुपये पर है। चांदी में सपोर्ट 65000 रुपये पर है और रेजिस्टेंस 69000 रुपये पर है।
.webp)
सेफ हेवेन मांग से मजबूत सोना-चांदी
भारतीय यूनियन बजट में चांदी और चांदी डोर पर इम्पोर्ट ड्यूटी बढ़ा दी गई है। चांदी पर इम्पोर्ट ड्यूटी, सोने की इम्पोर्ट ड्यूटी के बराबर करने के लिए की गई है, जिससे कीमती धातुओं में इम्पोर्ट ड्यूटी का स्ट्रक्चर सामान रहे। हालांकि, उपकर में बदलाव करके, सोने में इम्पोर्ट ड्यूटी यथावत रखी गई है। इम्पोर्ट ड्यूटी बढ़ाने के बाद, सोने और चांदी में बढ़ोतरी देखि गई। चांदी में कुल इम्पोर्ट ड्यूटी बढ़ा कर 15 प्रतिशत कर दी गई है, जो सोने की ड्यूटी के बराबर है। कीमती धातुओं से बनी ज्वेलरी पर ड्यूटी 22 प्रतिशत से बढ़ा कर 25 प्रतिशत कर दी गई है। हालांकि, अमेरिकी फेड की बैठक के बाद कीमती धातुओं में हेवेन मांग देखि गई। फेड द्वारा अपेक्षाकृत कम, 25 आधार अंको की बढ़ोतरी की गई जिससे सोने की कीमते एमसीएक्स में 58800 प्रति दस ग्राम और चांदी 72700 रुपए प्रति किलो के स्तरों को छू गई। हालांकि, ब्याज दरों के चरम स्तर को फेड ने अनिश्चित बताया है जिससे सप्ताह के अंत में डॉलर इंडेक्स में बढ़त रही और कीमती धातुओं में मुनाफा वसूली हावी हुई। हालांकि, अमेरिकी अर्थव्यवस्था की धीमी विकास दर, फेड को इस साल के मध्य तक ब्याज दरों में बढ़ोतरी रोकने और इसको घटाने के लिए बाधित कर सकता है। यूरोपियन सेंट्रल बैंक और बैंक ऑफ़ इंग्लैंड द्वारा ब्याज दरों में बढ़ोतरी से भी अमेरिकी डॉलर में दबाव बना हुआ है, जो कीमती धातुओं को सपोर्ट कर रहा है। केंद्रीय बैंको की लगातार ब्याज दर बढ़ोतरी से वैश्विक अर्थव्यवस्था दबाव में है, जिससे सोने में सेफ हेवेन मांग बढ़ी है।
इस सप्ताह फेड चेयर जेरोम पॉवेल और एफओएमसी मेंबर विलियम की स्पीच कीमती धातुओं के लिए महत्वपूर्ण रहेगी।
तकनिकी विश्लेषण
इस सप्ताह कीमती धातुओं में तेज़ी रहने की सम्भावना है। सोने में सपोर्ट 57500 रुपये पर है और रेजिस्टेंस 59000 रुपये पर है। चांदी में सपोर्ट 68000 रुपये पर है और रेजिस्टेंस 73000 रुपये पर है।

The Hindenburg vs. Adani Clash: Everything You Need to Know
The Adani Group, one of India’s biggest companies, recently launched the country's largest Follow-on Public Offering (FPO) to raise ₹20,000 crores from investors. However, the response has been surprisingly low, with only 1% of the shares being subscribed and just 2% of the retail portion taken up. This poor response is mainly due to a report released by Hindenburg Research just before the FPO, which has caused a lot of controversy.
What Did Hindenburg Say?
Hindenburg Research, known for investigating companies they believe are overvalued or involved in wrongdoing, published a 106-page report making serious allegations against the Adani Group. Here are the key points:
- Pledged Shares: Hindenburg raised concerns that a large portion of Adani Group shares has been used as collateral for loans. This is risky because if the share prices fall, the lenders might sell these shares, causing prices to drop even more.
- Tax Evasion and Financial Tricks: Despite being one of India’s richest people, Gautam Adani is reportedly only the 10th highest taxpayer. Hindenburg accused the Adani Group of avoiding taxes through activities like diamond trading, over-invoicing, and other financial schemes.
- Offshore Payments: The report highlighted a ₹780 crore payment made by Adani Enterprises to an offshore company in Australia. Hindenburg suggested this payment might not have been transparent because the offshore company was allegedly owned by the Adani Group itself.
- Market Manipulatioeased their holdings, which raised suspicions of manipulation.
- Complicated Corpon: Hindenburg claimed that in 2019, Adani Green, part of the Adani Group, used a broker involved in market rigging for its share sale. After the sale, some foreign investors incrrate Structure: Hindenburg criticized the Adani Group’s complex structure, with 578 subsidiaries and over 6,000 related-party transactions in one year. This complexity makes it hard to track financial activities, raising concerns about transparency.
- Questionable Shareholdings: Hindenburg questioned the large number of Adani Group shares held by offshore funds, suggesting these funds might be controlled by the Adani Group to manipulate stock prices.
- Silencing Journalists: Another serious accusation was that the Adani Group has used its influence to silence journalists who report critically on the company, with some even being jailed.
Hindenburg’s Key Points
Hindenburg’s report wasn’t just about new accusations; it also pointed out existing issues:
- Overvalued Stocks: Hindenburg claimed that the seven key listed companies of the Adani Group are overvalued by as much as 85%, even without considering the new allegations.
- High Debt Levels: The Adani Group has taken on a lot of debt, much of it backed by shares that Hindenburg claims are inflated. This puts the group in a risky financial position.
Financial Health of Adani Group
Despite these allegations, the Adani Group has shown some positive financial trends:
- Lower Debt: The group has managed to reduce its debt-to-EBITDA ratio, meaning its debt is now smaller compared to its earnings.
- Earnings Growth: The group’s earnings have been growing at a healthy rate of 22% per year.
- Continued Borrowing: However, the group’s debt has also been growing, showing it still relies heavily on borrowing.
Adani Group’s Response
In response to the Hindenburg report, the Adani Group issued a 413-page rebuttal, strongly denying all allegations and defending its practices:
- Transparency and Compliance: The group argued that most of the issues raised by Hindenburg were already disclosed in their financial reports.
- Legal Standards: Adani stated that it follows the highest standards of governance and accused Hindenburg of not understanding Indian laws.
- Market Manipulation Claims: The group suggested that Hindenburg’s report was a deliberate attempt to manipulate the market for financial gain, as Hindenburg stands to profit from a decline in Adani’s stock prices.
Impact on Adani Group Stocks
The Hindenburg report has significantly impacted the Adani Group’s stock prices:
- Massive Losses: The group has lost over $48 billion in market value since the report was published, causing a sharp decline in investor confidence.
- Stock Performance:some text
- Adani Enterprises: -1.50%
- Adani Green: -3.08%
- Adani Ports: -6.59%
- Adani Transmission: -8.85%
These sharp declines have also affected the broader Indian stock market, with Adani Group stocks dragging down the indices.
Conclusion
The clash between Hindenburg and the Adani Group has created significant turmoil in the Indian stock market and raised serious questions about the Adani Group’s business practices. While the Adani Group has strongly denied the allegations, the controversy has led to a massive drop in stock prices and a loss of investor confidence. The long-term impact on the Adani Group remains to be seen as the situation continues to unfold.

भारतीय बजट और फेड बैठक से मिलेगी कीमती धातुओं को नई दिशा
कॉमेक्स में सोने की कीमते 9 महीने की उचाई 1941 डॉलर प्रति औंस, की उचाई पर चल रही है जबकि एमसीएक्स में सोना उच्चतम स्तरों पर चल रहा है। हालांकि, चांदी की कीमतों में, औद्योगिक मांग में कमी के रहते दबाव देखने को मिल रहा है। साल 2023 में आर्थिक मंदी का डर अभी बना हुआ है और कीमती धातुओं में निवेशकों को आगे के नज़रिये के लिए अमेरिका के प्रमुख आकड़ो का इंतजार है। पिछले सप्ताह चीन में लूनर न्यू ईयर हॉलिडे के चलते वैश्विक बाज़ारो में कारोबार कम रहा। बेंचमार्क अमेरिकी ट्रेज़री यील्ड में दबाव बना हुआ है जिसके कारण अमेरिकी डॉलर, जो सोने के विपरीत दिशा में चलता है, में दबाव बना हुआ है और पिछले सप्ताह यह 101 के स्तरों को छु चूका है। अमेरिकी फेड द्वारा ब्याज़ दर वृद्धि पर नरमी दिखाई गई है जबकि यूरोपियन सेंट्रल बैंक अगली दो बैठकों में 0.50 प्रतिशत वृद्धि करने का अनुमान है। हाल के सप्ताहों में, कीमती धातुओं के भाव में हैवन मांग और फेडरल रिजर्व द्वारा आने वाले महीनों में ब्याज दरों में वृद्धि की गति को धीमा करने की बढ़ती उम्मीदों से, कीमती धातुओं में तेजी आई है। निवेशकों की इन उम्मीदों से डॉलर और अमेरिकी ट्रेज़री यील्ड में गिरावट आई है और कीमती धातुओं को इससे फायदा हुआ है। हालांकि, फेड द्वारा ब्याज दर वृद्धि को धीमा किया गया है, लेकिन इसके उच्चतम स्तर के बारे में कोई संकेत नहीं है और मुद्रास्फीति अभी भी 40 साल की उचाई के करीब बनी हुई है। अमेरिकी डेब्ट सीलिंग लिमिट की चिंता भी निवेशकों को कीमती धातुओं की और आकर्षित कर रही है।
इस सप्ताह अमेरिकी पैरोल के आंकड़े, एफओएमसी और यूरोपियन सेंट्रल बैंक की बैठक, और भारतीय आम बजट कीमती धातुओं के लिए महत्वपूर्ण है, जिससे इनके भाव को नई दिशा मिल सकती है।
तकनिकी विश्लेषण
इस सप्ताह कीमती धातुओं के भाव में महत्वपूर्ण इवेंट्स के चलते अस्थिरता रहने की सम्भावना है। सोने में सपोर्ट 56000 रुपये पर है और रेजिस्टेंस 58000 रुपये पर है। चांदी में सपोर्ट 66500 रुपये पर है और रेजिस्टेंस 70500 रुपये पर है।

Important Pointers of Economic Survey 2023-24
A day before the Union Budget, which will be unveiled by Finance Minister Nirmala Sitharaman on Wednesday, February 1, 2023, the Economic Survey for 2023–24 was introduced in Parliament on Tuesday, January 31, 2023. The Economic Survey, which is issued every year a day before the budget and analyses the performance of every area of the economy before making recommendations for the future, is a report card on the state of the economy.
Key Highlights
- India's economy will expand by 6.5% in 2023–2024 compared to this fiscal's 7% growth and 2021–2022's 8.7% expansion. In the upcoming fiscal year, nominal GDP (gross domestic product) is expected to reach 11%.
- Private consumption, more capital expenditures, a better corporate balance sheet, increased financing to small enterprises, and the return of migrant workers to cities all contributed to growth.
- Depending on global economic and political developments, real GDP growth is expected to be between 6 and 8.0% in the upcoming fiscal year.
- The probability of additional interest rate increases by the US Fed presents a challenge to the rupee's decline.
- As long as global commodity prices stay high and the pace of economic expansion is maintained, the current account deficit (CAD) may continue to increase. The rupee may see devaluation pressure if CAD widens much more.
According to the most recent Reserve Bank of India (RBI) figures, the nation's current account deficit increased to 4.4% of GDP in the quarter ending in September from 2.2% of GDP during the April-June period as a result of a larger trade imbalance.
- India has enough foreign exchange reserves to cover CAD and participate in the Forex Trading market to control currency volatility.
- The second half of the current fiscal year has seen a slowing in export growth after the first half of the year and the increase in growth rates in 2021–22 caused production processes to move from "mild acceleration" to "cruise mode."
- The loss of export stimulus in the second part of this year was caused by the slowing global economy and declining worldwide commerce.
- On the strength of low inflation and moderate lending costs, bank credit growth is anticipated to be robust in FY24.
- Over 30.5% more credit was extended to small firms between January and November of 2022.
- In the current fiscal year's April to November, central government capital expenditures increased by 63.4%.
- The stock market generated gains in 2022 despite the removal of FPI.
- In the current fiscal year, private consumption and capital formation have driven economic growth and helped create jobs; urban employment rates have decreased while Employee Provident Fund registration has increased.
- The survey suggested that "entrenched inflation" could prolong the tightening cycle, causing borrowing costs to remain higher for longer.

The K-Shaped Economic Recovery Explained
K-Shaped Recovery
A K-shaped recovery happens when various sectors, industries, or groups of people in the economy recover at various speeds, periods, or amounts. In this type of recovery, certain industries flourish while others stagnate or even dip more. K-shaped recoveries are typically brought on by pre-existing discrepancies or by a recession that has distinct effects on different populations and groups.
The image below is an example of a K-shaped recovery wherein certain industries or sectors perform well and grow while others go into decline and continue to stagnate.

(IMG Credits: Drishti IAS)
A K-shaped recovery could be caused by a variety of distinct economic events. First, a K-shaped recovery can represent the creative destruction that takes place in an economy during a recession when new technology and industries displace older ones. Second, it may show how the government has responded to a downturn in terms of fiscal and monetary policy, which might favor particular parts of the economy more than others.
Alternately, it may merely reflect the disparate effects that the initial recession had on the various sectors of the economy, particularly when the recession occurs concurrently with or is brought on by adverse real economic shocks that target particular sectors of the economy and may have longer-lasting effects on those sectors than on others. Keep in mind that these three requirements might not be exclusive of one another; they might all be at work in a particular K-shaped recovery together with additional elements.
It is hard to say for sure if India is experiencing a K-shaped recovery. However, certain indicators which indicate a K-shaped recovery in India are:
- Two-wheelers are a symbol of India's small businesses as well as the economic position of the lower and middle classes. According to a survey by the analytical firm CRISIL, two-wheeler sales are predicted to fall between 3% and 6% in 2021. This is on top of a lower base that was already impacted by the pandemic in 2020. The actual decrease in two-wheeler sales from before the pandemic must be significantly greater as a result of the base effect. Two-wheeler sales are at their second-lowest level in seven years. It is crucial to remember that among two-wheelers, entry-level vehicles are the ones most adversely impacted. The festival season was supposed to address this issue, but it failed to do so. On the other hand, premium cars and premium motorcycles have been resistant to the pandemic slowdown.
- Over 5 lakh people lost jobs after the lockdown started. Post this, there was a need for an increase in NREGA expenditure to accommodate more people for jobs. However, in the year 2021-2022, the Government of India cut its budget allocation towards MGNREGA by 34%. Thus, the unemployment rate didn’t ease off to pre-COVID levels even after the lockdown was lifted.
A deeper dive into the data of disposable income of the lower, middle, and upper class will show a similar trend which is the reason for the K-shaped recovery.

बेहतर रोज़गार के आकड़ो से कीमती धातुओं में सुधार
सोने की कीमते पिछले सप्ताह कॉमेक्स वायदा बाजार में सात महीने के उच्च स्तरों को छू चुकी है जबकि एमसीएक्स में कीमते 56000 रूपये प्रति दस ग्राम के स्तरों को छू चुकी है। हालांकि, अमेरिका से जारी एडीपी नॉन फार्म एम्प्लॉयमेंट चेंज, बेरोज़गारी के दावे और पैरोल के आकड़ो का बेहतर प्रदर्शन से कीमती धातुओं में उच्च स्तरों पर मुनाफ़ा वसूली रही। फेड मीटिंग के मिनट्स के अनुसार छोटी ब्याज दरों में बढ़ोतरी की संभावना ने डॉलर इंडेक्स पर दबाव बनाया है, जिससे 2022 में एक बुल रन के बाद ग्रीनबैक उच्चतम स्तरों से पलट गया है, और आने वाले महीनों में इसकी कमजोरी कीमती धातुओं को सपोर्ट करेंगी। अमेरिकी ट्रेजरी यील्ड, फेड मिनटों के बाद तेजी से गिरकर तीन सप्ताह के निचले स्तर पर आ गई। फेड मिनट्स स्पष्ट हुआ है कि नीति निर्माताओ की प्राथमिकता मुद्रास्फीति को कम करना है, और उच्च ब्याज दरों को लंबे समय तक बनाए रखने के लिए तैयार हैं। जिससे कीमती धातुओं की तेज़ी सीमित रह सकती है।
लेकिन, अन्य प्रमुख अर्थव्यवस्थाओं में धीमी व्यावसायिक गतिविधि के संकेतों का भी कीमती धातुओं के लिए सकारात्मक है। चीन और अमेरिका की मैन्युफैक्चरिंग पीएमआई के आंकड़े 50 के स्तरों के नीचे है, जो आर्थिक मंदी के डर को बढ़ा रहा है। इंटरनेशनल मॉनेटरी फण्ड द्वारा दुनिया की तीन बड़ी अर्थव्यवस्था अमेरिका, चीन और यूरोप की अर्थव्यवस्था को संकट में बताया है, जिससे कीमती धातुओं में सेफ हैवन मांग बनी हुई है।
सप्ताह के आंकड़े
इस सप्ताह अमेरिका से, मंगलवार को फेड चेयर जेरोम पॉवेल की स्पीच, गुरुवार को सीपीआई (मुद्रास्फीति) और शुक्रवार को कंस्यूमर सेंटीमेंट के आंकड़े प्रमुख है।
तकनिकी विश्लेषण
इस सप्ताह कीमती धातुओं में तेज़ी रहने की सम्भावना है। सोने में सपोर्ट 54000 रुपये पर है और रेजिस्टेंस 56100 रुपये पर है। चांदी में सपोर्ट 67000 रुपये पर है और रेजिस्टेंस 70500 रुपये पर है।
ऐसी और कमोडिटी मार्केट की लेटेस्ट अपडेट के लिए आज ही स्वस्तिका में अपना अकाउंट खुलवाएं

सकारात्मक दायरे में कीमती धातुओं के भाव
न्यू ईयर और क्रिसमस के चलते कीमती धातुओं में कारोबार सिमित रहा, हालांकि कीमती धातुओं के भाव मजबूती के साथ सिमित दायरे में बने हुए है। भारत में पिछले एक साल में सोने और चांदी की कीमतों में अच्छी बढ़त दर्ज की गई है जबकि फेड और अन्य प्रमुख केंद्रीय बैंको द्वारा मई 2022 के बाद लगातार की गई ब्याज दर वद्धि के कारण कॉमेक्स वायदा में सोने और चांदी की कीमतों में मामूली बढ़त देखि गई है। हालांकि, लगातार ब्याज दर वृद्धि के कारण मुद्रास्फीति में कुछ कमी देखने को मिली, लेकिन फेड द्वारा ब्याज दर वृद्धि में नरमी से सोने और चांदी के भाव में चमक लौट आई है। नए साल के लिए कोवीड वापसी की चिंता और आर्थिक मंदी की आशंका, कीमती धातुओं के भाव के लिए ट्रिगर रहेगा। डॉलर, जो सोने के विपरीत दिशा में चलता है, में गिरावट से कीमती धातुओं के भाव को सपोर्ट रह सकता है। साल 2022 में क्रिप्टो करेंसी में जबरदस्त बिकवाली और बिटकॉइन जिसको सोने के विकल्प के रूप में देखा जा रहा था, अपने उच्चतम स्तर से 76 प्रतिशत टूट चुका है जिससे निवेशकों का भरोसा सोने पर बना हुआ है। फेड द्वारा ब्याज दरे उम्मीद से ज्यादा बढ़ा दी गई है, और अधिक ब्याज दरों में बढ़ोतरी ग्लोबल अर्थव्यवस्था पर प्रतिकूल प्रभाव डाल सकती है जबकि फेड के बाद यूरोपियन सेंट्रल बैंक भी लगातार ब्याज दर बढ़ाने के संकेत दिए है। ग्लोबल शेयर बाज़ारो से मिले-जुले संकेत, निवेशकों को सेफ हैवन की तरफ आकर्षित कर सकता है। इस सप्ताह ओपेक - नॉन ओपेक देशो की बैठक, फेड बैठक के मिनट्स और अमेरिकी पैरोल के आंकड़े कीमती धातुओं के लिए महत्वपूर्ण रहेंगे।
तकनिकी विश्लेषण
इस सप्ताह कीमती धातुओं में तेज़ी रहने की सम्भावना है। सोने में सपोर्ट 54400 रुपये पर है और रेजिस्टेंस 55500 रुपये पर है। चांदी में सपोर्ट 68000 रुपये पर है और रेजिस्टेंस 70500 रुपये पर है।
.webp)
भारत में इस साल 13 प्रतिशत तेज़ हुए सोने के भाव
यूएस फेड की अति-उच्च ब्याज दर मौद्रिक नीति ने 2022 में सोने और चांदी की कीमतों को दबाव में रखा। हालांकि, फेड द्वारा दरों में बढ़ोतरी की श्रृंखला के बावजूद, मुद्रास्फीति 40 साल के उच्च स्तर के करीब बनी रही, जबकि उभरते बाजार की मुद्रा में भारी अवमूल्य, निवेशकों को सोने और चांदी की तरफ आकर्षित करते रहे। बैंक ऑफ जापान, यूरोपीय सेंट्रल बैंक और यूएस फेड की कठोर मौद्रिक नीति, वैश्विक विकास दर को क्षति पहुंचने की सम्भावना से अनिश्चितता बढ़ रही है। अगले साल भी अगर ब्याज दरे बढ़ती रही तो ग्लोबल अर्थव्यवस्था को नुकसान हो सकता है जिससे हेवन मांग 2023 में बने रहने का अनुमान है। चीन में बढ़ते कोवीड मामले, दुनिया के लिए एक बार फिर चिंताओं को बढ़ाने लगे है जिससे कीमती धातुओं के भाव घरेलु बाजार में अपने उच्चतम स्तरों के करीब पहुंच गए है। हालांकि, लगातार ब्याज दरों में बढ़ोतरी होने के बावजूद, अमेरिका के आर्थिक आकड़ो में सुधार और चीन में कोवीड प्रतिबंधों में ढील से कीमती धातुओं की तेज़ी सीमित रही है। भारत में पिछले साल की तुलना में इस साल सोने का आयात 35 प्रतिशत ज्यादा रहने का अनुमान है। पिछले एक साल में डॉलर ने 11 प्रतिशत बढ़त दर्ज की है और 83 रुपये के उच्चतम स्तरों पर पहुंच गया है। बढ़ती ब्याज दरों के कारण भारत जैसी उभरती अर्थव्यवस्था से फण्ड ऑउटफ्लो बढ़ा है जिससे चालू खाते में बढ़ोतरी हुई है और कीमती धातुओं के भाव को सपोर्ट रहा है। घरेलु वायदा बाजार में सोने ने साल-दर-साल 13 प्रतिशत और चांदी ने 11 प्रतिशत का रिटर्न दिया है, जबकि कॉमेक्स में सोने और चांदी के भाव फ्लैट रहे है। दुनिया में फैली महामारी के बीच कठोर मौद्रिक निति, कीमती धातुओं में सुरक्षित निवेश की मांग बढ़ा सकता है।
तकनिकी विश्लेषण:
इस सप्ताह कीमती धातुएँ सकारात्मक दायरे में रहने की सम्भावना है। सोने में सपोर्ट 53700 रुपये पर है और रेजिस्टेंस 55200 रुपये पर है। चांदी में सपोर्ट 67700 रुपये पर है और रेजिस्टेंस 71500 रुपये पर है।

फेड की हॉकिश टिपण्णी से बिगड़े सोने-चांदी में तेज़ी के सेंटीमेंट
पिछले सप्ताह कीमती धातुओं की तेज़ी, अमेरिकी फेड के हॉकिश टिप्पणी से थमती दिखी। घरेलु वायदा बाजार एमसीएक्स में सोने के भाव 9 महीने के उच्च स्तरों से पीछे हट गए जबकि चांदी में भी गिरावट दर्ज की गई है। कॉमेक्स वायदा में सोने की कीमते 1800 डॉलर के ऊपर नही टिक रही है। ज्यादातर प्रमुख केंद्रीय बैंको का कहना है की ब्याज दरों का उच्चतम स्तर अभी दूर है जिसके कारण आर्थिक मंदी का डर फिर से बढ़ने लगा है और कीमती धातुओं के साथ दुनिया भर के शेयर बाज़ारो में बिकवाली का दबाव देखने को मिला है। पिछले सप्ताह अमेरिकी फेड के बाद यूरोपियन सेंट्रल बैंक द्वारा भी लगातार ब्याज दरे बढ़ाने की बात कही है क्योकि मुद्रास्फीति अभी टारगेट से ऊपर चल रही है।
अमेरिका, चीन और यूरो ज़ोन के आर्थिक आंकड़ों से यह स्पष्ट होता है की यह प्रमुख अर्थव्यवस्थाएं उच्च मुद्रास्फीति और बढ़ती ब्याज दरों के दबाव से जूझ रही हैं। इस साल लगातार हो रही ब्याज़ दर वृद्धि के कारण सोने के स्थान पर निवेशकों ने डॉलर को चुना है और केंद्रीय बैंको का मोद्रिकनीति पर कठोर रुख अमेरिकी डॉलर इंडेक्स में तेज़ी का ट्रेंड फिर से शुरू कर सकता है। लेकिन, चीन में कोवीड प्रतिबंधों में ढील के बाद कोरोना मामलों में बढ़ोतरी और ग्लोबल अनिश्चितताओं के चलते कीमती धातुओं में निचले स्तरों पर सपोर्ट देखने को मिलेगा। पिछले सप्ताह फेड की बैठक के बाद सोना सप्ताह के उच्च स्तरों से 900 रुपये फिसल कर 54200 रुपये प्रति दस ग्राम के स्तरों पर पहुंच गया। जबकि चांदी के भाव भी सप्ताह के उच्च स्तरों से 2500 रुपये टूट कर 67000 रुपये प्रति किलो पर रहे।
तकनिकी विश्लेषण
इस सप्ताह कीमती धातुओं में क्रिसमस हॉलिडे के चलते सीमित दायरे में कारोबार रहने की सम्भावना है। सोने में सपोर्ट 53300 रुपये पर है और रेजिस्टेंस 55000 रुपये पर है। चांदी में सपोर्ट 65000 रुपये पर है और रेजिस्टेंस 69000 रुपये पर है।

Top Dividend Payer Vedanta Dividends Since 2021
Vedanta to Pay a Third Interim dividend at Rs 17.5 per Equity Share
One of the largest mining and metals companies in the world, Vedanta Limited, managed by billionaire Anil Agarwal, has interests in iron ore, steel, copper, zinc-lead-silver, aluminum, power, oil, and gas in India, South Africa, and Namibia.
The Mumbai-based business paid its shareholders the first interim dividend for FY23, which was 31.5 rupees per equity share, in May 2022. In July 2022, it paid eligible shareholders the second interim dividend, which was 19.5 rupees per share.
The company had declared a third interim dividend of Rs 17.50 per equity share, or 1750% of the face value of Re 1 per share, for the Financial Year 2022–23, totaling Rs 6,505 crore, by a resolution voted by circulation on Tuesday, November 22, 2022.
Vedanta Dividend Ex-Date 2022
The ex-dividend date for Vedanta stocks will be before the record date. A stock often trades ex-date prior to the record date. Vedanta ex-dividend will be on November 29.
Vedanta Dividend Record Date 2022
Vedanta has set the record date for determining whether shareholders are eligible to receive a dividend payment of Rs 17.50. The record date for the dividend's payment, according to the firm, is November 30. This indicates that Vedanta would pay shareholders who have shares of the company in their Demat accounts.
Dividend History
The business raised its total pay-out in two rounds of dividends announced so far in FY23 to Rs 18,960 crore in July when it announced a second interim dividend of Rs 19.5 per equity share.
The company announced its first interim dividend of Rs 31 per share in April, which resulted in an outflow of Rs 11,710 crore.
The Vedanta Resources dividend announcements coincide with the company's efforts to deleverage its balance sheet, since Vedanta Resources controls 69.7% of Vedanta.
Vedanta was the top dividend-paying company in FY22, and it was followed in the top 20 list by businesses like Tata Consultancy Services, Oil and Natural Gas Corporation, HCL Technologies, Indian Oil Corporation, Hindustan Unilever, Hindustan Zinc, Indian Tobacco Company, State Bank of India, and Reliance Industries.
VEDANTA's Peers
The stocks in this group to be on the lookout for are NMDC, HINDUSTAN ZINC, and COAL INDIA.
Year Ended Dividend Payout Per Share (Rs)Dividend Payout Ratio (%)Dividend Yield EOY (%) COAL INDIA March 2022 17.060.3% 9.3% HINDUSTAN ZINC March 2022 18.0 79.0% 5.8% NMDC March 2022 14.74 6.0% 9.1%
Why Vedanta is giving Dividends
The company's extremely explicit capital allocation policy is one of the factors contributing to the aggressive and large dividend payments. It has specified exactly how much of the company's income would go toward inorganic growth, dividend policy, and capital expenditures. This policy states that shareholders shall receive a minimum of 30% of the company's attributable sustainable profit after tax (excluding HZL profits).
The Company has established a great track record of generating cash flows due to consistent increase in sales volume and balanced capital expenditure for ongoing operations.
Vedanta Financials
Prior to extraordinary and one-time tax credits, Vedanta's profit for the fiscal year 2021–2022 increased by 95% to 24,299 crores, while its sales increased by 51% to 1.3 lakh crore. The company's total debt was Rs 53,109 crore, while its EBITDA increased by 66% to Rs 45,319 crore. On July 28, 2022, the corporation will release its Q1 FY23 financial results.
According to the corporation, the company will maintain an adequate leverage ratio at the consolidated level. "Vedanta Limited's consolidated leverage ratio on December 21 was 0.7x, ranking among the best in its peer group. The company would maintain the consolidated ratio below 1.5x throughout typical business cycles, according to the organization.

.webp)
.webp)

.webp)


