
Why Did Gold-Loan NBFC Stocks Drop Up to 3%? A Retail Investor's Guide to Manappuram, Muthoot & More


Key Takeaways
- Gold-financier stocks fell up to 3% in intraday trading.
- The drop was driven by regulatory developments affecting the sector.
- Investors should monitor RBI policy cues and gold price trends going forward.
- Swastika's Sarthi AI offers deeper, institutional-grade stock insights.
Intraday shock: gold-financier stocks slid up to 3% amid regulatory cues and gold-price dynamics, raising questions for retail investors across India.
Gold loan NBFCs like Manappuram Finance and Muthoot Finance are part of a sector that often moves with policy updates, price of gold, and asset-quality signals. Here's what retail investors in India should know about this move and how to position their portfolios.
TLDR
Why did Manappuram Finance, Muthoot Finance, and other gold-finance stocks fall up to 3% in intraday trade?
In intraday trading, shares of Manappuram Finance, Muthoot Finance, and other gold financiers declined by up to 3% as market participants priced in regulatory risk and sector-specific headwinds. The move signals the market's alignment with regulatory developments affecting gold-loan lenders and their collateral-backed lending model. Traders will watch for how these players manage gold-price volatility and the evolving policy environment moving ahead.
For a deeper, data-driven view on such stock moves, Swastika's Sarthi AI stock assistant can offer research insights tailored to your holdings. Try Sarthi AI for stock insights.
What regulatory and market factors are likely behind the gold loan NBFC weakness?
The weakness in this niche reflects regulatory developments that influence risk management, capital adequacy, and collateral valuation for gold loans. Regulatory actions can affect collateral coverage requirements, pricing flexibility, and the ability of NBFCs to grow lending in gold-backed segments. In addition, general market conditions for small- and mid-cap financials can magnify the impact of sector-specific policy changes, contributing to observed price moves.
How do gold loan NBFC fundamentals respond to gold price movements and regulatory changes?
Gold loans are secured by gold collateral, so changes in gold prices can affect collateral value and risk weightings in lending. Regulatory changes can influence lending growth, provisioning, and capital requirements, which in turn influence profitability and valuation. The combined effect of price volatility and policy shifts tends to translate into higher earnings volatility and stock-price sensitivity for the sector.
What should retail investors watch before investing in gold-finance NBFCs?
Retail investors should focus on stock-specific risk factors such as asset quality indicators, lending growth in gold-secured segments, and the management's ability to navigate policy changes. It's also important to monitor macro factors like the gold price trajectory and RBI or other regulatory signals that could alter risk profiles. Diversification across sectors and careful position sizing can mitigate the sector's volatility.
Takeaways for Indian retail investors: risk management in gold loan NBFCs
FAQ
Which stocks fell and by how much in intraday trading?
Shares of Manappuram Finance, Muthoot Finance, and other gold-financiers declined up to 3% in intraday trade.
What caused the slide in gold-financier stocks?
The move followed regulatory developments affecting the gold-loan sector.
Which factors should investors monitor after this move?
Investors should monitor RBI policy cues, gold price trends, and the sector's asset-quality indicators.
Where can I find deeper research on these stocks?
Swastika Investmart offers Sarthi AI stock assistant and research reports to analyze gold-finance stocks with institutional-level insights.
What should a retail investor do now when gold-financier stocks are volatile?
Adopt a risk-aware approach: diversify, assess asset quality, monitor regulatory developments, and use credible research tools before making decisions.
Conclusion
In the near term, the price action in gold-financier stocks reflects sector-specific regulatory sensitivity and gold-price volatility rather than a blanket judgment on the entire NBFC space. Retail investors should calibrate their risk tolerance, focusing on asset quality signals, volatility, and management commentary around regulatory developments.
Latest Articles

Important Fundamental Ratios to Consider When Investing in Stock Market


Many investors will suggest you go through the fundamentals of a company before picking any stocks. This means that you are required to check the financial records of a company which tells you that the stocks are worth investing in or not.
To be frank, not everyone is a finance expert to know everything about a company’s fundamental elements.
Financial Ratios to Study When Investing in Stocks
Here, I am going to share with you the 5 financial ratios you should study before investing in stocks:
1) Price to Earnings Ratio (P/E)
This is one of the crucial financial ratios investors have been using for a long time. P/E ratio is defined as the ratio of the current share price to the earning of the company per share. The ratio helps investors to determine whether the stock is undervalued or overvalued in the market.
For instance, if the company has overall earnings of Rs 1000 and has shares of 100 currently trading in the market. Therefore, it's earning per share is Rs 10. This means that you are paying Rs 10 to the company and in return, you get Rs 1 from the company’s earnings which is not good.
The Ideal Price to Earnings Ratio you can Invest in:
To be honest, there is no ideal price to identify P/E ratio of any stock. You cannot determine the exact P/E ratio as every industry has a different benchmark. If we compare the P/E ratio of two FMCG companies, let's say Hindustan Lever and Britannia, we will get to know that HUL is overvalued as compared to Britannia as the P/E of HUL is greater than 70 while the P/E ratio of Britannia is nearly 50.
The P/E ratio of JK Paper is 4 and if you compare this P/E ratio with HUL and Britannia, you will get an incorrect picture as the industries are very different. Hence it is suggested to know the industry benchmarks while analyzing the P/E of a company.
2) Return On Equity Ratio
Return on equity depicts the rate of return on the stock of a company. It’s a way to know about the company’s return on stock investment. Return on equity ratio is defined as Net income to total shareholder’s equity. This is an important ratio as it helps investors to determine how well a company shares its profit with its shareholders.
For instance, if investors contributed Rs 100 in equity and the total equity of the company is Rs 100. With this equity, if a company generates Rs 20 then ROE is 20%. On the other hand, if another company with the same equity generates an income of Rs 40, then the ROE of that company will be 40%. The company that generates better ROE is considered as good to invest in.
Return on Equity is defined as Net income/ Average Stockholder’s equity.
3) Price To Book (P/B) Ratio
Price to Book Ratio is calculated as Price per share divided by Book value per share. The ratio simply depicts the comparison of a company’s market capitalization to its book value.
Price to Book ratio gives investors an idea of how much shareholders willing to pay for the net asset of a company. Generally, a low P/B ratio is considered good. Do remember that the ratio should be compared within the same industry. For example, the P/B ratio of a manufacturing company should be compared with the P/B ratio of another manufacturing company.
4) Dividend Yield Ratio
The dividend yield ratio is calculated as the amount of dividend a company pays to its shareholders over the years to its current stock market price. For example, if the share price of a company is Rs 100 and it gives a dividend of Rs 10 then the dividend yield ratio will be 10%.
To get deeper into this, let's assume that an investor purchases a stock at a price of Rs 100. A year later, the stock price is still constant, i.e Rs 100. Is this a good investment? Of course not. You receive a zero per cent return from that company.
5) Debt to Equity Ratio
Needless to say, the Debt to Equity ratio depicts the amount of debt and equity of a company. This gives investors a clear idea of how much the company running on borrowed capital and owned funds.
Debt to Equity Ratio is defined as total liabilities/total shareholder equity.
Ideally, it is suggested to invest in a company which gives you high ROE for at least 3 years.

Macroeconomic Factors that Influence US Stock Market
Predicting a stock market trend is not an easy task; some say, the stock market runs on investors’ sentiments while some traders deny the fact. However, this is not the case. Of course, investors’ sentiments affect the stock market to a greater extent but some economic factors play a crucial role in identifying the prediction of the stock market.
To begin with, economic news may heavily impact the stock market as the economy goes up, and so too grows the stock’s profitability. Top companies whose shares are currently trending at the top in the stock market mostly rely on a strong economic environment. As the economy grows, many investors look forward to buying products and services, which in turn increases stock prices.
On the contrary, when the economy struggles, people start to avoid spending on products that may heavily impact a company’s stock and as a result, the stock market experiences a strong decline.
Fundamental analysis of stocks helps investors to identify the real worth of stock, technical analysis, on the other hand, provides a detailed insight into stock and tries to capture the market’s psychology.
Some of the economic factors are inflation, the country's GDP, unemployment, retail sales and more. The majority of these factors affect the stock's performance. If investors are completely aware of these factors, they can upgrade their portfolio to minimize their losses.
Economic Factors that Influence Stock Market Growth
Let’s look at the economic factors that directly influence stock market growth:
1. Gross Domestic Product or GDP
This is one of the biggest economic factors which directly impacts the country’s economy. Gross domestic product is the final value of goods and services produced in a country during a specific period of time. It tells the overall economic performance of a country. Usually, GDP is calculated on an annual basis while sometimes it is measured quarterly.
In many countries such as the US, the government yearly releases GDP reports along with the annualized GDP for each fiscal quarter. In simple terms, GDP is a measure of economic growth which tells the overall health of the country.
If the GDP of any country performs well, investors buy shares hoping that the stocks will provide them outstanding returns. However, if the GDP is contracting, the profitability of the companies tend to decrease as the investors start to avoid purchasing stocks which in turn cause a significant drop in the stock market.
The upliftment of GDP encourages investors to purchase more stocks as they are optimistic about the earnings of the stock market.
2. Unemployment
Wages gives a clear report on the economy. For instance, consumer spending automatically drops whenever the unemployment rate is high. As the funds are limited, people show less interest in buying; they spend less amount on secondary items and allocate funds only to needy items.
This may reduce the earning capacity of the companies which highly affects the stock market prices.
Conversely, if the employment rates are rising and vice versa, then the market condition forces investors to buy more stocks which makes a positive impact on the stock market.
3. Inflation Rate
GDP and inflation are the two factors that affect the stock market as it impacts overall consumer spending. Inflation, in general terms, is defined as the rising price of goods and services within a particular economy. It means the price of goods and services is continuously rising which decreases the purchasing power of consumers.
Rising costs may heavily impact business and their profits as no investors are ready to purchase the stocks of these companies which suffer businesses a lot. Hence, when the inflation rate rises, the stock market falls very badly.
Rising inflation makes investors hedge their portfolio as rising inflation increases the volatility of the stock market.
4. Interest Rates
Needless to say, high-interest rates negatively affect the stock market as rising interest rates limit the borrowing capital for the businesses which in turn hamper the growth of the business. This can heavily impact business growth, potential earnings and stock prices.
Rising interest rates also form a great impact on consumers. This is because rising interest rates affect the mortgage interest payments which decrease the purchasing power of the consumers.
5. Exchange Rates
Exchange rates are also an important factor that influences the US stock market. A weak exchange rate signifies cheaper export rates internationally. This is good for those companies who regularly export goods and services. A high exchange rate is directly related to cheaper imports, hence it is apt for companies who use imported goods such as manufacturing goods.
Takeaway
Understanding the macroeconomic indicators and setting your portfolio according to them is the hallmark of any investor. It is seen that many investors get easily influenced by so-called analytical reports without going through it. For a successful investor, it is important to invest some time in understanding the microeconomic factors of a country before investing.

Top Stock Strategies to Make Money by Coming Christmas
The lure of making easy money always draws investor’s attention towards stock market trading. However, the process of stock trading is not as easy as it seems to be. For successful stock trading, investors are required to have a sound understanding of the market. Knowing fundamental analysis and technical analysis should be on their priority lists as it enables them to make a potential return in minimum time. If not, then instead of generating any profit, investors are most likely to suffer huge losses in the stock market.
- Stock Market Is Not A One Day Thing
As the stock market giant Warren Buffet said; the money in the stock market is not built in a day. Preparing a strong portfolio maybe even tougher. It requires a lot of patience, adherence to make successful money in the stock market. He further said an investor needs to give some time to his stocks to get compounded over the years. The wealth of an investor is built over the years and so is the world-class company. For a successful investor, it is required to develop the appetite to digest the short term losses. Firstly investors need to identify the quality stocks which can provide them with long term gains. Secondly, do the fundamental analysis and technical analysis of a stock as it gives them a clear idea about the past performance of a stock. Plus the investors will also get to know the future trend of a stock according to market predictions.
- Follow the Value Rather Than Price
According to Philip Fisher, author of Common Stocks and Uncommon Profits once said, the stock market is filled with the investors who only run behind the price rather than the value of a stock. For a smart investor, it would be feasible if he chases the value of a stock as it enables them to identify the prospectus of the company, sustainability of its products/services, and the ability to generate capital to meet the future demands. The growth of a stock depends on its potential earnings and the company’s ability to execute it.
- Invest In Future
A smart investor is the one who has the potential to think and invest in the future. Mature markets with vested features eventually phase out and are often replaced by high-quality products with upgraded features. Nokia, who once was the market leader of the mobile phone company couldn't hold the smartphone wave and ultimately lost out to the top upgraded companies such as Apple, Samsung and Sony Ericsson.
- Time the Stock Market
It is extremely important to predict the stock market price before entering the market. With time to market, investors can lose their hard earning money in no time. Many experienced investors give advice not to time the market as no one has done with success. This is because no one can accurately tell the top and bottom prices of any stock.
- Maintain a Disciplined Approach For Investment
If you look at the history of the stock market, you will get to know that even the best bulls in the stock market had given a bundle of panic movements to investors. Due to unpredictable market trends and volatility, many investors had lost the money even if the market experienced a bullish trend. However, all the investors who had maintained their disciplined approach during the market ups and downs, have generated greater returns. If you are looking for long term stock market returns, it would be ideal to have a systematic approach for investing.
- Plan, Analyze And Conclude
Planning before investing is extremely important as it enables investors to get a clear insight into stocks such as which stocks are worth buying and which are not. After the successful accomplishment of a plan, one must analyze the structure of the stock market along with the company, an investor wants to trade-in. Analyzing the stock market includes studying the stock market in-depth, technical analysis of a stock and time to buy or sell a stock in the market. Once an investor goes through all the aspects of the market, they are ready to start trading in the stock market.
- Take Your Losses Quickly and Your Profits Slowly
It is always said that the first loss is the smallest loss in the stock market. Many investors continuously invested in the companies which are making a loss hoping that someday the same company will provide them outstanding returns. This is not a winning strategy. No matter if you are a trader or investor, he must be able to take fast decisions when continuous losses are identified. Such errors are made by experienced traders also. Therefore, it is better to understand the losses rather than understanding the profits, as losses will help you to understand the market more clearly.
The Bottom Line:
Investing in the stock market may provide you with potential returns if done carefully. Entering into the stock market without having proper planning may always incur a great loss to the investors. Therefore it is ideal to make your homework first before stepping into the stock market. If you are a newbie or a professional who is trying to retrieve attractive returns from the stock market then Swastika acts as a one-stop solution for you.Try Swastika Investmart to manage your wealth profile. Click here to open a Demat account or feel free to contact us.
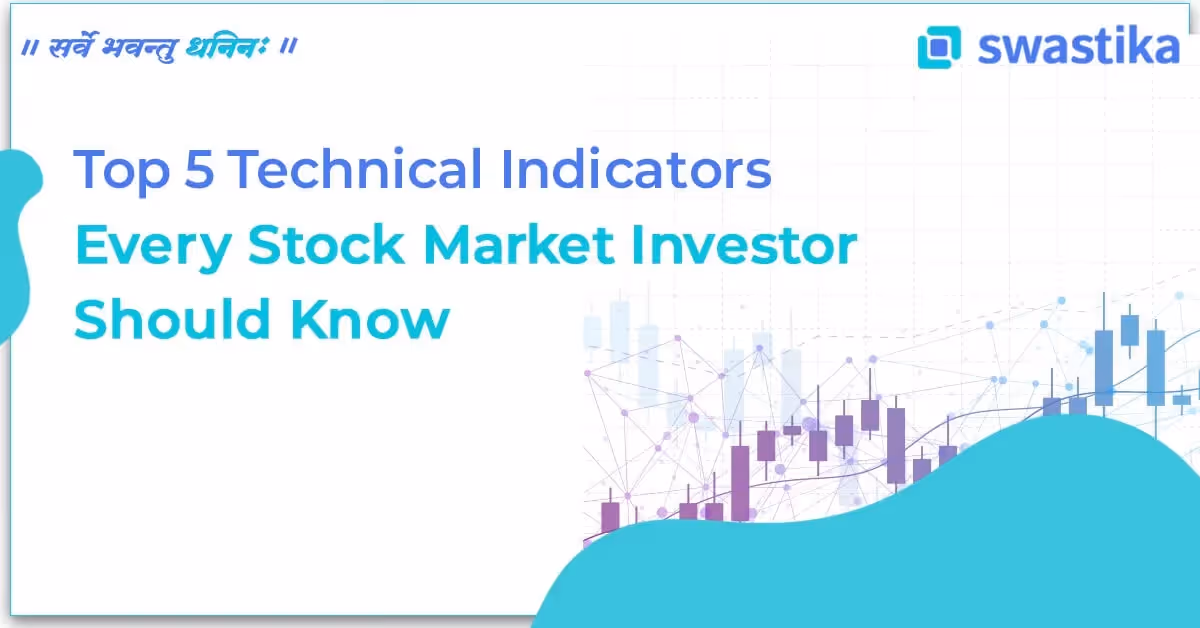
Top 5 Technical Indicators Every Stock Market Investor Should Know
Fundamental analysis and technical analysis are the two skills that every investor should know for successful trading. Although they differ from each other yet they are equally important to learn as these indicators help stock market traders to get full insight into the stock.
Fundamental analysis is the study that directly affects a company’s potential value. This includes both macroeconomic and microeconomic factors as well as strategic planning, employee relations and supply chain.
What are Technical Indicators
Technical indicators also known as technical's are used to see the past trends of stock and to anticipate the future price of a stock. Technical indicators have nothing to do with the basics of a company such as earnings, revenue, profit margin. The examples of technical indicators are relative strength index, moving averages and stochastic oscillators.
A technical indicator’s objective is to financial forecast direction. This can be achieved by calculating by historic price, volume and open interest information. Technical indicators are basically used to plot a chart pattern which in turn is used to predict the trend of the stock market. Technical indicators help analysts to predict the future price of the stock by looking at its past performance.
Here, we are outlining the top 5 technical indicators every stock market investor should know:
1. Relative Strength Indicator
The relative strength indicator helps analysts to identify momentum, market conditions and warning signals for risky price movements. RSI is classified as a momentum oscillator which tells a figure between 0 to 100. Here, momentum is the rate of the rise or fall of a stock price. An asset which is around 60-70 level is considered as overbought whereas an asset near 30 is considered as oversold.
Research analysts said that RSI is one of the most reliable indicators to ascertain accumulation and distribution phase. Also, it is helpful to measure the strength of the ongoing trend of stocks.
2. Moving Averages
Moving Averages or Simple Moving Average is one of the oldest and widely used technical indicators that is used to identify the direction of the current price trend without interrupting the short term price strike.
The formula of Moving Averages is the combined price points of a financial instrument over a specific period divided by the number of data points to present a single trend line. There are three types of Moving Averages: Simple moving average (SMA), exponential moving average (EMA) and weighted moving average (WMA).
Generally, common periods for moving averages are 10 days, 21 days, 50 days, 100 days and 200 days.
3. Bollinger Band
The indicator aims at providing a range within which the price of an asset generally trades. Also, Bollinger bands clearly reflect the volatility by increasing and decreasing the band.
Bollinger bands consist of a set of three band curves drawn that are expected to tell the security prices.
The primary function of the indicator is to provide a relative definition of high and low. As per the definition, the prices are high at the upper band and low at the lower band. The narrower the bands with each other, the lower the perceived volatility of the financial instrument. Conversely, the wider the bands, the higher the perceived volatility.
Bollinger Bands are useful for recognizing an asset, for instance, when an asset is trading outside the upper parameters of the band, it can be overbought or vice versa.
4. Moving Average Convergence Divergence
MACD is one of the widely used technical indicators to date. It detects the momentum of a stock by comparing two moving averages. It assists traders to identify buy and sell opportunities around resistance and support levels.
When two moving averages come together, it is known as Convergence, on the other hand, if they are moving away from each other, it is known as divergence.
The MACD line is used to compare the short term and long term momentum of stock so that analysts can identify its future direction. When the short term momentum line crosses the long term line, it clearly gives a sign of future stock activity. When the short term line crosses and surpasses the long term line, the stock will trade higher.
5. Average Directional Index (ADI)
ADX is used to measure the trend strength as it helps investors to quantify the strongest zone and increases the opportunity of building aggressive positions.
It works on a scale of 0 to 100, where a reading of increasing ADX value above 25 is considered as a strong trend while a value above 50 indicates exhaustion of a move where a number below 25 is considered a drift.
Analysts use this information in order to collect the data on whether the trend is going upward or downward.
Things to Ponder Before Using Technical Indicators
The foremost thing to remember to use trading indicators is that you should never use too many indicators at once nor in isolation. For better results, it is advisable to use a few indicators as they are best suited to what you are trying to achieve.
It is important to clearly monitor a signal for the best stock’s performance. For instance, if you are receiving a buy signal from an indicator and sell a signal from another indicator, then you have to use different indicators until your signals are confirmed.

Diversify Your Portfolio at Global Level
Like all other countries, Indian investors also have a strong home bias – all their investments will be in India. But there are many opportunities for investments outside of India as well. Further, some global markets have done very well so it is worth exploring investment opportunities outside India too.
In the past, the lack of international exchange-traded funds (ETFs) and mutual funds made global diversification difficult for the average investor, but these days, with lots of opportunities there’s no excuse for the so-called “home bias”.
According to the International Monetary Fund (IMF), in purchasing power parity (PPP), terms in the world’s GDP India contributes only 7.98%, which clearly shows Indian investors have little participation in the overall world’s economic growth.
Two of the major reasons why people invest in international investments and investments with some international exposure are:
Diversification
International investing might help the investors to spread their investment risk among different foreign companies and markets in addition to different companies and markets.
Growth
In emerging markets. It takes advantage of the potential for growth in some foreign economies.
Here, we’ll take a look at how the average investor can build a globally diversified portfolio...
Ways of Investing Globally
Global Mutual Funds
International Funds invest in all countries exceptional of the country in which you reside. while Global Funds invest in all countries around the globe with no exception.
Exchange-Traded Funds (ETFs)
ETFs are a collection of securities that tracks an underlying index such as stocks, however, they can invest in different sectors.
Investors can choose between many different types of mutual funds or ETFs, including:
- International Funds can invest broadly across many countries outside India.
- Regional Funds invest in specific regions.
- Country Funds invest in specific countries.
- Sector Funds invest in particular sectors across multiple countries, such as gold or energy.
These are two routes using which investors can invest abroad.
There are numerous funds which are dedicated to investing in offshore assets, with some devoted to themes such as commodities, EMs, Global smaller cap companies, Debt mutual funds, National Pension Systems, Public Provident Funds, Bank fixed deposit, Senior Citizens' Saving Scheme, Real Estate, Gold. etc. Along with them, there are equity funds that invest the majority of their assets in Indian shares, while also investing a trivial part of their portfolio in global listed equity. The investor’s fear of the risks while investing abroad is about the asset’s level of volatility – that is, how widely its price differs over time. There is currency risk which restricts the changes in the exchange rate against the investor’s home currency. Investors should study qualitative risk factors – like geopolitical risks and bond ratings, and political risk can have serious effects on a nation's economy.
Offshore investing is an attractive idea, given the ease and the low cost through which it can be done through mutual funds. Additionally, it also includes diversification as well as provides access to some of the best-performing companies in the world. Let’s have a look at the other benefits involved in investing globally.
Benefits of Investing Globally
1. Better Choice
People want to invest in the companies of their choice such as Apple, Facebook, Amazon, etc.
2. Diversification
Investing globally helps in diversification. It can reduce the risk in your portfolio as the locals might not have a reasonable effect on the international markets.
3. Bigger opportunities
There may be better and more profitable opportunities available in international markets.
4. A Reduction in Taxes
Many international countries offer attractive tax incentives to foreign investors in order to attract their wealth.
5. Global Growth
Investing internationally gives a bigger benefit for more growth which also means an increase in return potential in overseas investments.
6. Protection
Many foreign financial institutions are able to protect your investments from confiscation and other threats. They are also concerned with confidentiality regarding your finances.
How to build your Portfolio Globally
- One needs to determine the portfolio asset allocation.
- Diversify within the portfolio to get better returns.
- The risk involved with various kinds of investment.
- Rebalance your portfolio regularly.
- Investors should create a diversified global portfolio.
Market-linked investments have the potential of high returns but they carry high risks as well. Fixed-income investments help in accumulating the accumulated wealth in order to meet the desired goal there are some investments that are fixed-income while others are financial market-linked. Both fixed-income and market-linked investments play a major role in the process of wealth creation.

Upcoming IPO Blog 2021
IPOs are on the boom and many companies want to go public. In CY20 we saw many companies got listed and generated wealth for the investors. In 2017, we saw companies going public in bulk, and yet again in 2021 we expect the same trend will continue with many well-known companies trying to go public. In the few months, we may see few companies getting listed such as Kalyan Jewellers, Suryoday Small Finance Bank, ESAF Small Finance Bank, Nazara Technologies, RailTel Corporation, Sigachi Industries, Heranba Industries, Antony Waste Handling Cell, Mrs Bectors Food Specialities, Indigo Paints, Nureca and Stove Kraft. We recently saw Burger Kings subscribe 157 times which suggests that there will be demand for fundamentally sound companies. Along with the above-stated companies, there are few other companies on which we should keep an eye.
1. LIC (Life Insurance Corporation of India)
Life Insurance Corporation of India which is abbreviated as LIC is an Indian state-owned insurance group and investment corporation owned by the Government of India. LIC was founded on 1st September 1956 under the LIC act 1956. LIC started its operations with 5 crores which have now reached 31 lakh crore. LIC currently has 8 zonal offices, 113 divisional offices, 2,048 branch offices, and 12 lakhs+ agents which are present in 14 countries.
LIC IPO is a dream come true for many investors which might go public in 2021 which will be one of the biggest IPO in the Indian market. It is expected that it would hold the same limelight as Aramco IPO. Deloitte has been fixed as the pre-initial public offer (IPO) transaction advisors and it is expected that LIC will sell up to 10% of the stake in the IPO and IPO size is expected to be in between Rs. 80,000 crore to Rs. 1 lakh crore.
2. NCDEX (National Commodity & Derivatives Exchange Limited)
National Commodity & Derivatives Exchange Limited which is abbreviated as NCDEX is an online commodity exchange based in India. NCDEX is the leading agricultural commodity exchange in India which was incorporated on 23rd April 2003. NCDEX has offices in Mumbai, Delhi, Ahmedabad, Indore, Hyderabad, Jaipur, and Kolkata. NCDEX’s network comprised 380 members, 13,316 terminals, nine WSPs, 12 clearing banks, 41 financial institutions, and 246 FPOs representing 461,619 farmers, thereby encouraging a virtuous cycle, as of September 2019.
NCDEX would be the third exchange to get listed in the Indian Stock market after BSE and MCX. NCDEX is expected to launch its IPO in CY 21 and the IPO size is expected to be around Rs. 500 crore. ICICI Securities Limited and SBI Capital Markets Limited has been fixed as the lead manager to handle the IPO.
3. NSDL (National Securities Depository Limited)
National Securities Depository Limited abbreviated as NSDL is an Indian central securities depository headquartered in Mumbai which was established in August 1996. NSDL has 276 depository participants in its network through which it provides depository services to the investors, custodians, issuer companies, stockbrokers and stock exchange.
NSDL would be the second depository to get listed on the exchange after CDSL. Currently, NSE and IDBI bank hold 24% and 30% stake in the company. It is expected that IPO size might be of Rs. 1000 and the promoters might sell up to 30% stake in the company.
4. Barbeque Nation
Barbeque Nation is one of the fastest-growing casual dining restaurant chains in India. Barbeque Nation was originally incorporated as Sanchi Hotels Private Limited on October 13, 2006, at Indore, Madhya Pradesh by one of its promoters. Barbeque Nation has around 138 outlets across India and 7 outlets in the UAE, Oman, and Malaysia.
The IPO might comprise an OFS of 98,22,947 shares and a fresh issue of Rs. 275 crore as per the draft papers filed with the SEBI. It is expected that the IPO size will be approximately Rs. 1000 crore to Rs. 1200 crore and will be managed by IIFL Securities, Axis Capital, Ambit Capital and SBI Capital Markets.
In CY we saw there was a high demand for good IPO such as Happiest Minds, Mazagaon Dock and Burger Kings. It is expected the demand will boost further next year in the fundamentally sound IPO. We suggest the investors keep an eye on quality companies and bet for them in the IPO.
Big Budget

.avif)
.avif)
.avif)
.avif)
Popular Articles


.avif)
.avif)

.avif)


START YOUR INVESTMENT JOURNEY
Get personalized advice from our experts
- Dedicated RM Support
- Smooth and Fast Trading App
