SpaceX IPO Could Break History with $75 Billion Raise : Is This the Biggest Listing Ever?


.png)

The buzz around the SpaceX IPO is growing rapidly, and for good reason. Reports suggest that SpaceX could raise up to $75 billion, making it one of the largest public listings in global financial history. For Indian investors tracking global opportunities, this potential IPO is more than just hype. It signals a shift in how private tech giants are approaching capital markets.
Let’s break down what this means, how it compares to past IPOs, and whether Indian investors should pay attention.
Quick Takeaways
- SpaceX IPO could raise up to $75 billion, potentially the largest ever
- Strong interest from sovereign funds like Public Investment Fund
- May surpass historic IPOs like Saudi Aramco
- Indian investors may gain indirect exposure through global funds and platforms
Why the SpaceX IPO Is a Big Deal
Unprecedented Valuation and Demand
SpaceX, led by Elon Musk, has remained private for years despite massive growth. Its valuation has surged due to innovations in reusable rockets, satellite internet via Starlink, and strong government contracts.
If the IPO raises $75 billion, it could surpass the record set by Saudi Aramco’s $29.4 billion listing in 2019. That would make it the biggest IPO ever globally.
Anchor Investors and Global Interest
Reports indicate that Saudi Arabia’s Public Investment Fund is considering a $5 billion anchor investment. This level of institutional backing shows confidence in SpaceX’s long-term growth story.
Large IPOs often rely on anchor investors to stabilize demand and pricing. This is similar to how IPOs in India are supported under Securities and Exchange Board of India guidelines.
How Does It Compare to Previous Mega IPOs?
Historically, the biggest IPOs have come from energy and tech sectors. Saudi Aramco still holds the top position, followed by companies like Alibaba.
However, SpaceX stands out because it operates in the emerging space economy. This includes satellite internet, space exploration, and defense contracts, making it a unique investment opportunity.
For Indian investors, this is comparable to how tech IPOs like Zomato or Paytm reshaped local markets, though on a much larger global scale.
Can Indian Investors Invest in SpaceX IPO?
Direct Investment Challenges
Indian investors cannot directly invest in US IPOs unless they use international brokerage platforms and comply with Reserve Bank of India regulations under the Liberalised Remittance Scheme.
Indirect Investment Routes
There are still ways to gain exposure:
- Investing in global mutual funds or ETFs that may include SpaceX
- Tracking listed companies with partnerships or exposure to SpaceX
- Using international investing platforms offered by brokers
Platforms like Swastika Investmart help investors explore global opportunities with research-backed insights, making it easier to understand such complex investments.
Risks to Consider Before Investing
Even though the hype is strong, investors should remain cautious.
High Valuation Risk
A $75 billion raise implies a massive valuation. If growth slows, returns may not justify the price.
Regulatory and Geopolitical Risks
SpaceX operates in sensitive sectors like defense and satellite communications, which can face regulatory scrutiny.
Market Volatility
Large IPOs often see price swings post-listing. Investors should avoid rushing in during peak hype.
This is where research-driven platforms like Swastika Investmart add value through expert analysis and advisory tools.
Why This IPO Matters for Indian Markets
The SpaceX IPO reflects a broader trend of innovation-driven companies dominating capital markets. It also highlights increasing global participation from sovereign funds and retail investors.
Indian regulators like SEBI are also pushing for more transparency and investor protection, ensuring that local IPO markets evolve alongside global trends.
For Indian investors, staying informed about such mega listings helps in building a diversified and future-ready portfolio.
Frequently Asked Questions
What is the expected size of the SpaceX IPO?
The SpaceX IPO could raise up to $75 billion, potentially making it the largest IPO in history.
Can Indian investors buy SpaceX shares?
Yes, but only through international investment routes under RBI’s Liberalised Remittance Scheme.
Is SpaceX IPO bigger than Saudi Aramco?
If it reaches $75 billion, it will surpass Saudi Aramco’s $29.4 billion IPO.
Is it safe to invest in SpaceX IPO?
Like any IPO, it carries risks including valuation concerns and market volatility. Proper research is essential.
Final Thoughts
The SpaceX IPO could redefine global capital markets if it achieves its projected scale. While it presents exciting opportunities, it also comes with significant risks that investors must evaluate carefully.
For Indian investors, the key is not just access but understanding. Platforms like Swastika Investmart provide the research, tools, and support needed to navigate such global opportunities with confidence.
If you are looking to explore smarter investing strategies and stay ahead of market trends, you can get started here:
Big Budget


.webp)
.webp)
.webp)
.webp)
.webp)


.webp)
.webp)
.webp)
.webp)
Latest Articles

What is Nifty and Sensex?


Introduction
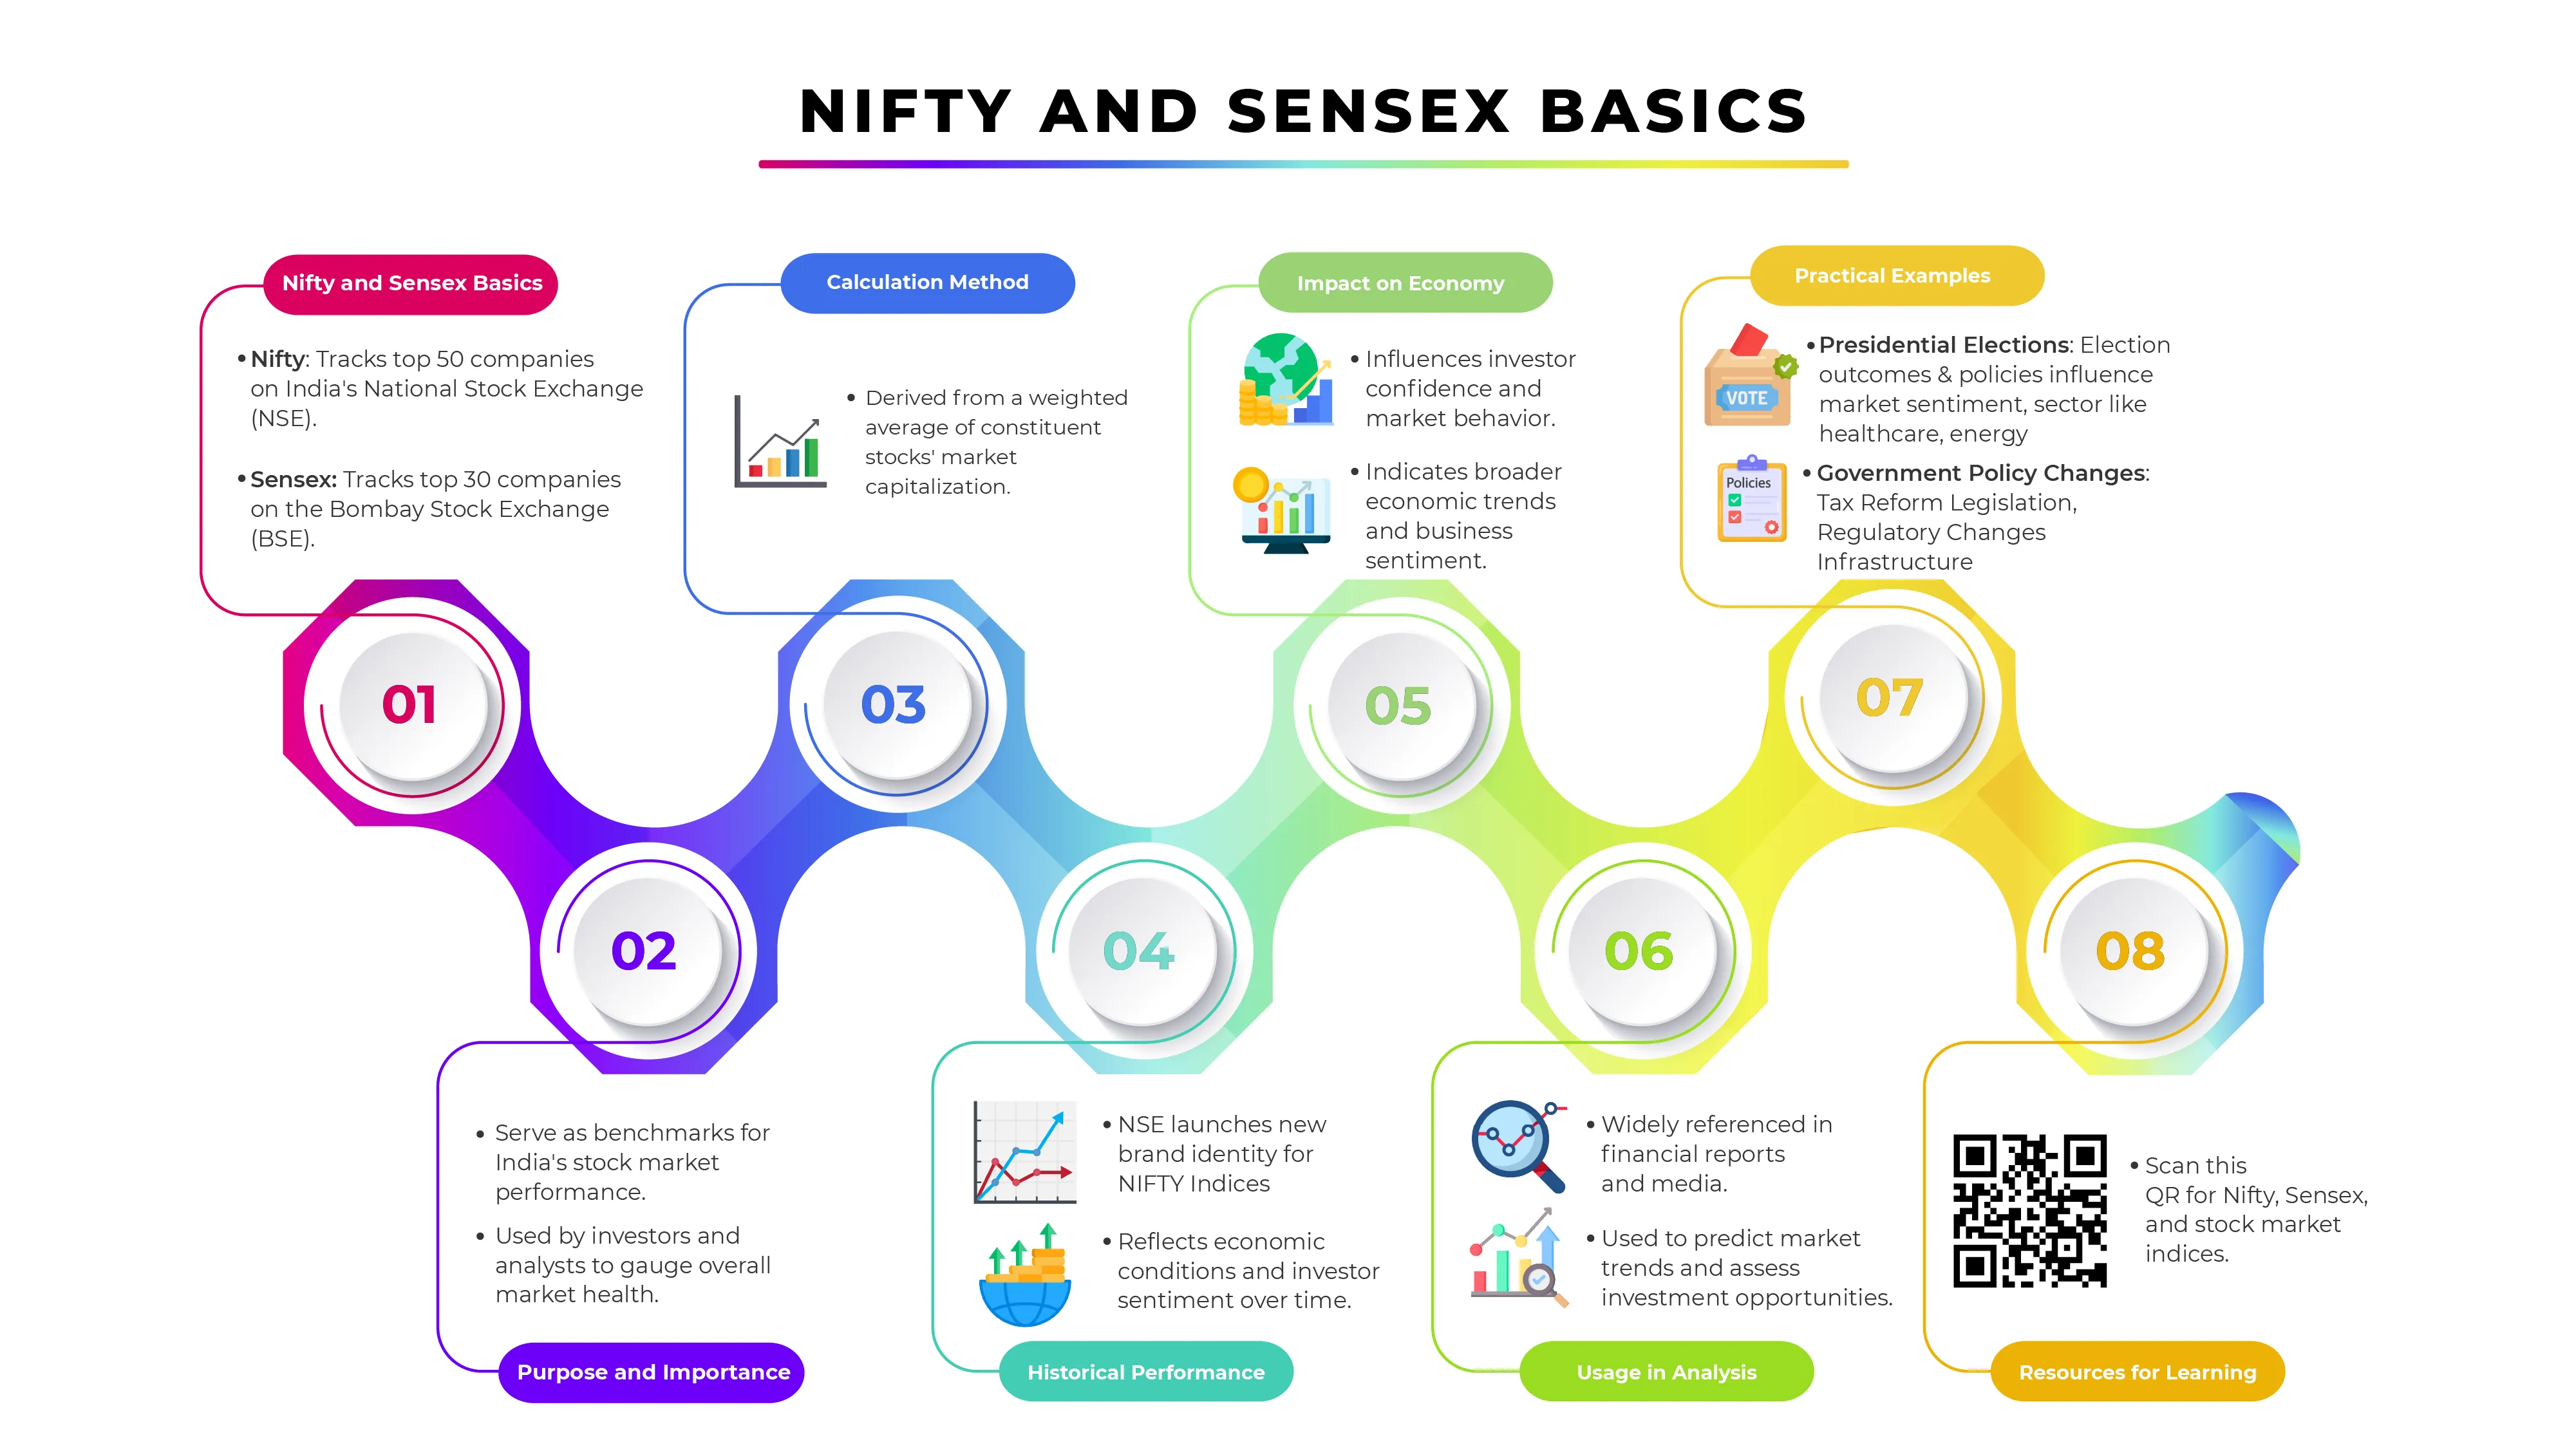
Nifty and Sensex are India's primary stock market indices, representing the performance of the National Stock Exchange (NSE) and the Bombay Stock Exchange (BSE) respectively. They are crucial for investors to measure the health and trends of the stock market.
What is Nifty?
Nifty, also known as the Nifty 50, is India's leading index of the National Stock Exchange (NSE). Launched in 1996, it represents the weighted average of the 50 largest and most liquid stocks traded on the NSE, making it a crucial barometer of the Indian capital markets and a reflection of the overall market performance. The Nifty 50 includes companies across various sectors, ensuring a comprehensive view of the market.
In addition to the Nifty 50, the NSE offers several other indices to provide a broader and more detailed understanding of market dynamics:
- Nifty 100: This index includes the top 100 companies listed on the NSE in terms of market capitalization and liquidity. It encompasses all the companies in the Nifty 50 as well as 50 additional companies, providing a wider perspective on the large-cap segment of the market.
- Nifty 500: As the name suggests, the Nifty 500 index includes the top 500 companies listed on the NSE, covering approximately 96% of the market capitalization of all the companies listed on the exchange. This index offers a comprehensive overview of the Indian equity market, including large, mid, and small-cap companies.
- Nifty Next 50: This index represents the performance of the 50 companies that rank just below the Nifty 50 in terms of market capitalization and liquidity. It serves as a benchmark for mid-cap stocks and provides insights into the potential candidates for inclusion in the Nifty 50.
- Nifty Midcap 100: This index captures the performance of the top 100 mid-cap companies listed on the NSE, offering insights into the mid-cap segment, which often includes companies with significant growth potential.
- Nifty Smallcap 100: This index comprises the top 100 small-cap companies listed on the NSE, focusing on the smaller and emerging companies in the market.
Key Features:
- Representation: Tracks 50 large-cap companies across various sectors.
- Market Capitalization: Based on free-float market capitalization.
- Sectoral Diversity: Includes sectors like IT, finance, energy, etc.
Recent Developments
The NSE has recently introduced a new index focused on the electric vehicle (EV) sector, reflecting this industry's growing importance and potential. This index aims to capture the performance of companies involved in the manufacturing, development, and supply chain of electric vehicles, highlighting the shift towards sustainable and eco-friendly transportation solutions.
Sectoral Weights in the Nifty 50
The Nifty 50 index is diversified across various sectors, with the top five sectors contributing significantly to its overall performance. As of the latest data, the sectoral weightage in the Nifty 50 is as follows:
- Financial Services: This sector has the highest weightage in the Nifty 50, reflecting the dominance of banks, non-banking financial companies (NBFCs), and insurance companies in the Indian market.
- Information Technology (IT): The IT sector, comprising major software services and technology companies, holds a significant portion of the index, underscoring India's strength in the global IT landscape.
- Consumer Goods: This sector includes companies involved in producing and distributing consumer products, both durable and non-durable, highlighting the importance of consumer demand in driving economic growth.
- Oil & Gas: The presence of leading oil and gas companies in the index signifies the critical role of energy resources in the Indian economy.
- Pharmaceuticals: The pharmaceutical sector's weightage reflects India's position as a major player in the global pharmaceuticals and healthcare industry.


Source - https://scripbox.com/pf/what-is-nifty/
What is Sensex?
Sensex or Sensitive Index, is India's benchmark index of the Bombay Stock Exchange (BSE). Launched in 1986, it is one of the oldest stock market indices in the country. Sensex comprises 30 well-established and financially sound companies across various sectors. These companies are selected based on their market capitalization and liquidity, representing the overall performance and health of the stock market.
Key Features:
- Historical Significance: Established in 1986, it's one of India’s oldest indices.
- Market Capitalization: Based on free-float market capitalization.
- Sectoral Coverage: Represents various key sectors of the economy.
Differences Between Nifty and Sensex
- Number of Stocks: Nifty has 50 stocks; Sensex has 30.
- Stock Exchange: Nifty is from NSE; Sensex is from BSE.
- Calculation Method: Both use free-float market capitalization but have different compositions.
Importance of Nifty and Sensex
- Market Barometer: Reflect overall market trends and investor sentiment.
- Benchmark: Used for comparing portfolio and mutual fund performances.
- Economic Indicator: Measure economic health and sectoral performance.
How Are They Calculated?
Both indices use free-float market capitalization, considering only the shares available for public trading. The formula involves stock prices and the number of publicly traded shares.
Why Follow Nifty and Sensex?
- Investment Decisions: Make better investment choices based on market trends.
- Market Trends: Provide insights into economic health and sector performance.
- Risk Management: Help in assessing market volatility and managing risk.
Detailed Aspects
- Sector Representation
Both indices cover diverse sectors. Nifty includes companies from sectors such as IT, finance, consumer goods, and energy. Sensex also represents a wide array of sectors, providing a holistic view of the market.
- Market Capitalization and Free-Float Methodology
Market capitalization is the total market value of a company's outstanding shares. The free-float methodology calculates market cap by excluding promoter and insider holdings, focusing only on shares available for public trading.
The formula for calculating the free float market capitalization is:
Free-Float Market Capitalization = Share Price × Number of Free-Float Shares
To determine the number of free-float shares:
Free-Float Shares = Total Outstanding Shares − Restricted Shares
Restricted shares include those held by promoters, insiders, and other strategic investors that are not available for public trading.
- Historical Performance
Nifty and Sensex have shown significant growth over the years, reflecting the overall economic development of India. Historical performance data can help investors identify long-term trends and investment opportunities.
- Economic Indicators
These indices are not only indicators of stock market performance but also reflect the economic conditions of the country. They are influenced by various factors, including economic policies, geopolitical events, and global market trends.
Practical Tips for Investors
- Regular Monitoring: Keep an eye on the daily movements of Nifty and Sensex.
- Diversification: Use these indices to diversify your investment portfolio.
- Long-Term Trends: Focus on long-term trends rather than short-term fluctuations.
- Better Decisions: Make investment decisions based on comprehensive market research and analysis.
Conclusion
Nifty and Sensex are essential tools for anyone involved in the Indian stock market. They provide a snapshot of market trends, economic health, and sectoral performances, helping investors make informed decisions. Understanding these indices can enhance your investment strategies and lead to better financial outcomes.

Understanding Ex Dividends in the Indian Share Market
Dividends are a way for companies to share their profits with people who own their stock. But to receive a dividend pay-out, timing is key. Let’s break down what dividends are and the important dates you need to know if you're investing in the Indian stock market.
What is a Dividend?
A dividend is a payment made by a company to its shareholders from its profits. When a company grows and decides to go public, it allows people to buy its shares through an Initial Public Offering (IPO). Once people buy shares, they become shareholders and can receive dividends from the company’s profits. These payments are often made regularly, such as every three months or once a year.
What is the Ex-Dividend Date?
The ex-dividend date is an important date for anyone buying stocks. It’s the deadline by which you must own the stock to get the next dividend payment. If you buy the stock on or after this date, you won't get the upcoming dividend; the previous owner will.
- Understanding the Ex-Dividend Date: This is the first business day after which new stock buyers become ineligible for the upcoming dividend pay-out.
- The Deadline: If you purchase a stock before the ex-dividend date, you'll be included in the company's record of shareholders who receive the dividend.
- Buying After the Ex-Dividend Date? No Dividend for You: Purchasing shares on or after the ex-dividend date means you won't be eligible for the upcoming pay-out. The seller in this case will receive the dividend.
So in simple words, If you purchase a stock before the ex-dividend date, you're considered a shareholder of record. This means you'll be entitled to receive the next dividend pay-out.
If you buy the stock on or after the ex-dividend date, you won't be eligible for the upcoming dividend. The seller in this case will receive the pay-out.
How it Affects Share Prices
When a stock goes ex-dividend, its price usually drops by the amount of the dividend. For example, if a company pays a ₹10 dividend and the stock price was ₹1000, it might drop to ₹990 on the ex-dividend date. This drop happens because the dividend is no longer included in the stock price.
Difference between the Ex-Dividend Date and the Record Date
- Ex-Dividend Date: The last day you can buy the stock to be eligible for the next dividend. If you buy the stock on or after this date, you won’t get the next dividend.
- Record Date: The date the company checks its records to see who owns the stock and is eligible for the dividend. To be on this list, you need to have bought the stock before the ex-dividend date due to the two-day settlement period (T+2).
Key Dates for Dividends
There are three key dates to remember when it comes to dividends:
- Ex-Dividend Date: The last day to buy the stock to get the next dividend.
- Record Date: The day the company looks at its records to see who gets the dividend.
- Payment Date: The day the company actually pays out the dividend to shareholders.
Conclusion
Knowing about dividends and the important dates can help you make better decisions when investing in stocks. The date is especially important because it determines whether you get the next dividend payment. By keeping track of these dates, you can manage your investments more effectively.

Understanding Dividends in the Indian Share Market
Dividends are a way for companies to share their profits with people who own their stock. But to receive a dividend pay-out, timing is key. Let’s break down what dividends are and the important dates you need to know if you're investing in the Indian stock market.
What is a Dividend?
A dividend is a payment made by a company to its shareholders from its profits. When a company grows and decides to go public, it allows people to buy its shares through an Initial Public Offering (IPO). Once people buy shares, they become shareholders and can receive dividends from the company’s profits. These payments are often made regularly, such as every three months or once a year.
What is the Ex-Dividend Date?
The ex-dividend date is an important date for anyone buying stocks. It’s the deadline by which you must own the stock to get the next dividend payment. If you buy the stock on or after this date, you won't get the upcoming dividend; the previous owner will.
- Understanding the Ex-Dividend Date: This is the first business day after which new stock buyers become ineligible for the upcoming dividend pay-out.
- The Deadline: If you purchase a stock before the ex-dividend date, you'll be included in the company's record of shareholders who receive the dividend.
- Buying After the Ex-Dividend Date? No Dividend for You: Purchasing shares on or after the ex-dividend date means you won't be eligible for the upcoming pay-out. The seller in this case will receive the dividend.
So in simple words, If you purchase a stock before the ex-dividend date, you're considered a shareholder of record. This means you'll be entitled to receive the next dividend pay-out.
If you buy the stock on or after the ex-dividend date, you won't be eligible for the upcoming dividend. The seller in this case will receive the pay-out.
How it Affects Share Prices
As an example, a company that is trading at 60 per share declares a 2 dividend on the announcement date. As the news becomes public, the share price may increase by 2 and hit 62.
If the stock trades at 63 one business day before the ex-dividend date. On the ex-dividend date, it's adjusted by 2 and begins trading at 61 at the start of the trading session on the ex-dividend date, because anyone buying on the ex-dividend date will not receive the dividend.
Difference between the Ex-Dividend Date and the Record Date
- Ex-Dividend Date: The last day you can buy the stock to be eligible for the next dividend. If you buy the stock on or after this date, you won’t get the next dividend.
- Record Date: The date the company checks its records to see who owns the stock and is eligible for the dividend. To be on this list, you need to have bought the stock before the ex-dividend date due to the two-day settlement period (T+2).
Key Dates for Dividends
There are three key dates to remember when it comes to dividends:
- Ex-Dividend Date: The last day to buy the stock to get the next dividend.
- Record Date: The day the company looks at its records to see who gets the dividend.
- Payment Date: The day the company actually pays out the dividend to shareholders.
Conclusion
Knowing about dividends and the important dates can help you make better decisions when investing in stocks. The date is especially important because it determines whether you get the next dividend payment. By keeping track of these dates, you can manage your investments more effectively.
.webp)
Types of Orders
What Is an Order?
An order is an instruction given to a broker or brokerage firm to buy or sell a security for an investor. It's the basic way to trade in the stock market. Orders can be placed by phone, online, or through automated systems and algorithms. Once an order is placed, it goes through a process to be completed.
There are different types of orders, allowing investors to set conditions like the price at which they want the trade to happen or how long the order should stay active. These conditions can also determine whether an order is triggered or cancelled based on another order.
Types of Orders
Market Order
A market order is an instruction to buy or sell a stock at the current price available in the market. With a market order, the investor doesn't control the exact price they pay or receive—the market decides the price. In a fast-moving market, the price can change quickly, so you might end up paying more or receiving less than expected.
For example, if an investor wants to buy 100 shares of a stock, they will get those 100 shares at whatever the current asking price is at that moment. If the price is ₹500 per share, they’ll buy 100 shares for ₹500 each. However, if the price changes before the order is executed, they might pay a different amount.
Limit Order
A limit order is an instruction to buy or sell a stock at a specific price or better. This allows investors to avoid buying or selling at a price they don't want. If the market price doesn't match the price set in the limit order, the trade won't happen. There are two types of limit orders: a buy limit order and a sell limit order.
Buy Limit Order:
A buy limit order is placed by a buyer, specifying the maximum price they are willing to pay. For example, if a stock is currently priced at ₹900, and an investor sets a buy limit order for ₹850, the order will only go through if the stock price drops to ₹850 or low
Sell Limit Order:
A sell limit order is placed by a seller, specifying the minimum price they are willing to accept. For example, if a stock is currently priced at ₹900, and an investor sets a sell limit order for ₹950, the order will only go through if the stock price rises to ₹950 or higher.
Stop Order
A stop order, also known as a stop-loss order, is a trade order that helps protect an investor from losing too much money on a stock. It automatically sells the stock when its price drops to a certain level. While stop orders are commonly used to protect a long position (where the investor owns the stock), they can also be used with a short position (where the investor has sold a stock they don't own yet). In that case, the stock would be bought if its price rises above a certain level.
Example for a Long Position:
Imagine an investor owns a stock currently priced at ₹1,000. They're worried the price might drop, so they place a stop order at ₹800. If the stock price falls to ₹800, the stop order will trigger, and the stock will be sold. However, the stock might not sell exactly at ₹800—it could be sold for less if the price is dropping quickly.
Example for a Short Position:
If an investor has shorted a stock at ₹1,000 and doesn't want to lose too much if the price rises, they might set a stop order at ₹1,200. If the price goes up to ₹1,200, the stop order will trigger, and the investor will buy the stock at that price (or higher if the price is rising quickly) to cover their short position.
To avoid selling at a much lower price than expected, investors can use a stop-limit order, which sets both a stop price and a minimum price at which the order can be executed.
Stop-limit order
A stop-limit order is a trade order that combines features of both a stop order and a limit order. It involves setting two prices: the stop price and the limit price. When the stock reaches the stop price, the order becomes a limit order. This means the stock will only be sold if it can meet or exceed the limit price, giving the investor more control over the selling price.
Example:
Let's say an investor owns a stock currently priced at ₹2,500. They want to sell the stock if the price drops below ₹2,000, but they don't want to sell it for less than ₹1,900. To do this, the investor sets a stop-limit order with a stop price of ₹2,000 and a limit price of ₹1,900.
If the stock price falls to ₹2,000, the stop order triggers, but the stock will only be sold if it can get at least ₹1,900 per share. If the price drops too quickly and falls below ₹1,900 before the order can be executed, the stock won’t be sold until it reaches ₹1,900 or higher.
In contrast, a regular stop order would sell the stock as soon as it hits ₹2,000, even if the price continues to fall rapidly and ends up selling for less. The stop-limit order gives the investor more control over the price, but there’s a chance the stock won’t sell if the limit price isn’t met.
Trailing stop order
A trailing stop order is a type of stop order that adjusts automatically based on the stock's price movement. Instead of setting a specific price, the trailing stop is based on a percentage change from the stock's highest price. This helps protect profits while allowing the stock to rise in value. If the stock's price falls by the set percentage, the order is triggered and the stock is sold.
Example for a Long Position:
Imagine an investor buys a stock at ₹1,000 and sets a trailing stop order with a 20% trail. If the stock price goes up to ₹1,200, the trailing stop will automatically move up to ₹960 (20% below ₹1,200). If the stock price then drops to ₹960 or lower, the trailing stop order will trigger, and the stock will be sold.
Example for a Short Position:
If an investor has shorted a stock at ₹1,000 and sets a trailing stop of 10%, the stop price would move down as the stock price falls. If the stock price rises by 10% from its lowest point, the trailing stop order will trigger, and the stock will be bought to cover the short position.
The trailing stop order allows the investor to lock in gains as the stock price moves favorably, while still providing protection if the market turns.
Immediate or Cancel (IOC) order
An Immediate or Cancel (IOC) order is a type of stock order that must be executed immediately. If the full order cannot be filled right away, whatever portion can be filled will be completed, and the rest will be canceled. If no part of the order can be executed immediately, the entire order is canceled.
Example:
Suppose an investor places an IOC order to buy 500 shares of a stock at ₹1,000 per share. If only 300 shares are available at ₹1,000 right away, the IOC order will purchase those 300 shares, and the remaining 200 shares will be canceled. If no shares are available at ₹1,000 immediately, the entire order will be canceled.
Good Till Cancelled (GTC) order
A Good Till Cancelled (GTC) order is a type of stock order that stays active until you choose to cancel it. Unlike other orders that expire at the end of the trading day, a GTC order remains open until you either cancel it or it gets executed. However, most brokerages set a limit on how long you can keep a GTC order open, usually up to 90 days.
Example:
Let's say an investor wants to buy a stock at ₹500, but the current price is ₹600. They place a GTC order to buy 100 shares at ₹500. This order will stay active until the stock price drops to ₹500 and the order is filled, or until the investor cancels the order. If the price never drops to ₹500 and the investor doesn't cancel the order, it will automatically expire after 90 days (or whatever time limit the brokerage sets).
Good 'Till Triggered (GTT) order
A Good 'Till Triggered (GTT) order is similar to a Good 'Til Canceled (GTC) order but with a key difference: a GTT order only becomes active when a specified trigger condition is met. Once the trigger price is reached, the order is placed in the market. If the trigger price is not reached, the order stays inactive.
Example:
Imagine an investor wants to buy a stock currently priced at ₹600, but only if it drops to ₹550. They set a GTT order with a trigger price of ₹550. If the stock price falls to ₹550, the order is activated and placed in the market. If the price never drops to ₹550, the order remains inactive until it reaches the trigger price or the investor cancels it.
GTT orders can also have a time limit, so if the trigger price isn’t reached within a certain period, the order will expire.
Conclusion
In the stock market, an order is a fundamental instruction to buy or sell a security, tailored to an investor's strategy and market conditions. The various types of orders—such as market, limit, stop, stop-limit, trailing stop, IOC, GTC, and GTT—offer flexibility to manage price, timing, and risk. Understanding these order types empowers investors to execute trades more effectively, ensuring alignment with their financial goals and risk tolerance.
Learn how to optimize your trades and manage risk with Swastika!

Understanding Long Strangles
The stock market can be unpredictable, and sometimes you might have a feeling that a stock's price will move significantly, but you're unsure if it will go up or down. This is where the long strangle strategy comes in.
The long strangle can be a valuable strategy for options traders who anticipate high volatility but are unsure of the price direction. However, it's important to understand the risks involved, including limited profit potential and the possibility of losing your entire investment.
What is a Long Strangle?
A long strangle is an options trading strategy that helps investors make money when they expect a big price move in a stock but aren't sure which direction it will go. This strategy involves buying two options: a call option and a put option with different strike prices. Both options are out-of-the-money, meaning they are not yet profitable at the current stock price.
Both call and put options are out-of-the-money (OTM), meaning their strike prices are above (for calls) or below (for puts) the current market price of the underlying asset.
Why Use a Long Strangle?
- Profit from Volatility: This strategy aims to benefit from a large price movement in the underlying asset, regardless of the direction (up or down).
- Lower Cost: Compared to a straddle, long strangles are generally less expensive because OTM options cost less than at-the-money (ATM) options used in straddles.
Example (using INR):
Imagine Nifty is at 10,400 and you expect an important price swing but are unsure of the direction. You can create a long strangle by:
- Buying a Nifty call option with a strike price of ₹10,600 (OTM call).
- Buying a Nifty put option with a strike price of ₹10,200 (OTM put).
Key Points:
- The net cost you pay for both options is your maximum loss.
- You'll potentially make a profit if the Nifty price moves above ₹10,600 (call strike + premium) or below ₹10,200 (put strike - premium).
Here's a table summarizing the profit and loss potential:

Break-even Points:
A long strangle has two break-even points:
- Lower Break-even Point: Strike price of Put - Net Premium
- Upper Break-even Point: Strike price of Call + Net Premium
The stock price needs to move beyond these break-even points for you to start making a profit.
Risks to Consider:
- Limited Profit Potential: a long strangle has a limited profit potential capped by the strike prices and volatility.
- Losing Your Investment: If the stock price ends up between the strike prices at expiration, you lose your entire investment (net debit).
When to Use a Long Strangle:
- High Volatility Expected: This strategy is suitable when you predict significant price changes in the underlying asset due to events like elections, policy changes, or earnings announcements.
Steps to Execute a Long Strangle:
- Choose the Underlying Asset: Select a stock or index where you expect an important price movements but are unsure of the direction.
- Pick OTM Strike Prices: Choose strike prices for both call and put options that are OTM but allow for enough price movement in either direction.
- Calculate Total Cost: Determine the combined cost of buying both options, including fees and commissions.
- Place Your Orders: Place buy orders for the chosen call and put options with specific expiration dates and strike prices. Make sure that you have sufficient funds in your brokerage account.
Conclusion:
The long strangle can be a valuable strategy for options traders who predict high volatility but are unsure of the price direction. However, it's crucial to understand the risks involved, including limited profit potential and the possibility of losing your entire investment.
Learn more about financial terminologies with Swastika!

What is a Bear Put Spread?
Options trading offers various strategies to maximize returns and minimize risks. One common strategy is the bear put spread, which helps investors profit from a gradual decline in a stock’s price. This blog will explain the bear put spread in simple terms with easy examples.
Goal of the Bear Put Spread
The primary goal of a bear put spread is to profit from a gradual decrease in the price of the underlying stock.
Understanding the Bear Put Spread
A bear put spread involves two steps:
- Buy a Put Option (Long Put): This gives you the right to sell a stock at a higher price.
- Sell a Put Option (Short Put): This obligates you to buy the same stock at a lower price if exercised.
Both options have the same stock and expiration date. You set up this strategy for a net cost (or net debit) and profit when the stock's price falls.
How to Set Up a Bear Put Spread
- Buy an ATM Put Option: An at-the-money (ATM) put option has a strike price close to the current market price.
- Sell an OTM Put Option: An out-of-the-money (OTM) put option has a strike price lower than the current market price.
- Ensure Both Options Have the Same Expiry Date
Example of a Bear Put Spread
Let's use stock XYZ as an example:
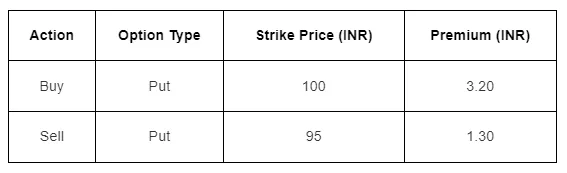
- Total Cost: 3.20 - 1.30 = 1.90 INR
How You Make Money
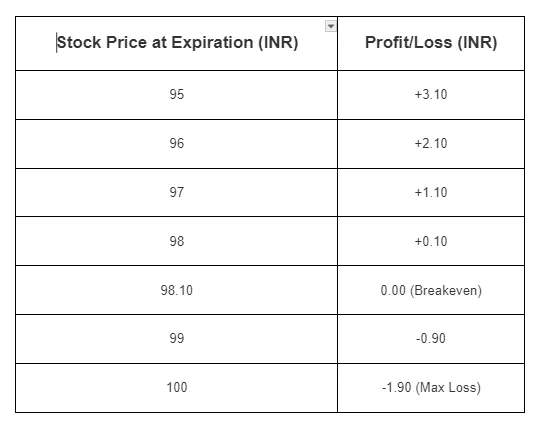
- Maximum Profit: The most you can earn is the difference between the two strike prices minus the net cost.
In this example:
- Difference between strike prices: 100 - 95 = 5.00 INR
- Net cost: 1.90 INR
- Maximum profit: 5.00 - 1.90 = 3.10 INR
You achieve this maximum profit if the stock price is below the lower strike price (95 INR) at expiration.
- Maximum Loss: The most you can lose is the net cost you paid.
In this example:
- Maximum loss: 1.90 INR
This loss happens if the stock price is above the higher strike price (100 INR) at expiration.
- Breakeven Price: The stock price at which you neither make nor lose money.
In this example:
- Breakeven: 100 - 1.90 = 98.10 INR
Profit/Loss Table
Advantages and Disadvantages of a Bear Put Spread
Pros
- Less Risky than Short-Selling: Limits your losses to the net amount paid.
- Profitable in Modestly Declining Markets: Effective when expecting moderate price declines.
Cons
- Risk of Early Assignment: The buyer of your short put can exercise it early if the stock price falls sharply. This would force you to buy the stock at a potentially unfavorable price.
- Limited Profit: Profits are capped at the difference between strike prices minus the net cost.
- Risk if Stock Price Rises: If the stock price rises significantly, the strategy results in a loss.
When to Use the Bear Put Spread
This strategy is ideal when you expect a moderate decline in stock prices and want to limit your risk. It works best in low volatility markets, as increased volatility after you enter the trade can amplify profits.
What Does the Bear Put Spread Result In?
The bear put spread results in a net debit, calculated as the difference between the higher and lower strike prices. The maximum loss is the net debit paid.
Closing a Bear Put Spread
It's usually a good idea to close a bear put spread before it expires if it's profitable. This helps you capture the maximum gain and avoid the risk of early assignment on the short put. If the short put is exercised, it creates a long stock position, which can be closed by selling the stock or exercising the long put. These actions may incur additional fees, so closing a profitable position early is often wise.
Summary
The bear put spread is a useful strategy for options traders expecting a moderate decline in stock prices. It offers a balanced approach by limiting both potential profits and losses, making it a safer alternative to other bearish strategies.
Learn more about financial terminologies with Swastika!


.webp)
.webp)

.webp)


START YOUR INVESTMENT JOURNEY
Get personalized advice from our experts
- Dedicated RM Support
- Smooth and Fast Trading App
