Income Tax Rules 2026 Explained: Save More Tax with These Hidden Updates


.png)

Understanding the latest Income Tax Rules 2026 can make a big difference to your financial planning. With subtle changes and lesser-known provisions, taxpayers in India now have more opportunities to legally reduce their tax burden. Whether you are a salaried individual, freelancer, or investor, staying updated can help you save more and invest smarter.
Key Highlights at a Glance
- New tax regime continues to gain preference with simplified slabs
- Deductions under old regime still beneficial for specific taxpayers
- Standard deduction adjustments improve salaried income relief
- Increased focus on digital reporting and compliance
- Investment-linked savings remain a powerful tax-saving tool
What’s New in Income Tax Rules 2026
Shift Towards the New Tax Regime
The government continues to promote the new tax regime by making it more attractive. Lower tax rates and fewer exemptions simplify filing, especially for individuals who do not claim multiple deductions.
However, the old regime still works well for those investing in instruments like ELSS, PPF, or claiming housing loan interest.
Standard Deduction Benefits
Salaried individuals and pensioners benefit from a standard deduction, which reduces taxable income without requiring proof of expenses. This continues to be a key relief feature under both regimes.
Updated Compliance and Reporting
With increasing digitization, the Income Tax Department now tracks financial transactions more closely. High-value transactions, stock market trades, and mutual fund investments are automatically reported.
This makes accurate filing essential and reduces chances of tax evasion.
Smart Ways to Save Tax in 2026
Maximize Section 80C Investments
Investments under Section 80C still offer deductions up to ₹1.5 lakh. Popular options include:
- Equity Linked Savings Scheme
- Public Provident Fund
- Tax-saving fixed deposits
For example, a salaried individual investing ₹1.5 lakh in ELSS can significantly reduce taxable income while also gaining exposure to equity markets.
Use Health Insurance Deductions
Under Section 80D, premiums paid for health insurance policies provide additional deductions. This is especially useful for families and senior citizens.
Capital Gains Planning
Investors in stocks and mutual funds should plan their capital gains strategically. Long-term investments often enjoy lower tax rates compared to short-term gains.
Using tools and research platforms from brokers like Swastika Investmart can help investors optimize their portfolio and reduce tax liability through better planning.
Real-World Example
Consider Rahul, a salaried employee earning ₹12 lakh annually.
- Under the new regime, he benefits from lower tax rates but fewer deductions
- Under the old regime, he claims deductions for PPF, insurance, and home loan interest
After comparison, Rahul finds the old regime saves him more due to his disciplined investments. This highlights why choosing the right regime is crucial.
Role of Regulations and Financial Platforms
Indian regulatory bodies like the Income Tax Department, along with frameworks influenced by institutions such as SEBI and RBI, ensure transparency and compliance in financial transactions.
Platforms like Swastika Investmart support investors with research-backed insights, tax-efficient strategies, and easy-to-use tools. Their SEBI-registered status and strong advisory services make them a reliable partner for both beginners and experienced investors.
Common Mistakes to Avoid
Ignoring Regime Comparison
Many taxpayers choose the default regime without evaluating which one benefits them more.
Missing Investment Deadlines
Failing to invest before the financial year ends can lead to missed deductions.
Incorrect Reporting
With automated tracking, mismatched income reporting can trigger notices.
Frequently Asked Questions
1. Which tax regime is better in 2026?
It depends on your financial profile. The new regime suits those with fewer deductions, while the old regime benefits investors and homeowners.
2. Are tax-saving investments still useful?
Yes, especially under the old regime. They reduce taxable income and help build long-term wealth.
3. How are stock market gains taxed?
Short-term gains are taxed higher, while long-term gains enjoy concessional rates after a threshold.
4. Is filing income tax more complex now?
Not necessarily. While reporting has become stricter, digital tools have made filing easier and faster.
Final Thoughts
The Income Tax Rules 2026 bring both simplicity and opportunity. By understanding the differences between tax regimes, leveraging deductions, and planning investments wisely, you can significantly reduce your tax outgo.
If you want to take smarter financial decisions backed by research and technology, consider exploring Swastika Investmart’s platform for better tax planning and investment strategies.
Big Budget


.webp)
.webp)
.webp)
.webp)
.webp)


.webp)
.webp)
.webp)
.webp)
Latest Articles

Understanding Commodity Transaction Tax (CTT): A Comprehensive Guide


In the realm of financial markets, various taxes and fees play a crucial role in regulating transactions and generating revenue for the government. One such tax that impacts commodity trading in India is the Commodity Transaction Tax (CTT). In this comprehensive guide, we will delve into the details of CTT, exploring its purpose, impact, and implications for traders and investors.
What is Commodity Transaction Tax (CTT)?
Commodity Transaction Tax (CTT) is a tax imposed by the Indian government on transactions executed on commodity exchanges. Introduced in the Finance Act, 2013, CTT is similar to the Securities Transaction Tax (STT) imposed on equity transactions. The primary objective of CTT is to generate revenue for the government and discourage speculative trading in commodity markets.
How Does CTT Work?
- CTT is imposed on the value of taxable commodities transactions conducted on recognized commodity exchanges in India. The tax rate varies depending on the type of commodity and the nature of the transaction. As of the latest guidelines, the following rates apply:
- CTT tax is 0.01% for non-agricultural commodities futures contracts and 0.05% for non-agricultural commodities options contracts. While agricultural commodities are exempt.
- CTT is typically collected by the commodity exchange at the time of the transaction and passed on to the government. It is applied to both buy and sell transactions, thereby impacting both buyers and sellers in the commodities market.
Purpose and Objectives of CTT
The imposition of CTT serves several purposes and objectives, including:
- Revenue Generation: CTT serves as a source of revenue for the government, contributing to the overall tax collection and fiscal management.
- Discouraging Speculative Trading: By imposing a tax on commodities transactions, especially in non-agricultural commodities, CTT aims to discourage speculative trading and promote more stable and orderly commodity markets.
- Level Playing Field: CTT helps create a level playing field between different asset classes by subjecting commodity trading to similar taxation as equity trading, where STT is applicable.
- Regulatory Oversight: CTT also serves as a regulatory tool, enabling authorities to monitor and regulate commodities transactions more effectively.
Impact of CTT on Traders and Investors
The imposition of CTT has several implications for traders and investors active in commodity markets:
- Cost of Transactions: CTT adds to the overall cost of trading in commodities, as traders are required to pay the tax on every transaction executed on the exchange.
- Impact on Trading Volumes: The introduction of CTT may have an impact on trading volumes in commodity markets, as it could discourage high-frequency traders and speculators from participating in the market.
- Risk Management: Traders and investors need to factor in the impact of CTT when creating their trading strategies and risk management plans. The tax can influence decision-making regarding position sizing, trading frequency, and holding periods.
- Market Liquidity: CTT may affect market liquidity in commodity markets, as it could lead to reduced trading activity and narrower bid-ask spreads.
- Compliance Requirements: Market participants need to ensure compliance with CTT regulations and reporting requirements to avoid penalties and legal repercussions.
Challenges and Criticisms of CTT
While CTT serves certain objectives, it has also faced criticism and challenges:
- Impact on Market Efficiency: Critics argue that CTT may hamper market efficiency by reducing liquidity and increasing transaction costs, especially for small investors and hedgers.
- Competitive Disadvantage: Some stakeholders believe that the imposition of CTT puts Indian commodity exchanges at a competitive disadvantage compared to global counterparts where similar taxes are not levied.
- Need for Review: There have been calls for a review of CTT rates and structures to ensure that they strike the right balance between revenue generation and market development.
Conclusion
In conclusion, Commodity Transaction Tax (CTT) is a tax levied on transactions conducted on commodity exchanges in India. It serves various purposes, including revenue generation, discouraging speculative trading, and promoting regulatory oversight. While CTT has implications for traders and investors in commodity markets, it also faces challenges and criticisms regarding its impact on market efficiency and competitiveness. As the commodities market continues to evolve, it remains essential for policymakers to review and adapt CTT regulations to ensure a balance between revenue objectives and market development goals.
Start Investing Today!

Trend Analysis in Share Market for Better Stock Picks
Spotting the Trend: How Trend Analysis Can Help You Pick Winning Stocks
The stock market can feel like a wild ride sometimes, with prices constantly going up and down. But what if you could predict these ups and downs, at least a little bit? Well, that's where trend analysis comes in!
What is Trend Analysis?
Trend analysis is like looking at the flow of the water. Is it uptrend? Is it sideways trend? Or is it downtrend?
By analyzing past price movements and trading volume, trend analysis helps you understand the overall direction of a stock's price. It is a technique used to examine data points over time to identify patterns and predict future movements.
Here's a breakdown of the key ideas:
- Data Points: This could be anything from stock prices to website traffic, depending on what you're analyzing.
- Patterns: By looking at past data points, you can see if there are any recurring trends, like prices going up and down in a specific cycle.
- Predictions: Based on the identified patterns, you can make an educated guess about what might happen in the future.
Types of Trends
There are three main types of trends in the stock market:
- Upward Trend (Bull Market Trend): Prices are generally moving higher over time. This is a good sign for investors looking to buy stocks.
- Downward Trend (Bear Market Trend): Prices are generally moving lower over time. This can be a time to be cautious or even sell some stocks.
- Sideways Trend: Prices are fluctuating within a certain range. This can be a time to wait and see before making a move.
How to Use Trend Analysis
There are many types of trend analysis tools and techniques, but here are two simple ways to get started:
- Moving Averages: This is a line on a stock chart that shows the average price over a certain period (like 50 days or 200 days). An upward sloping moving average suggests an uptrend, while a downward sloping suggests a downtrend.
Picture a line on a stock chart that shows the average price of a stock over a certain period, like the past 50 days or 200 days. If this line is going up, it means the average price is rising, suggesting the stock is on an uptrend. For example, if a stock's 50-day moving average is slowly increasing and is currently at ₹100, while the current price is ₹110, it indicates an uptrend. On the other hand, if the moving average is sloping downward and is at ₹100, while the current price is ₹90, it signals a downtrend.
- Support and Resistance Levels: These are price levels where the stock price has historically found difficulty breaking through. Support levels are areas where the price tends to bounce back up, while resistance levels are areas where the price tends to get rejected and fall back down. Imagine certain price points where a stock tends to bounce back up after falling (support) or struggles to break through and falls back down (resistance).
Let’s say a stock has a support level at ₹120. Whenever the price drops to ₹120, it tends to bounce back up because investors see it as a good buying opportunity. Similarly, if there's a resistance level at ₹150, whenever the price approaches ₹150, it struggles to go higher as investors start selling their shares, causing the price to fall back down.
How to Use Trends to Pick Stocks
Here's how you can use trend analysis to pick better stocks:
- Spot the Trend: First, find out if a stock is on the rise (uptrend) or falling (downtrend). That tells us if it's a good time to buy or sell.
- Double-Check: Use different tools to make sure you're seeing the trend right.
- Time Your Moves: Wait for the right moment to buy or sell.
- Stay Safe: Always have a plan to protect your money. Use stop-loss and take that much risk what you can afford to lose.
Trend analysis can be a powerful tool for stock pickers, but it's important to use it alongside other investment strategies. By understanding trends, you can increase your chances of making profitable investments.
Conclusion
Trend analysis is a valuable tool for identifying stock market movements and making informed investment decisions. By analyzing patterns, using moving averages, and identifying support and resistance levels, investors can spot potential opportunities. However, it should be combined with other strategies and risk management techniques for better results. Understanding trends can enhance decision-making and improve the chances of picking winning stocks.
Learn more about financial terminologies with Swastika!

Understanding the Different Types of Brokers in the Stock Market
Stock market investing can be a great way to grow your wealth, but it can also seem complicated, especially for beginners. One of the first decisions you'll need to make is who will help you navigate this exciting world: a full-service broker or a discount broker? Today, we'll be exploring the types of brokers you can choose when entering the exciting world of stock trading.
What is a Stock Broker?
Before we dive into the different types of stockbrokers, let's first understand what a stock broker actually does. A stockbroker is a professional who helps in the buying and selling of stocks and other securities on behalf of investors. They act as intermediaries between buyers and sellers in the stock market. Share market investment advisors and registered representatives (RRs) are other names for stockbrokers.
Types of Stock Brokers:
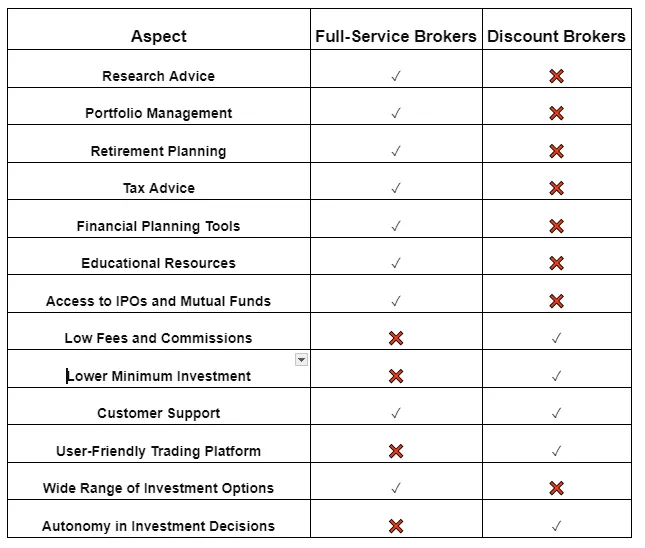
- Full-Service Brokers: Picture them as your financial advisors, offering complete services to guide you through the complex world of investing. Here's what you can expect:
- Personalized Advice: Full-service brokers provide customized investment advice based on your financial goals, risk tolerance, and market conditions.
- Diverse Investment Options: Full-service brokers provides a wide range of investment options, including stocks, bonds, mutual funds, and more.
- Research Reports: They offer in-depth research reports and market analysis to help you make better investment and stock trading decisions.
- Portfolio Management: Many full-service brokers offer portfolio management services, where they actively manage your investments on your behalf.
- Complete Financial Planning: Beyond just buying stocks, full-service brokers offers complete financial planning services, covering areas like retirement planning, tax optimization, and estate planning.
- Additional Services: From retirement planning to tax advice, full-service brokers go the extra mile to meet all your financial needs.
- Examples of full-service brokers in India include Swastika Investmart, ICICI Direct, HDFC Securities, and Kotak Securities.
- Discount Brokers: A discount broker or online stockbrokers would typically just buy and sell on behalf of their clients.
- Cost-Effective Trading: Discount brokers take lower fees and commissions compared to their full-service brokers, making them an attractive option for investors for more affordable trading.
- User-Friendly Trading Platforms: Discount brokers provide simple and user-friendly trading platforms with features for executing trades efficiently.
- Independent Investing: With a discount broker, you have full control over your investment decisions. Whether you're buying stocks, ETFs, or options, you have the complete independence to execute trades according to your investment strategy and market analysis.
- Minimal Account Maintenance Requirements: Discount brokers often have lower minimum account balance requirements, making them affordable to a broader range of investors.
- Limited Customer Support: While discount brokers may offer basic customer support services, they generally provide less personalized assistance compared to full-service brokers. Examples of discount brokers in India include Tradingo, Zerodha, Upstox, and 5paisa.
Comparison of Different Types of Brokers: Let's compare the key features of full-service, discount, and online brokers in the table below:
Conclusion:
Choosing the right type of broker is an important decision for any investor. Whether you prefer personalized advice and portfolio management or are comfortable making your own investment decisions, there's a broker out there to suit your needs. We hope this guide has helped understand the types of stock market brokers.
Learn more about Stock Market!

Put Call Ratio (PCR): Definition, Formula, and Significance
Introduction to Put Call Ratio (PCR)
Among the many tools and indicators used by investors and traders, one of the indicators to understand is the Put Call Ratio (PCR). The Put-Call Ratio (PCR) is a popular tool to know the market sentiment!
Understanding PCR
Let’s understand this in the simplest way possible. Think of the stock market as a tug-of-war between investors who think prices will go up (bullish) and those who think the prices will go down (bearish). Stock options, which give you the right to buy (call) or sell (put) a stock at a predetermined price at a predetermined date, can reveal these beliefs. The PCR uses options to understand which side is pulling harder!
Before diving into the Put Call Ratio itself, it's essential to understand the basics of call and put options, and Market sentiment?
Call options give the holder the right, but not the obligation, to buy an asset at a specified price within a predetermined time frame. On the other hand, put options give the holder the right, but not the obligation, to sell an asset at a specified price within a predetermined time frame.
Market sentiment is the feeling of most investors at a particular time. It indicates whether they're feeling positive (bullish) or negative (bearish) about the market in general or a specific stock.
- Bullish Sentiment: Investors are feeling confident and expect prices to rise.
- Bearish Sentiment: Investors are feeling cautious and expect prices to fall.
So The Put Call Ratio (PCR) is a measure of market sentiment derived from the ratio of the trading volume of put options to call options.
Formula for Calculating PCR
The PCR is calculated using a simple formula:
PCR = Put Volume / Call Volume
Put Volume and Call Volume refer to the number of put and call option contracts traded in a day.
Example: Let's say on a particular day, 100 put contracts and 50 call contracts are traded for a stock. Here's how to find the PCR:
PCR = 100 (Put Volume) / 50 (Call Volume) = 2
A PCR of 2 suggests a bearish sentiment as more investors are buying puts, indicating a price drop.
Significance of PCR
The Put Call Ratio plays a significant role in market sentiment analysis. A high PCR value suggests that investors are bearish, indicating a potential downtrend in the market. While a low PCR value suggests that investors are bullish, indicating a potential uptrend. Ideal PCR is between 0.80-1.20.
In more simple language, A PCR value greater than 1 indicates a bearish sentiment, as there are more put options being traded in comparison to call options. A PCR value less than 1 indicates a bullish sentiment, as there are more call options being traded in comparison to put options.
Understanding PCR and its relation with market sentiment Practical Examples
Positive PCR (Bearish Sentiment):
Imagine a scenario where investors are feeling nervous about a stock, say ABC Ltd. They anticipate the price to go down. Here's how PCR reflects this:
Example:
- Put Volume: 200 contracts (Investors are actively buying puts)
- Call Volume: 100 contracts (Investors are hesitant to buy calls)
- PCR = Put Volume / Call Volume = 200 / 100 = 2
A PCR of 2 indicates a negative PCR, meaning there are more puts than calls. This suggests a bearish sentiment. Investors are betting on the price to fall by buying more put options.
Negative PCR (Bullish Sentiment):
Now, let's imagine a different scenario where investors are optimistic about XYZ Ltd. They expect the price to increase. Here's how PCR reflects this:
Example:
- Put Volume: 50 contracts (Investors are less interested in puts)
- Call Volume: 150 contracts (Investors are actively buying calls)
- PCR = Put Volume / Call Volume = 50 / 150 = (1 / 3)
A PCR of (1 / 3) is a positive PCR, meaning there are more calls than puts. This suggests a bullish sentiment. Investors are looking to profit from a price rise by buying more call options.
Neutral PCR:
Sometimes, investors might be unsure about the direction of the stock price. This creates a balanced market sentiment.
Example:
Put Volume: 75 contracts
Call Volume: 75 contracts
PCR = Put Volume / Call Volume = 75 / 75 = 1
A PCR of 1 is considered neutral. Put and call volumes are equal, indicating a balanced market sentiment where investors are neither overly bullish nor bearish.
Where to Find PCR Data:
Many financial websites and trading platforms offer live and historical PCR data. You can also find specific PCRs like the Nifty 50 PCR (for the top 50 Indian stocks) or the Bank Nifty PCR (for banking stocks). Additionally, some platforms provide PCR data for individual stocks.
Conclusion:
The Put-Call Ratio (PCR) is a valuable tool to understand investor sentiment in the stock market. By analyzing the PCR along with other factors, you can gain insights into market psychology.
Learn more about financial terminologies with Swastika!

What is Brokerage? | Meaning, Types, & More
The Indian stock market is a big marketplace where people buy and sell shares of ownership in companies, similar to a stock market anywhere else in the world. Here's a quick breakdown:
- Companies Sell Shares: Companies can raise money by selling small pieces of ownership, called shares or stocks, to the public. This is a way for them to get funding for growth.
- Investors Buy Shares: People who buy these shares become part-owners of the company. They hope that the company will do well, and the value of their shares will increase. They can then sell their shares at a profit later.
- The Stock Exchange: This is where the buying and selling of shares takes place electronically. The Bombay Stock Exchange (BSE) and the National Stock Exchange of India (NSE) are the two main stock exchanges in India.
- Brokers Help You Trade: You can't directly buy and sell shares on the stock exchange. You need a brokerage firm, like a middleman, to handle the transactions for you.
What is a Brokerage in the Stock Market?
A brokerage in the stock market is like a middleman that helps you buy and sell stocks. They are companies or individuals authorized to buy and sell stocks on behalf of investors. The stock brokerage company that facilitates your share purchases and sales levies a fee for its services. The term "brokerage" refers to this charge.
Example of a Brokerage:
Let's say you want to buy shares of a company like TCS. You don't go directly to the stock exchange to buy them yourself. Instead, you open an demat account with a brokerage firm like Swastika Investmart. Through their online platform or app, you place an order to buy TCS shares. The brokerage then carries out the transaction for you, and the shares are added to your account.
There are currently four methods available to stock brokers in India for charging brokerage fees. Let's examine each of them individually.
- Flat fee for every trade: As the name implies, there is a flat price associated with each deal you make in this mode. As a result, the brokerage you must pay is the same regardless of the transacted value. But there's a catch: the investor will only be charged the lower sum if the percentage brokerage is lower.
- Brokerage as a percentage of the traded value: A portion of the entire trade value is charged as brokerage by stock brokers. Put simply, a trade's worth will determine how much the brokerage is going to be, and vice versa.
- Monthly trading plans: A few stock brokers now provide monthly trading plans that let you make an infinite amount of trades in a given month, regardless of how much each trade is worth. They also demand a monthly or annual subscription fee in exchange.
- Zero brokerage: Numerous discount broking businesses do not charge a brokerage fee for the transactions.
How to Choose the Perfect Broker in India
The Indian stock market offers exciting opportunities, but choosing the right brokerage firm can feel difficult.
- Reputation and Reviews: Trust is key! Look for firms with a strong track record and satisfied customers.
- Reviews: User reviews on financial websites and forums offer valuable insights from real people. Read both positive and negative comments to get a well-rounded picture.
- Registrations: Ensure the firm is registered with SEBI (Securities and Exchange Board of India), the regulatory body. Their website should display membership codes for stock exchanges like NSE (National Stock Exchange) or BSE (Bombay Stock Exchange).
- Reputation: Established firms with a long history and satisfied clients are often a safe bet.
- Services: Consider your investment style and experience level when choosing between service models:
- Full-service brokers: Ideal for beginners. They offer personalized advice, research reports, and educational resources, but charge higher fees. (commissions).
- Discount brokers: Perfect for experienced investors who prioritize low costs. They focus on trade execution with minimal fees.
- Fees (Brokerage Charges): Understand fee structures, including commissions, account minimums, and any hidden charges. Full-service brokers might offer bundled services at a higher cost, while discount brokers have lower fees but fewer services.
- Trading Platform: Check the user-friendliness and features of the platform. Look for ease of navigation, real-time market data, and charting tools to support your investment decisions.
- Customer Support:
- Multiple Channels: Check whether they offer phone, email, and live chat options for assistance.
- Prompt Response: Look for firms known for resolving issues.
- Transparency is Key: No Hidden Costs.
Before opening an account, have a detailed discussion with the brokerage representatives. Ensure a clear understanding of all charges involved in the transaction
By understanding these costs upfront, you can avoid surprises and make better decisions about your investment.
Conclusion
Brokerage plays a crucial role in the stock market by facilitating the buying and selling of shares for investors. It serves as a middleman and charges fees for its services, which can be structured as flat fees, percentage-based commissions, monthly trading plans, or zero brokerage models. Choosing the right broker requires evaluating reputation, SEBI registration, fees, trading platforms, and customer support. By understanding these factors, investors can select a brokerage that aligns with their needs, ensuring a seamless and cost-effective trading experience.
Start Investing Today!
.webp)
What is the Securities Transaction Tax (STT)?
Introduction:
The world of finance can be confusing, especially when it comes to terms like Securities Transaction Tax (STT). But don't worry! This blog will make STT simple. Let's explore what it is, how it works, why it's there, and what it means for you as an investor.
What is STT?
STT is a tax imposed by the government on the buying and selling of securities like stocks, derivatives, and certain mutual funds. Whenever you make a transaction in the stock market, a small percentage of the transaction value is collected as STT. The tax is levied at a predetermined rate, expressed as a percentage of the transaction value, and is applicable to both the buyer and the seller.
How Does STT Work?
STT operates as a transaction-based tax, meaning it is triggered with every buy or sell order executed in the market. The tax rate varies based on the type of security being traded and the nature of the transaction—whether it involves delivery (holding securities beyond a specified period) or intraday trading (buying and selling within the same trading day). For instance, equity delivery trades typically attract a different STT rate compared to intraday trades. In other words STT is calculated based on the type of security you're trading and whether it's a buy or sell transaction. The rates may vary, but the idea remains the same: a little slice of your transaction goes to the government.
Why Does STT Exist?
The primary goal of STT is twofold. Firstly, it's a way for the government to collect revenue. Secondly, it acts as a measure to regulate the stock market. By imposing a tax on transactions, especially on short-term trades, it aims to discourage excessive speculation and promote more stable, long-term investments.
The introduction of STT serves several purposes, primarily driven by governmental and regulatory objectives:
- Revenue Generation: STT serves as a crucial source of revenue for the government. By taxing transactions within the securities market, the government can accumulate funds to support various developmental initiatives, infrastructure projects, and welfare programs.
- Regulatory Measure: Beyond revenue generation, STT acts as a regulatory tool aimed at shaping market behavior and fostering stability. By imposing a tax on transactions, particularly on short-term trades, STT discourages speculative activities and promotes a more disciplined, long-term approach to investing.
Impact on Investors:
For investors, STT adds a small cost to each transaction. While it may seem like pennies at a time, it can add up, especially for frequent traders. However, it's also a transparent tax, clearly stated on your transaction records, making it easy to keep track of.
For investors participating in the securities market, STT carries both direct and indirect implications:
- Cost Consideration: STT adds to the overall cost of trading for investors. While the tax rates are relatively modest, even small percentages can accumulate, especially for frequent traders engaged in high-volume transactions.
- Transparency: Unlike some other charges and fees associated with stock market transactions, STT offers transparency. It is explicitly disclosed in transaction statements provided by brokerage firms, allowing investors to accurately track and account for their tax liabilities.
- Behavioral Influence: STT plays a pivotal role in shaping investor behavior. By making short-term trades comparatively more expensive, STT incentivizes investors to adopt a more strategic, long-term perspective. This shift towards long-term investing not only aligns with wealth accumulation goals but also contributes to market stability and resilience.
Conclusion:
STT may sound intimidating at first, but it's simply a tax on stock market transactions. It serves the dual purpose of revenue generation for the government and regulating market behavior. So, the next time you see STT mentioned, just remember: it's a small fee for playing in the stock market sandbox.
Learn More about financial terminologies with Swastika !


.webp)
.webp)

.webp)


START YOUR INVESTMENT JOURNEY
Get personalized advice from our experts
- Dedicated RM Support
- Smooth and Fast Trading App
