
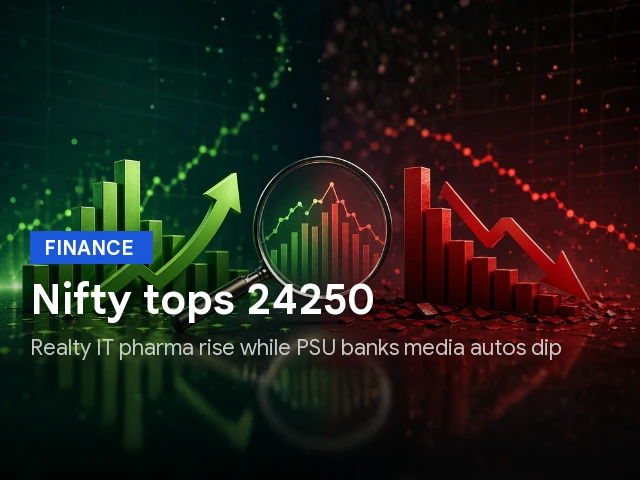
Nifty Share Price And Market Pulse: Key Movers, IPO Watch, And Real Estate Leads


Key Takeaways
- Nifty share price closed at 24,270.85, up 95.15 points (0.39%).
- Sensex rose to 77,763.91, up 261.79 points (0.34%), with breadth positive across large caps.
- Nifty Realty index jumped 2.19% to 890.80, led by Lodha Developers up 5.08% among realty movers.
- Knack Packaging IPO subscribed 57.46x with price band 161-170 and a minimum lot of 88 shares.
nifty share price momentum continued as barometers extended their winning streak to a third session. The nifty share price at the close was 24,270.85 for the Nifty 50, up 95.15 points or 0.39%, while the Sensex rose 261.79 points to 77,763.91, a gain of 0.34%. Over three sessions, the Sensex has gained 1.68% and the Nifty 1.69%, signaling improving risk appetite despite intraday volatility. The India VIX slid 3.98% to 11.80, signaling a softer near-term volatility environment. In the broader market, the BSE 150 MidCap Index fell 0.25% while the BSE 250 SmallCap Index rose 0.09%, painting a nuanced view of market breadth.
Nifty Share Price Movements: Above 24,250 As Three-Session Rally Continues
Realty, IT, and pharma stocks led the advance as the Nifty Realty index climbed 2.19% to 890.80, continuing a four-session run with an 8.78% gain across the period. Real estate movers included lodging a broad rally: Lodha Developers up 5.08%, Oberoi Realty up 3.45%, Anant Raj up 3.37%, Brigade Enterprises up 3.32%, DLF up 2.73%, Phoenix Mills up 1.95%, Godrej Properties up 1.24%, and Sobha up 0.72%. On the downside, Aditya Birla Real Estate fell 1.06% and Prestige Estates Projects fell 0.27%. These moves underscore a bias toward real estate plays on improving sentiment and funding activity.
Knack Packaging IPO Watch: Subscription Rate And Price Band
The Knack Packaging IPO opened on 01 July 2026 and closed on 03 July 2026. The issue was priced in a band of Rs 161-170 per share and allowed bids for a minimum of 88 equity shares and multiples thereof. Bids received stood at 1,08,97,61,376 against 1,89,64,018 on offer, resulting in a subscription of 57.46 times. This level of oversubscription indicates strong investor interest in the packaging niche and reflects anticipation of solid growth in end-use industries.
Lodha Developers Stock And Real Estate Movers: A Day Of Gains
The real estate space consolidated gains with Lodha Developers stock up 5.08%, contributing to the sector's broader strength. Oberoi Realty rose 3.45%, Anant Raj 3.37%, Brigade Enterprises 3.32%, DLF 2.73%, Phoenix Mills 1.95%, Godrej Properties 1.24%, and Sobha 0.72%–all adding to a positive tone for realty leadership. Meanwhile, Aditya Birla Real Estate declined by 1.06% and Prestige Estates Projects by 0.27%, underscoring that sector rotation included both winners and laggards in a high-beta space.
HCL Technologies Stock Price Action And AI Transformation Deal
The hcl technologies stock surged 5.80% after the company announced an agreement with a Europe-headquartered Fortune Global 50 Firm to transform their global digital workplace and enterprise networks using Artificial Intelligence. This move signals a widening adoption of AI-led modernization in enterprise IT infrastructure, potentially creating spillover benefits across tech services and related software ecosystems. The broader tech space remained responsive to AI-related news as large-cap software names displayed strength in today’s session.
Global Cues And Market Signals: US Jobs Data, PMI Readings, And Brent Crude
Global markets reflected a mixed but cautiously optimistic mood: most European indices traded lower, while Asian markets closed higher as weaker-than-expected US jobs data stoked expectations of a future Federal Reserve rate cut. Japan's services PMI rose to 52.2 in June from 50.0 in May, indicating renewed expansion, while China's services activity remained above the 50-mark with a PMI of 54.1. In the US, the Dow Jones Industrial Average climbed to a record close of 52,900.07 as 57,000 jobs were added in June, below May’s revised 129,000 and below expectations of 110,000; the S&P 500 rose slightly to 7,483.24 and the Nasdaq fell 0.8% to 25,832.67. The Independence Day holiday kept major exchanges closed in the US on this Friday, resuming normal trade on Monday.
Rupee And Commodities Snapshot: USDINR, Brent Crude
The partially convertible rupee hovered around 95.2100 per dollar, versus 95.3550 in the previous session, while Brent crude for Sep 2026 settlement gained 0.24% to $71.97 a barrel, contributing to the energy complex’s mixed but bounded volatility as global demand signals evolved.
Corporate And Market Depth: Key Corporate Moves And Broad Indicators
On the corporate front, Maharashtra Seamless rose 0.77%, and Zydus Lifesciences gained 3.63% after signing a MoU with Apollo Hospitals to introduce Shield, a Multi-Cancer Detection test available in India. Central Bank of India rose 0.68% after reporting YoY growth in global gross advances to Rs 3,54,895 crore as of 30 June 2026, up from Rs 2,75,595 crore as of 30 June 2025. PC Jeweller rallied 3.74% following a ~21% YoY revenue uptick for the quarter ended 30 June 2026. Mahindra & Mahindra Financial Services slipped 1.21% as disbursements were guided to about Rs 15,560 crore with YoY growth around 21% (excluding finance lease). Bajaj Finance gained 1.30% after new loans booked rose 20% YoY to 1.61 crore in Q1 FY27, compared with 1.35 crore in the corresponding quarter last year.
In the broader market, the Dow’s performance was notable with a 594.83-point rise to 52,900.07, a record, while the S&P 500 traded near 7,483 and the Nasdaq hovered around 25,833. The day’s market breadth showed a positive tilt as 2,264 shares rose and 1,975 fell on the BSE, with 206 unchanged, underscoring selective leadership amid broader consolidation. First Published: Jul 03 2026 | 4:16 PM IST.
Frequently Asked Questions
What was the Nifty share price close today and the Sensex level?
The Nifty 50 closed at 24,270.85, up 95.15 points (0.39%), while the Sensex settled at 77,763.91, up 261.79 points (0.34%).
Which sectors led the market today and what was the Nifty Realty index movement?
Realty, IT and pharma shares advanced, with the Nifty Realty index climbing 2.19% to 890.80, contributing to a four-session gain of 8.78%.
How did Knack Packaging perform as an IPO, including subscription rate and price band?
Knack Packaging IPO opened on 01 July 2026 and closed on 03 July 2026, with a price band of Rs 161-170. It was subscribed 57.46 times, with bids of 1,08,97,61,376 against 1,89,64,018 on offer; minimum lot is 88 shares.
What moved HCL Technologies stock today and what deal influenced it?
HCL Technologies stock rose 5.80% after announcing an AI-driven transformation deal with a Europe-headquartered Fortune Global 50 Firm to upgrade their digital workplace and enterprise networks.
What were the key US and global cues affecting markets today?
US job data showed 57,000 jobs added in June, with May revised to 129,000 and expectations around 110,000. The Dow rose to a record close of 52,900.07, while the S&P 500 and Nasdaq were around 7,483 and 25,833 respectively; markets also noted softer near-term volatility as India VIX fell 3.98% to 11.80.
Conclusion
For the retail investor, today’s session reinforces that resilient breadth and sector leadership can coexist with modest volatility, especially as realty, IT, and select pharma names outperformed. The next step is to build a framework that combines price action with fundamental signals from corporate news and macro data: use trend-following rules for broad exposures and selective, risk-managed bets on realty names or tech leaders showing AI-driven order books. To dive deeper into stock-level analysis and tailor ideas to your portfolio, consider Swastika’s Sarthi AI stock assistant, which can help translate today’s price moves into actionable ideas and risk controls: Swastika's Sarthi AI stock assistant.
As you digest these moves, keep a ready watchlist on the nifty share price level around 24,250 to 24,500 and monitor the Nifty Realty, IT, and pharma segments for continued leadership. Use the current data as a baseline to assess how fresh IPO activity, like Knack Packaging’s robust subscription, and AI-driven corporate strategies might shape risk and return in the weeks ahead. The interplay between domestic strength and global cues will likely keep the market range-bound with selective bursts of upside, making disciplined position sizing and scenario planning essential for retail investors.
Latest Articles
Accenture Caution, Long-Term IT Opportunity for Investors


Key Takeaways
- Accenture signals caution in the near term; the long-term IT growth story persists.
- Cloud, AI, and digital transformation remain core drivers of IT demand.
- Indian IT stocks may show short-term volatility but offer multi-year upside.
- Adopt a horizon-focused approach and consider AI-enabled tools like Sarthi for stock ideas.
Opening hook: When a global IT bellwether signals caution, retail investors in India ask: Is this a pause or a turning point for the IT services space? The tension is real: near-term softness vs. a multi-year expansion driven by AI, cloud, and digital transformation. In this context, a measured, long-horizon approach can help you navigate volatility while keeping sight of the structural growth in the Indian IT ecosystem.
What does Accenture's cautious guidance mean for Indian IT stocks in 2024?
The near-term signal is cautionary, hinting at slower project pipelines and potential margin pressure as the macro environment weighs on client budgets. Still, the long-run thesis remains intact: enterprises continue to accelerate cloud migrations, invest in AI-enabled capabilities, and undertake digital transformations that lift efficiency and competitiveness. For Indian investors, the story isn't about a quick rebound but a sustained growth path supported by global demand for IT services, with Indian players serving as a resilient and cost-competitive delivery engine.
Key takeaways to watch include the trajectory of cloud-related services, AI-enabled analytics, and cybersecurity demand, as well as any changes in client mix and deal sizes. The caution should be read as a discipline in prioritization rather than a sign of secular decline. For deeper, stock-level insights, Swastika Investmart offers research reports and tools that translate global trends into actionable ideas for Indian portfolios.
Note: all figures referenced in this discussion are derived from primary sources including company filings and major market watchers, and price data is treated as plain market facts.
How near-term cautions at a global IT bellwether contrast with long-term IT demand drivers like cloud and AI
Near-term cautions often reflect softer project execution cycles, seasonality, and macro-driven budget adjustments. Yet the long-term IT demand environment remains robust due to persistent cloud adoption, the expansion of AI workloads, and the ongoing need for digital transformation across industries. This creates a multi-year runway for revenue growth, with rising demand for managed services, cloud migration, data analytics, and security. The paradox for investors is clear: volatility in quarterly numbers can coexist with a sustained secular uptrend in IT services and digital engineering, supported by open-source acceleration, hyperscale platforms, and enterprise cloud modernization.
From an India-centric perspective, the value proposition for retail investors lies in exposure to large-scale services integrators and mid-cap players that have strong client relationships and regional delivery capabilities. While near-term results may be choppy, the operating model–high utilization, recurring revenue through managed services, and scale–remains a source of resilience.
Which Indian IT companies could benefit from Accenture's AI-led transformation
India's IT landscape features a mix of large, diversified players and nimble specialist firms. The AI-led transformation underpins demand for cloud services, platform engineering, data analytics, and intelligent automation. Large, cash-generative exporters with global footprints can benefit from scale advantages and diversified client rosters, while mid-cap peers with strong domain expertise can capture rising demand for niche AI-enabled solutions. Look for firms with strong partnerships in hyperscale ecosystems, integrated delivery models, and a proven track record in complex digital programs. The alignment with AI and cloud adoption will influence which names outperform over multi-year horizons.
Risk and strategy for retail investors evaluating IT services exposure
Take a disciplined, multi-year approach to IT exposure. Short-term headlines can bounce, but the core demand drivers–cloud modernization, AI integration, cybersecurity, and data analytics–are secular. Diversify across a core holding of large, proven IT services players and select high-quality mid-caps with strong AI capabilities, and manage risk with disciplined rebalancing and position sizing. In practice, build a watchlist of 6–10 names, assign thematic weight to AI-dominant franchises, and adjust your exposure as the macro environment evolves.
As you evaluate opportunities, consider using Sarthi – an AI stock assistant that provides institutional-grade research on stocks and indices for retail investors. This tool can help you translate big-picture themes into concrete stock ideas that fit your risk profile.
FAQ
What does Accenture's caution mean for Indian IT stock investors?
Near-term caution signals potential volatility in quarterly results, but the long-term demand drivers for IT services—cloud adoption, AI-enabled transformation, and digital modernization—remain intact, offering multi-year upside for select Indian IT players.
Which IT demand drivers should investors watch for in the coming years?
Key drivers include cloud migration, AI-enabled analytics and automation, cybersecurity, and data management. These areas are expected to sustain IT services growth beyond near-term macro headwinds.
Which Indian IT companies could benefit from AI-led transformation?
Large, diversified IT services players with global delivery footprints and strong AI partnerships, as well as high-quality mid-caps with domain expertise in AI-enabled solutions, could benefit from AI-driven demand. Look for firms with diversified client bases and scalable AI offerings.
What investment approach best suits IT exposure in a cautious near-term environment?
Adopt a horizon-focused, diversified approach: maintain core exposures to cash-generative IT leaders while selectively adding high-quality mid-cap names with AI capabilities, and manage risk with disciplined rebalancing and position sizing.
How can Swastika Investmart help retail investors with IT stock research?
Swastika offers research reports, stock screening, and Sarthi — an AI stock assistant that delivers institutional-grade research on stocks or indices to help retail investors make data-driven decisions.
Conclusion
In the near term, investors should brace for volatility as the market digests cautious commentary from a global IT bellwether. Yet the longer-term IT growth runway remains intact, powered by AI, cloud, and digital transformation that continue to redefine enterprise value. The key takeaway for Indian retail investors is to adopt a horizon-first mindset: build a diversified slate of high-quality IT exposures, monitor AI and cloud adoption as the main growth engines, and avoid knee-jerk reactions to quarterly updates.

NSE IPO: Date, Valuation, Review & Complete Investor Guide
National Stock Exchange of India Limited (NSE) is the country's largest stock exchange and the operator of the core market infrastructure through which the vast majority of India's equity, derivatives, currency, and debt trades are executed. Through its subsidiaries, NSE also runs India's largest clearing corporation, manages the Nifty family of indices, and provides market data, analytics, and investor education services, which makes it a near-complete ecosystem for India's capital markets rather than a single-product business.
With its proposed IPO, investors will get an opportunity to own a stake in one of India's most profitable financial infrastructure businesses. However, the key question is not only "Will the NSE IPO generate listing gains?" but also: "Does NSE justify its expected premium valuation for long-term investors?"
In this guide, we take a closer look at NSE to help investors understand its business, significance in India's capital markets, and key factors that help them in evaluating the IPO opportunity.
NSE IPO Details
The key metrics and structural details of this landmark public issue are outlined in the table below. This core data is sourced directly from the official SEBI Initial Filings.
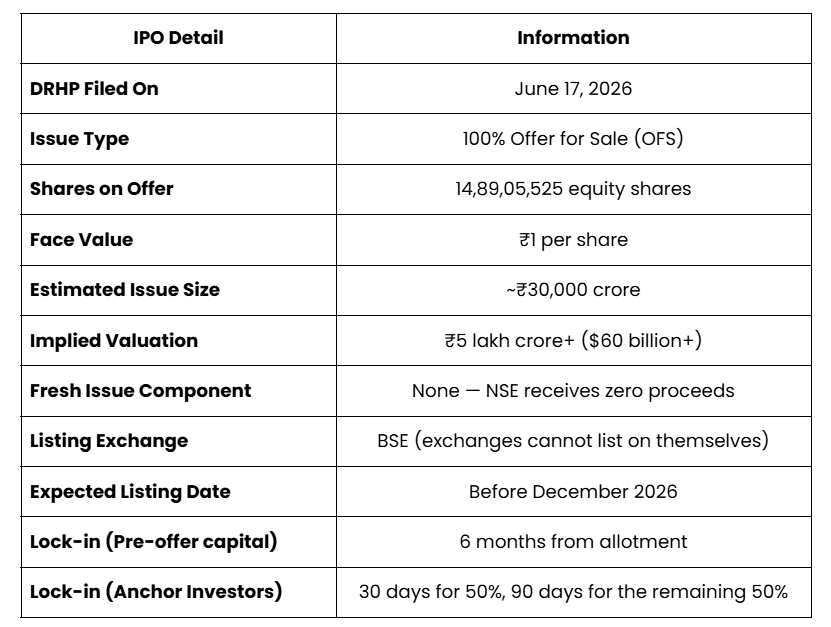
A quick explanation of two terms in this table that often confuse first-time investors. A DRHP, or Draft Red Herring Prospectus, is the detailed document a company files with SEBI before an IPO. It contains the company's financials, business details, and risks, and it is the starting point of the entire IPO process. An Offer for Sale, or OFS, simply means existing shareholders are selling their shares to the public, rather than the company printing brand new shares. NSE's entire IPO is structured this way.
The scale of this offer is why it is already being called the biggest IPO in Indian history. At an estimated ₹30,000 crore, it would be larger than Hyundai Motor India's 2024 IPO, which currently holds the record.
Structure of the IPO (Offer for Sale)
Because this is a pure Offer for Sale, the structure is simpler than most IPOs, there's no fundraising objective to evaluate:
- The entire issue consists of existing shareholders selling their shares to the public.
- NSE itself will not receive any proceeds from this offer.
- No portion of the issue will be used for capital expenditure, debt repayment, or working capital, since none is being raised by the company.
- The IPO's sole purpose is to provide an exit route for long-term institutional shareholders and to meet public shareholding norms for a Market Infrastructure Institution (MII).
Key Selling Shareholders of NSE Stocks
The breakdown below highlights the big institutional players selling their shares in this IPO, based on the latest data from Fortune India. The real story here isn’t just who is cashing out, but it’s about who is choosing to stay, which gives us a clear look at how much long-term confidence these massive investors have in NSE.
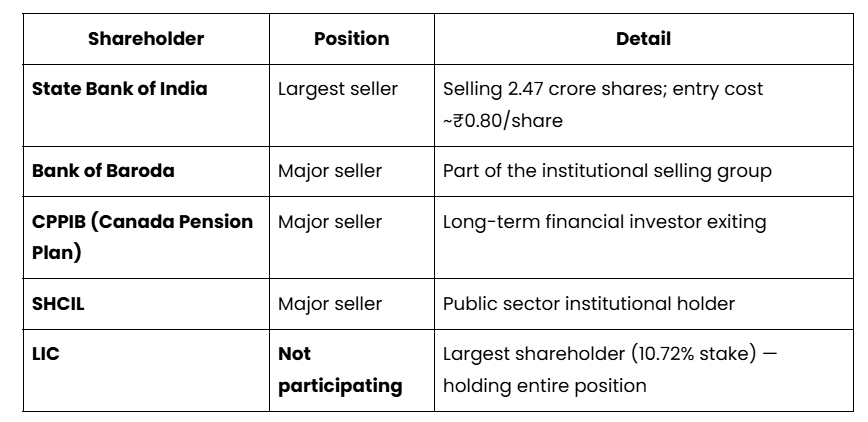
These names matter because of what their decisions reveal. SBI bought its NSE shares so long ago that it paid less than one rupee per share. If NSE lists anywhere close to the expected price of ₹2,000 per share, SBI's original investment could turn into a payout of nearly ₹5,000 crore. This single example shows how much value NSE has built up over the years for its earliest investors.
LIC's choice tells a different but equally important story. As the single biggest shareholder in NSE, LIC has decided not to sell even one share in this offer. When the investor who stands to gain the most from selling chooses to hold on instead, it is usually seen as a strong signal that they expect the company's value to keep growing well after listing.
NSE IPO - Company Profile
NSE operates as a parent to a wide financial ecosystem, not just a trading venue:
- NSE Clearing Ltd (NCL): India's largest clearing corporation, carrying a CARE AAA/Stable rating since 2008.
- NSE Indices Ltd: Manages the Nifty family of indices, tracked by 265 index funds and 230 ETFs as of March 2026.
- NSE Data & Analytics Ltd: Sells real-time and historical market data — a high-margin, recurring revenue stream.
- NAL Academy Ltd: Runs financial education and skill-development programs that help grow the long-term investor base.
- NSE Administration and Supervision Ltd (NASL): Supervises research analysts and investment advisers as part of NSE's regulatory mandate.
There is one more important thing to understand about NSE's structure. Under SEBI rules, NSE is officially recognised as a Market Infrastructure Institution, which means it is treated as a kind of first-level regulator for the market it runs. Because of this, at least half of its board members must be Public Interest Directors, people whose job is to protect investors rather than maximise profits for shareholders. This is unusual for a company that is also trying to be a profitable, publicly listed business.
NSE IPO - Market Position & Segment-wise Dominance
The breakdown below illustrates the National Stock Exchange’s massive market share and segment-wise dominance, according to official regulatory disclosures in the NSE DRHP. Rather than operating as a typical market participant, these figures reveal that NSE functions as the foundational backbone of India's financial infrastructure.
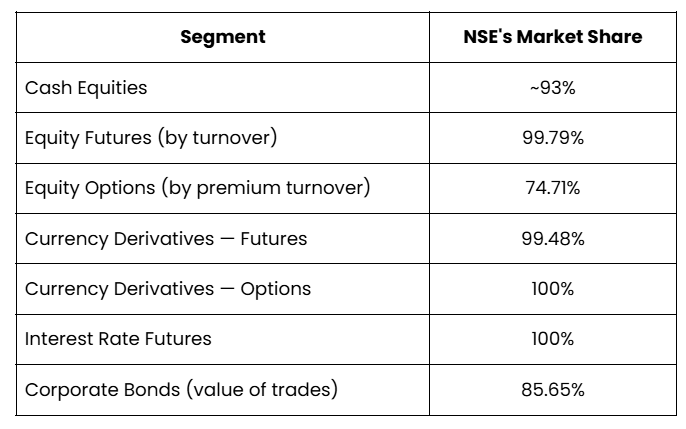
These numbers explain why investors often describe NSE as a near monopoly rather than just a market leader. In categories like currency options and interest rate futures, it effectively has no competition at all. This kind of dominance gives NSE strong pricing power and makes its income far more stable and predictable than most ordinary businesses, where competitors are constantly fighting for the same customers.
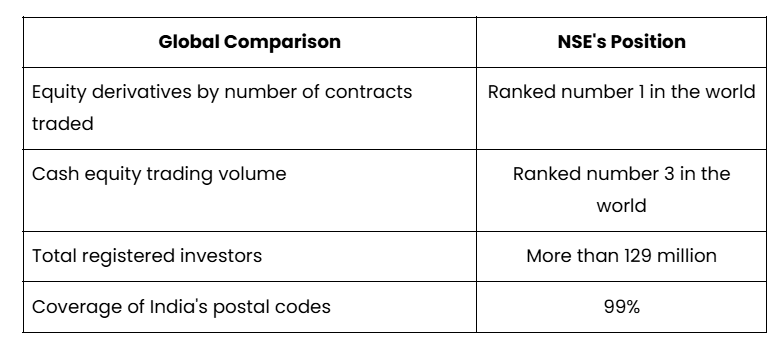
Additionally, NSE's size is not just an India story either. According to the World Federation of Exchanges, here is where it stands globally for the 2026 financial year.
NSE IPO - Competitive Strengths
Near Total Control Of The Market: As shown above, NSE dominates cash equities, derivatives, and currency trading, which makes its revenue unusually steady and predictable year after year.
A Business That Grows Without Growing Its Costs: Once NSE's trading systems are built, handling extra trades costs the company very little. This means that as trading activity increases, most of the additional money earned turns straight into profit instead of being spent on new expenses.
No Debt On The Books: NSE owes nothing to lenders and sits on a large amount of surplus cash, giving it the freedom to fund new projects on its own instead of borrowing money or asking shareholders for more capital.
Income From Many Different Sources: Beyond charging fees on trades, NSE earns money from clearing services, index licensing, data sales, and financial education, which means it does not depend too heavily on any single source of income.
A Customer Base That Is Hard To Copy: With a presence across 99% of India's postal codes and more than 129 million registered investors, NSE has built relationships and trust that would take a new competitor years, if not decades, to replicate.
A Quiet But Steady Income Stream: NSE earns interest by investing the security deposits that brokers are required to keep with it, along with its own cash reserves. This alone brought in ₹1,929 crore in the 2026 financial year, money that comes in even on days when very little trading happens.
NSE IPO - Key Concerns Investors Should Know Before Applying
Too Much Dependence On Options Trading: Around 60% of NSE's core income comes from fees on options trading alone. SEBI has already been tightening rules around retail trading in this segment to protect smaller investors from heavy losses. If these rules get stricter, it could directly hurt NSE's biggest source of income.
An Old Legal Issue Still Not Fully Resolved: Years ago, NSE faced allegations that some brokers were given unfair, faster access to its trading systems, an issue known as the co-location controversy. This is actually the reason NSE's IPO was delayed for nearly a decade. The company has filed for a settlement with SEBI and set aside a large provision for it, but the matter has not been fully closed yet.
A Conflict Built Into Its Own Structure: NSE is both a profit-seeking company and a market regulator at the same time. This means it sometimes has to choose between protecting fairness in the market and pushing for faster revenue growth, a balancing act that most ordinary listed companies never have to deal with.
Heavy Reliance On Technology Never Failing: NSE processes between 12 and 14 billion messages every single day, with peaks close to 22 billion. If its systems ever fail on a high-traffic day, it could lead to a trading halt, financial penalties from regulators, and a serious dent in investor trust.
Almost Entirely Dependent On India: Since NSE's business is tied almost completely to the Indian stock market, its fortunes rise and fall with India's economy and regulations, unlike global exchanges that spread their business across many countries.
According to Santosh Meena, Head of Research at Swastika Investmart, in an interview with Outlook Business, the National Stock Exchange's (NSE) IPO is structured entirely as a 100% Offer for Sale (OFS), meaning the exchange will receive zero proceeds as the funds go directly to selling shareholders like LIC and SBI. Meena noted that this structure reflects the exchange's immense financial strength, as it is already highly profitable and cash-rich, requiring no fresh capital for expansion. He advised investors to evaluate the company differently from a traditional growth IPO, treating it instead as an acquisition of secondary shares in a proven business, and cautioned them to carefully scrutinise its valuation, competitive moat, and long-term prospects.
NSE's Financial Performance (FY26)
The breakdown below highlights the National Stock Exchange’s core financial health and profitability metrics for the 2026 financial year, according to official disclosures in the NSE DRHP and a report by Outlook Business. Beyond the massive revenue numbers, these figures reveal an incredibly efficient business model that converts a remarkably high percentage of its income directly into pure profit.
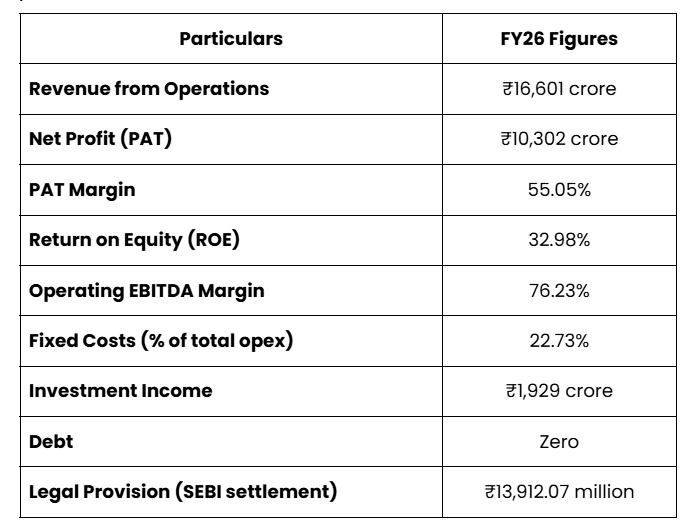
A couple of these figures deserve a closer look because the number alone does not tell the full story. The fact that only 22.73% of NSE's costs are fixed means most of its expenses do not rise much even when trading volumes go up sharply. This is exactly why the company is able to turn so much of its extra revenue into pure profit, which is reflected in that very high 76.23% operating margin. The ₹1,929 crore in interest income is also worth noting separately, since this money comes in from interest on cash and deposits, meaning NSE earns it even on slow trading days when fewer people are buying and selling shares.
Final Outlook - Is NSE Worth Considering?
NSE is the backbone of India's stock market, with industry-leading margins, zero debt, and near-total control over major trading segments. Its plans, spanning coal, gold, electricity, GIFT City, and index investing, add real growth potential on top of that. That said, the risks are still worth weighing. Around 60% of core income depends on options trading, a space regulators are watching closely, the old co-location legal matter isn't fully settled, and given the excitement around the ₹5 lakh crore valuation, the IPO may well be priced on the higher side, meaning much of the good news could already be baked into the price.
In short, NSE combines genuine strength with real risk. The sensible move is to wait for the final prospectus and price band before deciding, invest only as much as fits your own risk appetite, and make your investment decisions wisely, consulting your financial advisor where needed. For more IPO and market-related updates, visit Swastika Investmart.
-----------------------------------------------------------------------------------------------------------------------------------------------------------------------------
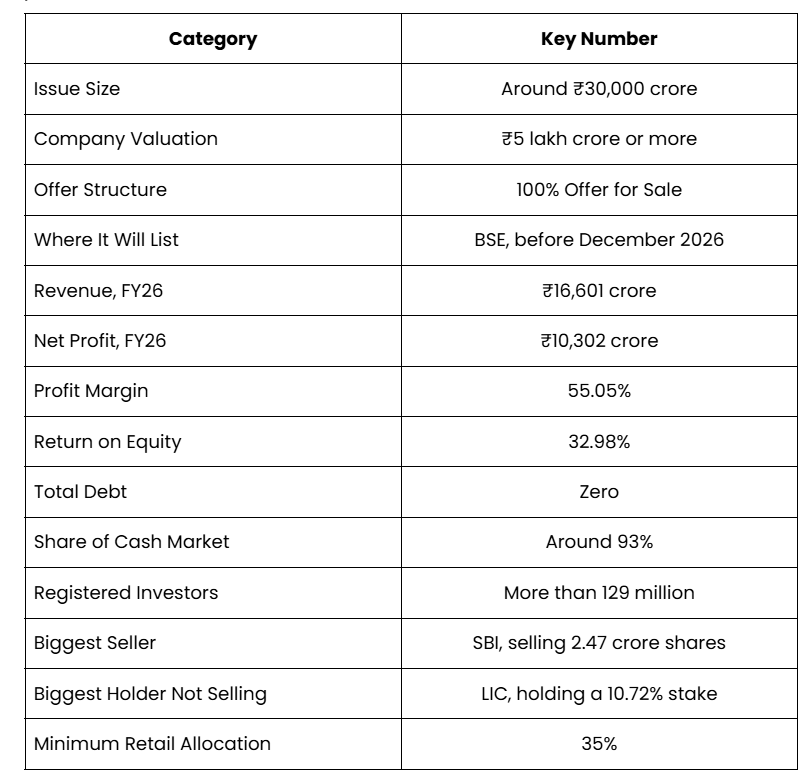
NSE IPO Information - A Quick Reference
The breakdown below provides a quick reference to the National Stock Exchange's foundational data and key metrics for the 2026 financial year, sourced directly from the official NSE DRHP. Rather than just looking at isolated numbers, evaluating this comprehensive summary gives investors a clear view of the sheer scale, efficiency, and financial health behind this historic public offering.
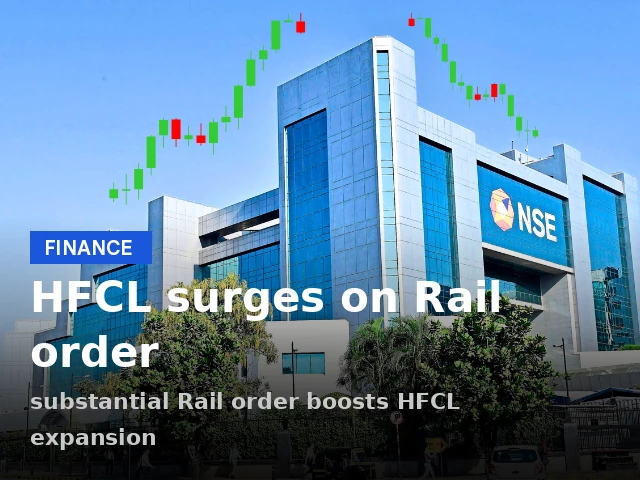
HFCL 5% Upper Circuit Trigger Explained for Investors
Key Takeaways
- HFCL hit a 5% upper circuit for the second session.
- NSE/BSE price data confirm the daily limit move.
- No fresh official announcements backing the surge were reported.
- Monitor volumes and momentum before acting.
In the Indian stock markets, momentum moves can reshape the intraday narrative in minutes. HFCL shares locked in a 5% upper circuit for the second session in a row, according to price data from the exchange. There isn’t a fresh fundamental trigger reported in company filings that would justify this surge, making the move largely a headline in price action and trader sentiment. This analysis breaks down what retail investors should know about the move and how to think about it in risk terms.
Why did HFCL stock hit a 5% upper circuit for the second session in Indian markets?
The price data from NSE shows HFCL advanced 5% to the upper circuit level for the second session. With no new official disclosures or regulatory updates reported in primary channels, the surge is attributed to momentum and market sentiment rather than a disclosed fundamental trigger. Investors should consider the possibility of speculative activity and the risks that come with momentum-driven moves.
What does this price action tell us about HFCL's near-term prospects?
Two consecutive days at the upper circuit can indicate rising trader interest or momentum in the stock. However, the absence of a concurrent fundamental update in official filings means the near-term earnings trajectory remains unchanged in primary sources. Retail investors should balance the excitement with due diligence and corroborate the move using price data from NSE/BSE and any company filings.
How retail investors should approach HFCL after a surge: risk management and due diligence
Best practice involves checking liquidity metrics and intraday volumes on NSE/BSE to gauge the robustness of the move. Compare the intraday path against key moving averages to determine whether the surge is sustainable. Consider establishing disciplined stop-loss levels and avoid overexposure to momentum trades. If you want deeper stock-specific research with institutional-grade depth, Swastika's Sarthi AI stock assistant can help you analyze HFCL and related telecom equipment plays.
What to watch next: signals that could validate further movement
Look for any official updates from HFCL or regulators, including fresh filings, orders, or governance disclosures. Monitor volume patterns to see if the move is supported by sustained participation rather than a one-day spike. Track price action against resistance levels and the broader market moves; positive corroboration from primary sources would strengthen the case for further movement.
FAQ
Why did HFCL stock hit the 5% upper circuit for the second session?
HFCL's shares advanced by 5% to the upper circuit level for the second session, based on price data from NSE/BSE; no fresh company filings publicly disclosed as a trigger.
Where can I verify HFCL price data?
Price data for HFCL can be verified on the NSE and BSE price data feeds, which show the 5% upper circuit move.
Has HFCL made any new announcements backing the surge?
According to primary sources, there have been no fresh official announcements or new filings reported to justify the surge.
What should retail investors do after momentum moves like this?
Review volumes, watch price action against moving averages, set risk controls like stops, diversify, and avoid chasing momentum without solid data.
What is Swastika's Sarthi AI stock assistant?
Sarthi is an AI stock research assistant from Swastika that provides institutional-level research on stocks or indices to retail investors.
Conclusion
For a retail investor, a 5% upper circuit in a second session signals momentum, not a guaranteed fundamental shift. The prudent approach is to observe whether there is sustained volume and any new official triggers before increasing exposure.

Gold-Silver ETFs Slide as MCX Prices Tumble: Key Support Levels in Focus for Indian Retail Investors
Key Takeaways
- Gold and Silver ETFs fell as MCX futures slid in the session.
- Key support levels for MCX gold and silver futures are in focus for traders.
- Retail investors should assess risk and adopt a disciplined approach.
- Swastika's Sarthi AI can assist with AI-driven stock research during volatility.
In a single session, MCX gold and silver futures declined, triggering a re-pricing in the associated ETFs. ETF NAVs tracked the softer futures, leading to a broad slide in the precious metals complex. Price moves on MCX were enough to keep key support levels in the spotlight for liquidity and risk management across Indian retail portfolios.
Why did gold and silver ETFs slide as MCX prices tumble?
Under the hood, ETFs derive their value from the underlying gold and silver futures. When MCX futures weaken, ETF NAVs often follow, reflecting the overnight price action and the ETF's tracking error. In the session, MCX gold futures declined by mid-single-digit percentages while MCX silver futures fell by a similar magnitude, prompting a revaluation across leading gold and silver ETFs listed in India. Investors should monitor how the ETF's holdings track the MCX price and the effect of any premium or discount to the NAV.
Where are the key support levels for MCX gold and MCX silver futures?
Traders will be watching important price levels on MCX. For MCX gold futures, the first major support is around Rs 57,000-58,000 per 10 grams, with a secondary support near Rs 56,000. For MCX silver futures, the first major support is near Rs 76,000 per kilogram, with a secondary support around Rs 74,000-75,000. If these supports hold, a rebound could follow; if broken, fresh downside targets may emerge. These levels are based on prevailing price data and technical studies commonly used by market participants; price data is sourced from MCX.
How should Indian retail investors interpret ETF price moves in a falling MCX environment?
ETFs are a convenient way to gain exposure to gold and silver, but they carry active risk because the underlying futures can move quickly. In a down MCX environment, ETF prices may decline even if the fundamental demand for gold remains intact; the effect is amplified by tracking error and any premium/discount to the NAV. Retail investors should consider their time horizon, risk tolerance, and the ETF's expense ratios before making changes. If you hold gold or silver ETFs for diversification, use this episode to reassess allocation and confirm your long-term thesis.
What trading strategies can shield your position in a falling MCX environment?
Strategy ideas include tiered trimming of exposure, using stop-loss orders or mental stops, and maintaining a core allocation while reducing risk in the short term. Consider a core-satellite approach: keep a baseline exposure via ETFs and use other assets to navigate volatility. Avoid panic selling and consider waiting for a clear price reaction near the major supports. Always ensure your risk controls are in place before placing new orders.
FAQ
What are gold and silver ETFs?
Gold and silver ETFs are exchange-traded funds that track the price of gold and silver respectively and provide exposure to these metals without requiring physical ownership.
How do MCX price moves affect gold and silver ETFs?
ETFs reflect the value of their underlying futures. When MCX gold or silver futures move lower, ETF NAVs typically slide as well, subject to tracking error and any premium/discount to the ETF's NAV.
What are the key support levels to watch on MCX for gold and silver futures?
For MCX gold futures, first major support is around Rs 57,000-58,000 per 10 grams, with a secondary support near Rs 56,000. For MCX silver futures, first major support is near Rs 76,000 per kilogram, with secondary support around Rs 74,000-75,000.
How can retail investors manage risk during ETF volatility?
Retail investors should consider diversification, maintain a core exposure, use stop-loss orders, avoid panic selling, and rebalance based on a clear risk framework.
How can Swastika's Sarthi AI help navigate ETF volatility?
Sarthi AI provides AI-driven stock and index research, price action analysis, and scenario testing to help you make informed decisions during volatility. It can screen ETFs for liquidity and support scenario planning around MCX moves.
Conclusion
This environment of falling MCX prices and ETF valuations highlights the need for disciplined risk management and a clear investment thesis. For retail investors, the current move suggests a temporary normalization window rather than a wholesale shift away from gold or silver as a long-term hedge. If you are exposed to gold or silver ETFs, use this pullback to revisit your target allocation, time horizon, and rebalancing plan.
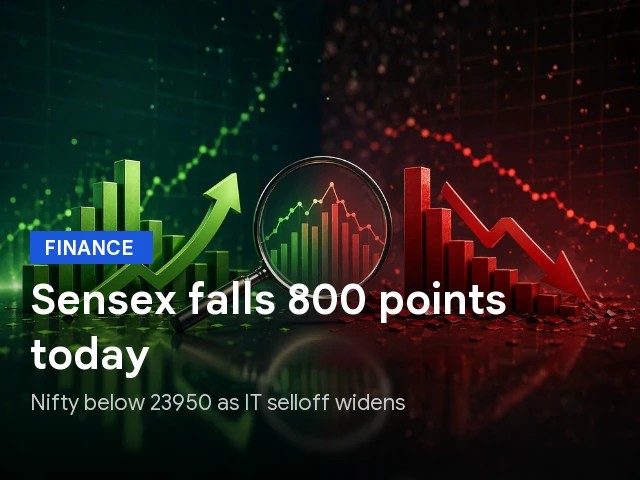
Sensex Falls 800 Points and Nifty Below 23,950: Why the Selloff Is Underway in Indian Markets
Key Takeaways
- Sensex fell around 800 points and Nifty slipped below 24,000.
- Five triggers drove the selloff: global cues, crude oil moves, FIIs, domestic macro data, and rupee moves.
- Near-term direction hinges on global risk appetite and RBI policy signals.
- Retail investors should manage risk with diversification, stops, and education via Swastika's tools.
In a day of sharp risk-off sentiment, the Sensex is seen down about 800 points while the Nifty has slipped below the 24,000 mark. This move isn’t just a numerical blip; it signals a shift in risk appetite that retail investors across India should notice. Understanding the why behind this fall helps you prepare a calmer, more measured response rather than reacting to every headline. The price data used here comes from the two main Indian exchanges, NSE and BSE, and the levels cited reflect the latest closing prices available from those exchanges.
Table data below captures the key snapshot from NSE and BSE price data. The Sensex is down roughly 800 points and the Nifty 50 is below 24,000. This breadth of pressure across sectors underscores a broad-based retrenchment rather than a handful of weak spots. For context, price data from NSE and BSE underpins these index levels and confirms a risk-off mood among participants.
Why Sensex fell today by around 800 points and Nifty slipped below 24,000?
The decline is the result of a confluence of factors, with global cues and domestic dynamics combining to push the indices lower. Market data from the two exchanges show a broad-based move lower, with the Sensex down around 800 points and the Nifty under the 24,000 level, signaling a widespread risk-off tone across sectors. Overnight weakness in major markets and a cautious mood among international investors contributed to the pullback. On the domestic side, macro considerations and evolving policy expectations from authorities added to the pressure on near-term valuations.
These price moves are anchored in data from NSE and BSE, which provide the basis for today’s index levels. While the exact order of impact can vary by sector, the overarching theme is a preference to reduce risk and reprice assets in light of global and local developments.
Five triggers behind the current selloff in India and what they mean for you
- Global cues and foreign fund flows: A risk-off tone in global markets tends to pull back Indian equities as foreign investors rebalance exposures.
- Crude oil and commodity price movements: Shifts in energy prices influence the earnings trajectory of several listed players and the overall market mood.
- Domestic macro data and RBI policy expectations: Inflation readings, growth signals, and policy guidance shape how investors value Indian equities.
- Rupee volatility and currency moves: A weaker rupee can amplify caution and prompt faster rotation out of risky assets.
- Market earnings and valuation concerns: Investors reassess earnings momentum against current valuations across sectors, prompting re-pricing.
Understanding these five triggers helps you frame the next steps rather than reacting to noise. It also highlights why even steady performers can experience drawdowns when risk appetite retreats on a broad scale.
How to navigate volatility as a retail investor in India
Volatility is uncomfortable, but it is also a fertile ground for disciplined investors to rebalance toward quality. Here is a practical checklist to navigate the current phase without losing sight of long-term goals:
- Revisit risk tolerance and adjust asset allocation to align with your sleep-at-night threshold. This is a good time to ensure your core holdings reflect quality and resilience.
- Prefer high-quality, durable franchises with strong balance sheets and defensible earnings, especially in defensive sectors during downturns.
- Use disciplined position sizing and implement stop-loss orders to manage downside risk and avoid emotional exits.
- Maintain some cash to deploy opportunistically when valuations reach compelling levels after the dust settles.
- Leverage Swastika’s research tools, including Sarthi, to evaluate stocks and indices with institutional-grade insights before making moves.
A natural bridge from here is Swastika’s Sarthi AI stock assistant, which provides institutional-level research on any stock or index to retail investors. It can help you gauge risk, validate ideas, and tailor a plan aligned with your objectives.
Is this a buying opportunity or more downside risk for long term Indian investors?
For long-term investors, dips can be opportunities to selectively add to quality names or reasonable-cost index exposures, but only if you have the conviction and capital to deploy without compromising your core risk limits. Shorter-term traders should remain cautious and adhere to predefined exit plans, as volatility can persist in a risk-off environment. The key is to separate headlines from fundamentals, and to anchor decisions in your risk budget, time horizon, and the data you trust from NSE, BSE, and credible market observers.
Implicitly, this is a call to consider a structured approach rather than ad hoc trading. If you want deeper, data-driven insights today, Sarthi can help you analyze your holdings and discover what truly fits your goals in this environment.
FAQ
What caused Sensex to fall today by around 800 points and Nifty to slip below 24,000?
The decline is attributed to five triggers including global cues and foreign fund flows, crude oil price movements, domestic macro data and RBI policy expectations, rupee volatility, and valuation concerns on earnings. Market data from NSE and BSE show the Sensex down about 800 points and the Nifty beneath 24,000, reflecting risk-off sentiment.
What does it mean when Nifty slips below 24,000?
It signals risk-off sentiment and potential further downside in the near term, as traders reassess valuations and reprice assets across sectors.
What should retail investors do during a market sell-off like this?
Maintain a disciplined approach by reassessing risk tolerance, diversifying across quality stocks, using stop-loss orders, keeping cash for opportunistic buys, and leveraging research tools such as Swastika Sarthi for stock and index analysis.
How can Swastika help me during market volatility?
Swastika offers research reports and Sarthi AI stock assistant to provide institutional-level analysis for any stock or index, helping retail investors evaluate risk, identify opportunities, and make informed trade decisions.
Where can I access reliable market research for Indian equities?
Swastika provides access to AI powered research and reports for Indian equities, along with other investment offerings including stocks, F&O, mutual funds, ETFs, IPOs, and more.
Conclusion
Retail investors in India are observing a moment where risk-off sentiment prevails, with the Sensex down about 800 points and Nifty below the 24,000 mark. This is not a verdict on long-term growth but a signal that the near term will demand disciplined risk management and a clear plan. The best path now is to revisit your risk budget, focus on quality exposures, and use structured tools to guide decisions rather than reacting to daily headlines.
Open your trading and demat account here
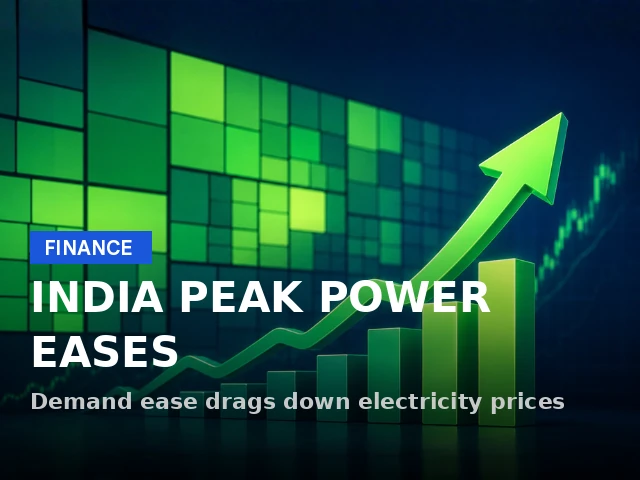
Monsoon Impact on India's Peak Power Demand and Energy Stocks: A Retail Investor's Guide
Key Takeaways
- Monsoon showers eased India's peak power demand, easing near-term pressure on power stocks.
- Cooling demand remained weak, muting the usual summer energy spike.
- Investors should monitor monsoon progress and demand signals before adjusting energy exposure.
- Swastika's Sarthi AI stock assistant helps you drill down into stock-level energy insights.
Monsoon showers eased India's peak power demand, a tension point for energy investors who must decide: ride the seasonal dip or chase the rebound when heat returns?
What does easing peak power demand imply for energy stocks during the monsoon season?
The NDTV Profit article notes that India's peak power demand has eased amid monsoon showers, with cooling demand remaining weak. For investors, this means near-term pressure on peak-load segments, as the summer heat that typically drives consumption has not materialized as strongly as expected. However, the story is cyclical: if warmth returns later in the year or if industrial activity picks up, demand could rebound. In Swastika's view, it's a reminder to focus on earnings durability and generation mix when selecting energy names rather than chasing the strongest seasonal moments.
How do monsoon showers affect electricity consumption patterns and energy stock performance in India?
Monsoon rainfall tends to lower temperatures, reducing air-conditioning use and easing the peak load on the grid. That dampens the usual summer spike in energy demand and can reduce near-term price volatility in energy stocks tied to peak usage. Yet, monsoons also redistribute demand geographically and can impact hydro and solar supply differently across states, so stock performance will depend on each company’s generation profile and tariff structure. Retail investors should consider these regional and asset-mix nuances when evaluating energy names.
Which energy sub-sectors are likely to be resilient during monsoon-driven demand weakness?
While the article focuses on a national view, typical resilience comes from firms with stable, base-load earnings: utilities with regulated tariffs and diversified fuel mixes; transmission and distribution players; and companies with hedges or long-term power-purchase agreements. Renewable developers with long-term PPAs may still find value when long-run demand trends remain positive, even as short-run cooling demand wanes. In practice, investors should tilt towards firms with robust balance sheets and clear, tariff-backed cash flows.
How should retail investors position their energy portfolio amid monsoon-era demand shifts?
FAQ
What did the NDTV Profit report about India's peak power demand during the monsoon?
It reported that peak power consumption eased amid monsoon showers, with weak cooling demand.
What near-term implication does this have for energy stocks?
The article describes demand easing, which can translate into softer near-term pressure on peak-load segments and energy stocks, though the impact varies by generation mix and region.
What should retail investors monitor in the monsoon season to gauge energy sector moves?
Investors should monitor monsoon progress and any signals of a rebound in cooling or industrial demand to gauge the energy sector's trajectory.
How can Swastika's tools help with energy stock analysis during monsoon months?
Swastika's Sarthi AI stock assistant and research reports provide stock-level insights and scenario analysis to help you navigate monsoon-driven demand shifts.
Is monsoon-driven demand variability unique to India?
This article focuses on India; monsoon-driven demand patterns can affect other markets, but sector dynamics are country-specific.
Conclusion
For the retail investor, the monsoon-driven easing of peak power demand signals a tactical pause rather than a structural turn. In practice, the near-term energy demand environment can become easier for stock pickers to navigate, but the longer horizon remains shaped by monsoon intensity and heating patterns, industrial activity, and policy cues. The smart move is to differentiate between names that offer resilient cash flows and those that ride high seasonal spikes.
Big Budget


Popular Articles


.avif)
.avif)

.avif)


START YOUR INVESTMENT JOURNEY
Get personalized advice from our experts
- Dedicated RM Support
- Smooth and Fast Trading App
