
Inside the IPO Filing Process from DRHP to Listing Day


An IPO is often perceived as a single event. In reality, it is a tightly regulated capital markets transaction that tests a company’s governance, financial maturity and disclosure standards. Long before the stock lists, months of preparation go into drafting, verification, regulatory review and investor positioning.
Why the Filing Process Matters
The offer document is the backbone of the IPO. For SEBI, it is a legal disclosure document. For investors, it is the primary source of truth.For the company, it becomes a permanent public record. Gaps in statutory disclosures or inconsistencies in financial reporting may result in approval delays and affect investor confidence.
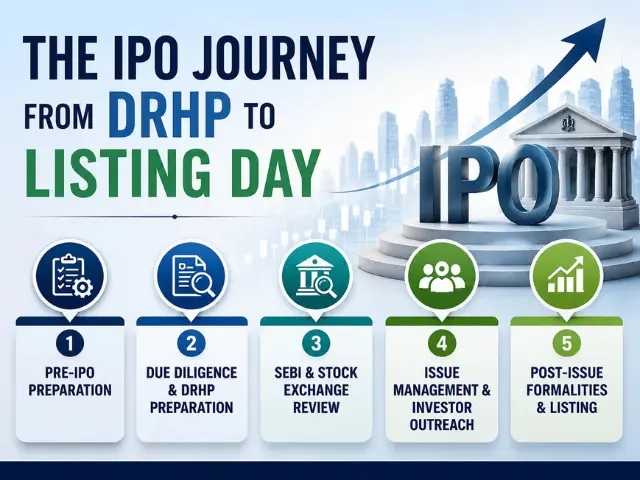
Phase I: Pre IPO Preparation
The IPO process begins well before drafting the prospectus. At this stage, the company prepares itself to operate as a listed entity. Key actions include finalising the issue structure, converting into a public limited company, updating constitutional documents, strengthening board and committee structures, appointing key managerial personnel and dematerialising shareholding.
Phase II: Due Diligence and DRHP Preparation
This is the most intensive stage of the IPO journey. The Merchant Banker conducts detailed financial, legal and business due diligence, followed by preparation of the Draft Red Herring Prospectus covering company profile, industry overview, risks, financials and utilisation of proceeds.
Phase III: SEBI and Stock Exchange Review
SEBI, along with the stock exchanges, reviews the DRHP to ensurefull and fair disclosures, eligibility, and governance compliance. All queries and observations are addressed before final In-Principal approval.
Phase IV: Issue Management and Investor Outreach
Post regulatory clearances, the Red Herring Prospectus is finalised and the issue pricing is decided. Merchant Bankers, working closely with syndication and underwriting teams, drive investor outreach and roadshows, while market makersplay a role in supporting orderly trading and liquidity (in case of SME-IPO), in line with applicable issue regulations.
Phase V: Post Issue Formalities and Listing
After the issue closes, the basis of allotment is finalised, funds are reconciled by the banker to the issue, and shares are credited to investors’ demat accounts. In cases of oversubscription, allotment is carried out as per category-wise allocation norms, with proportionate or lottery-based distribution and refunds/unblock of excess application amounts. The company then lists on the stock exchanges and enters the post-listing compliance framework. Syndication and underwriting teams continue to support investor engagement, while issuer-led marketing and investor interactions remain ongoing. Anchor investors participate up to one working day prior to the issue opening, helping establish early demand visibility and confidence in the offering.
Role of the Merchant Banker
The Merchant Banker anchors the IPO end-to-end, beginning with comprehensive due diligence and preparation of offer documentation. They act as the primary interface with SEBI and Stock Exchanges, provide valuation and structuring advice, and lead investor marketing efforts. In coordination with syndication and underwriting teams, the merchant banker supports book building, demand aggregation, and risk underwriting. Post listing, they also facilitate market-making arrangements and ensure regulatory and compliance requirements are met, enabling a smooth transition from a privately held company to the public markets.
Closing Thoughts
The IPO process shows how ready a company is to operate in public markets. With the right Merchant Banker guiding the company at every stage, the journey becomes well-planned and manageable, helping the business move smoothly into the listed space and build long-term, sustainable growth.
👉 To Connect with us today, please click here.
Latest Articles

Itc share price insights for 2026: FMCG stock slump and retail investor.


Key Takeaways
- The FMCG index is down about 10% year-to-date in 2026.
- itc share price has fallen about 28.05% YTD, among the steepest declines in the listed FMCG names.
- Procter & Gamble Hygiene and Health Care leads the declines with 30.62% YTD and United Breweries at 18.09%.
- Retail investors should focus on quality and valuation and consider building a watchlist with Swastika's Sarthi AI.
A group of ten FMCG stocks has tumbled as much as 31% in 2026, turning the sector into a test bed for stock-picking in a volatile macro backdrop. The FMCG index has declined around 10% year-to-date as geopolitical disruptions stemming from the Iran war and inflationary pressures in spring dented sentiment. Within this context, the itc share price has fallen 28.05% YTD, while several peers have delivered a spread of declines and occasional recoveries. Here is a data-driven snapshot and practical takeaways for retail investors navigating this year’s volatility.
What does the 2026 FMCG index decline mean for retail investors?
The year 2026 has underscored that macro headwinds can overshadow even traditionally defensive sectors. A roughly 10% slump in the FMCG index year-to-date suggests that sentiment is fragile and stock-picking matters more than ever. For a retail investor, this means adopting a more selective approach–prioritizing quality metrics such as earnings visibility, balance-sheet strength, and sustainable cash flows, while maintaining disciplined position sizes. In this context, the itc share price has exhibited notable volatility relative to peers, underscoring the importance of a robust framework for stock selection.
To navigate these waters, investors should track both market signals and company fundamentals. Macro risks like geopolitical developments or inflation surprises can blur the line between a temporary headwind and a structural challenge. Building a watchlist and assigning probabilities to different outcomes helps in deciding when a name has re-rated enough to be a viable entry. If you want a structured, data-backed view on each name, Swastika offers research tools and Sarthi – an AI stock assistant that delivers institutional-grade research to retail investors.
Understanding itc share price movements in 2026 and what drove the drop
In 2026, the itc share price moved in a corrective pattern alongside the broader FMCG group, as macro headwinds weighed on consumer staples valuations. The price action reflects a mix of sector-wide debt concerns, currency exposure, and demand normalization after post-pandemic highs. While the itc share price has fallen 28.05% YTD, other stocks in the basket have shown a wider dispersion in performance, underscoring the importance of stock-specific risk factors in addition to sectoral trends.
Investors should note that not all FMCG names have declined equally. Some have seen more modest drawdowns, while a few have undergone sharper corrections driven by earnings surprises, margin compression, or shifts in consumer demand. Keeping an eye on earnings quality, dividend policy, and management commentary can help separate quality names from value traps. For hands-on analysis, you can dive into the table below which consolidates the YTD performance across the ten stocks in focus, using the most recent data available through mid-2026.
Top losers among the ten FMCG stocks in 2026 and what they reveal about sector risk
From the data, Procter & Gamble Hygiene and Health Care leads the pack of declines with a 30.62% YTD fall, signaling that even premium brands in a resilient segment can face margin and demand pressures when macro factors bite. The itc share price is down 28.05% YTD, while United Breweries has fallen 18.09%. Other notable declines include Dabur India stock price at 15.74% YTD and Godrej consumer products stock at 15.87% YTD. The gains or smaller declines in Britannia industries stock price and Tata consumer products stock reflect varying exposure to raw material costs, pricing power, and regional mix. Hindustan unilever share price is down 6.15% YTD, Colgate-palmolive india has moved down 4.11% YTD, and United Spirits is at 4.20% YTD.
Investment strategies for FMCG stocks in a volatile macro environment
For a retail investor, the current environment suggests a tilt toward high-quality franchises with durable cash flows and resilient balance sheets. The more expensive macro backdrop implies a higher bar for earnings visibility and margin expansion. The Top-Down constraints highlight that while some FMCG names have delivered consistent cash generation and robust consumer demand, many have faced headwinds from cost inflation and procurement dynamics. Practically, this means: prioritize companies with strong pricing power and sustainable dividend yields, maintain a well-defined risk budget, and avoid over-allocating to any single name in a volatile cycle.
How to evaluate the itc share price and other FMCG picks using a quality + valuation framework
A practical framework for evaluating itc share price and other FMCG picks in 2026 starts with separating price from value. First, examine earnings quality: are margins stable, is there price volume growth, and how resilient is free cash flow under commodity price volatility? Second, assess balance sheet strength: how comfortable is the net debt profile, and what is the dividend payout trajectory? Third, compare valuations relative to peers: is the stock trading at a discount or premium to the sector on earnings growth, cash flow yield, and ROCE? Finally, align with your risk tolerance: if you’re more risk-averse, favor names with predictability and reliable distributions, even if growth is modest. The data above highlight wide dispersion in YTD performance across the set, underscoring that sector-wide headwinds do not uniformly apply to every name.
FAQ
Which FMCG stocks tumbled the most in 2026?
From the list of ten, Procter & Gamble Hygiene and Health Care fell 30.62% YTD, the steepest among them. ITC declined 28.05% YTD. United Breweries dropped 18.09% YTD, followed by Dabur India stock price at 15.74% YTD and Godrej consumer products stock at 15.87% YTD. Hindustan Unilever share price declined 6.15% YTD, Britannia industries stock price 13.30% YTD, Tata consumer products stock 5.27% YTD, colgate-palmolive india 4.11% YTD, and united spirits 4.20% YTD. The broader FMCG index itself was down about 10% YTD.
How did the FMCG index perform in 2026?
The FMCG index declined about 10% year-to-date in 2026, reflecting macro headwinds like geopolitical disruptions and inflationary pressures that affected investor sentiment.
Which stock among the ten had the smallest decline in 2026?
Colgate-Palmolive India had the smallest decline at 4.11% YTD among the stocks listed; United Spirits closed with a 4.20% YTD drop, which is very close but slightly higher.
Is it a good time to invest in itc share price or other FMCG names given this slump?
Decisions should be grounded in fundamentals, balance-sheet strength, and valuation. While itc share price has fallen significantly, a disciplined approach—focusing on quality, durable cash flows, and dividend reliability—helps in identifying opportunity rather than chasing a quick rebound. Investors may consider adding exposure in a staggered manner after confirming earnings resilience and a clear margin trajectory.
Where can retail investors get more stock-specific insights from this data?
Retail investors can access research tools and AI-assisted stock analysis via Swastika’s Sarthi, which provides institutional-grade insights for building a well-informed watchlist and testing investment theses before committing capital.
Conclusion
The retail investor should view the 2026 FMCG pullback as a reminder that even defense-oriented sectors can deliver a wide spread of outcomes when macro forces bite. The key takeaway is to blend price awareness with a robust quality-and-valuation framework, and to stay disciplined with position sizing and risk controls. Start by compiling a targeted watchlist that emphasizes durable earnings, conservative leverage, and sticky consumer demand, then use a repeatable process–rather than gut feel–to decide when to add exposure.

Why Did Gold-Loan NBFC Stocks Drop Up to 3%? A Retail Investor's Guide to Manappuram, Muthoot & More
Key Takeaways
- Gold-financier stocks fell up to 3% in intraday trading.
- The drop was driven by regulatory developments affecting the sector.
- Investors should monitor RBI policy cues and gold price trends going forward.
- Swastika's Sarthi AI offers deeper, institutional-grade stock insights.
Intraday shock: gold-financier stocks slid up to 3% amid regulatory cues and gold-price dynamics, raising questions for retail investors across India.
Gold loan NBFCs like Manappuram Finance and Muthoot Finance are part of a sector that often moves with policy updates, price of gold, and asset-quality signals. Here's what retail investors in India should know about this move and how to position their portfolios.
Why did Manappuram Finance, Muthoot Finance, and other gold-finance stocks fall up to 3% in intraday trade?
In intraday trading, shares of Manappuram Finance, Muthoot Finance, and other gold financiers declined by up to 3% as market participants priced in regulatory risk and sector-specific headwinds. The move signals the market's alignment with regulatory developments affecting gold-loan lenders and their collateral-backed lending model. Traders will watch for how these players manage gold-price volatility and the evolving policy environment moving ahead.
For a deeper, data-driven view on such stock moves, Swastika's Sarthi AI stock assistant can offer research insights tailored to your holdings.
What regulatory and market factors are likely behind the gold loan NBFC weakness?
The weakness in this niche reflects regulatory developments that influence risk management, capital adequacy, and collateral valuation for gold loans. Regulatory actions can affect collateral coverage requirements, pricing flexibility, and the ability of NBFCs to grow lending in gold-backed segments. In addition, general market conditions for small- and mid-cap financials can magnify the impact of sector-specific policy changes, contributing to observed price moves.
How do gold loan NBFC fundamentals respond to gold price movements and regulatory changes?
Gold loans are secured by gold collateral, so changes in gold prices can affect collateral value and risk weightings in lending. Regulatory changes can influence lending growth, provisioning, and capital requirements, which in turn influence profitability and valuation. The combined effect of price volatility and policy shifts tends to translate into higher earnings volatility and stock-price sensitivity for the sector.
What should retail investors watch before investing in gold-finance NBFCs?
Retail investors should focus on stock-specific risk factors such as asset quality indicators, lending growth in gold-secured segments, and the management's ability to navigate policy changes. It's also important to monitor macro factors like the gold price trajectory and RBI or other regulatory signals that could alter risk profiles. Diversification across sectors and careful position sizing can mitigate the sector's volatility.
FAQ
Which stocks fell and by how much in intraday trading?
Shares of Manappuram Finance, Muthoot Finance, and other gold-financiers declined up to 3% in intraday trade.
What caused the slide in gold-financier stocks?
The move followed regulatory developments affecting the gold-loan sector.
Which factors should investors monitor after this move?
Investors should monitor RBI policy cues, gold price trends, and the sector's asset-quality indicators.
Where can I find deeper research on these stocks?
Swastika Investmart offers Sarthi AI stock assistant and research reports to analyze gold-finance stocks with institutional-level insights.
What should a retail investor do now when gold-financier stocks are volatile?
Adopt a risk-aware approach: diversify, assess asset quality, monitor regulatory developments, and use credible research tools before making decisions.
Conclusion
In the near term, the price action in gold-financier stocks reflects sector-specific regulatory sensitivity and gold-price volatility rather than a blanket judgment on the entire NBFC space. Retail investors should calibrate their risk tolerance, focusing on asset quality signals, volatility, and management commentary around regulatory developments.

Commodity Correction Buying Opportunity in Indian Markets: Defence & Banking as Long-Term Bets
Key Takeaways
- Commodity correction creates a buying opportunity for patient investors.
- Defence and banking remain durable long-term bets despite volatility.
- Position with risk-managed, diversified exposure and gradual allocation.
- Sarthi AI stock research from Swastika helps identify high-conviction ideas.
Commodity prices have pulled back from recent highs, and a cautious macro backdrop could turn this correction into a buying opportunity for discerning investors. The question for Indian retail investors is not whether to participate, but where and how to allocate to capture durable earnings in a volatile phase. In this setup, defence and banking stocks stand out as the long-term bets, while commodity cycles require selective exposure and disciplined risk management.
Is a commodity correction creating a buying opportunity for Indian retail investors?
When commodities correct, valuations in commodity-linked equities often improve, improving risk-reward for buyers with a long horizon. Focus on names with strong balance sheets, credible governance, and resilient earnings streams. The near-term volatility may persist, but the outcome can hinge on selecting quality franchises that can withstand price swings in the underlying commodities and macro headlines.
Why defence stocks remain a long-term bet even during market downturns
Defence demand sits on secular drivers–domestic procurement pipelines, multi-year orders, and potential export opportunities–that help sustain earnings visibility during cycles. For investors, a handful of credible defence names with order books and governance standards offers justified exposure to a theme with structural growth, even as broader markets correct.
Why banking sector stocks are favored as long-term bets in a corrective phase
Banking equities can exhibit resilience during corrections due to domestic credit growth and improved balance sheets in several lenders. Long-term growth drivers like retail lending, SME credit, and digital banking support earnings visibility, providing a fundamental reason to hold quality banks for the long run as cycles turn.
How to build a resilient portfolio around commodity-sensitive sectors
Use a core-satellite approach: a core position in high-quality defence and banking names, with satellite exposure to select commodity-linked stocks or ETFs to ride upcycles. Emphasize risk controls, position sizing, and trailing stops to protect capital. Consider dollar-cost averaging during volatility and rebalancing to maintain alignment with risk tolerance. Swastika Investmart also offers research reports and the Sarthi AI stock assistant to help retail investors find opportunities with institutional-grade insights.
What macro cues support a buying opportunity in commodities
Keep an eye on inflation trajectories, monetary policy stance, and currency trends, as these macro cues underpin commodity price movements and the related equity performance. In India, domestic demand growth and policy settings create a supportive context for commodity-related equities to recover in a measured, fundamentals-driven way.
Risk management and exit strategies during a commodity-led rebound
Establish explicit risk controls: define stop losses, set sensible position sizes, and plan exits to protect gains. As prices rebound, progressively trim exposure in winners and rebalance toward core holdings, ensuring liquidity and discipline remain central to the plan. In all cases, decisions should rely on fundamentals and valuations, not noise.
FAQ
What does a commodity correction imply for investing in defence and banking stocks?
The view is that commodity correction offers buying opportunities, while defence and banking stocks remain long-term bets.
Which sectors are highlighted as long-term bets during correction?
Defence and banking sectors are highlighted as durable long-term bets in the face of volatility.
How should a retail investor position during a commodity correction?
Adopt a core-satellite approach with risk controls, gradually allocate to defence and banking names, and use research tools like Sarthi AI to uncover high-conviction ideas.
What macro cues support buying opportunities in commodities?
Favorable inflation trajectories, supportive monetary policy, and currency trends can underpin commodity rebounds and the related equity performance.
What Swastika Investmart offerings can help retail investors?
Swastika Investmart provides stocks, F&O, mutual funds, IPOs, ETFs, bonds, MCX, SLBM, pledging, research reports, and Sarthi AI for institutional-grade stock research.
Conclusion
For the retail investor, a commodity correction can be a catalyst to upgrade the quality of holdings in defence and banking while maintaining a disciplined stance on commodity-sensitive exposures. The so-what is simple: buy quality on dips, manage risk, and stay patient through cycles.

Tata Chemicals stock rises 4% on Tata Sons listing hopes amid RBI norms
Key Takeaways
- Tata Chemicals stock rose 4% intraday on Tata Sons listing hopes.
- The trigger is RBI norms cited as a catalyst, not a fundamental upgrade.
- Retail investors should watch regulatory updates and avoid chasing headlines.
- For deeper analysis, Swastika's Sarthi offers institutional-grade stock research.
In India, regulatory catalysts can move stocks quickly, and Tata Chemicals is a case in point. The stock's 4% intraday rise reflects market participants pricing in the potential for Tata Sons to list or restructure assets under the RBI-norm framework. While such moves hint at future catalysts, they do not immediately alter Tata Chemicals' earnings or long-term fundamentals. Investors across the country are watching how this regulatory backdrop interacts with Tata Group actions and sector dynamics.
The fuel for the latest swing comes from RBI's new norms, which are cited as enabling or clarifying conditions for a listing involving Tata Sons. These norms, by changing the regulatory clarity around group entities and their holdings, can set the stage for structural moves without immediate noise around corporate performance. However, the price action remains a reflection of sentiment around a potential listing rather than a proven business improvement.
Tata Chemicals stock moves: what the price action signals for liquidity and risk
When a stock moves on a potential corporate action rather than earnings beats, it often signals that investors expect unlocking value through a listing or corporate restructure. The 4% rise is a gauge of this sentiment rather than a forecast of fundamentals. Retail traders should assess how much of this move is priced in and how it might unwind if regulatory updates fail to materialize.
What this means for Tata Chemicals' risk profile and valuation
In practice, the event-driven move can lead to higher short-term volatility, with volatility of the stock price rising as new information emerges. The longer-term valuation will still hinge on actual earnings growth, cash flows, and margin trajectory for Tata Chemicals. Investors should ensure their exposure aligns with their risk tolerance and portfolio diversification goals.
Where to go from here: a practical plan for investors
Key steps for retail investors include tracking RBI norms updates, Tata Sons' corporate actions, and official exchanges' filings for any confirmation of listings. Always cross-check with company filings and regulatory disclosures. If you'd like structured analysis, Swastika's research reports and Sarthi, an AI stock assistant, can quantify catalyst probability and potential price impact, guiding you with an evidence-based approach.
FAQ
Why did Tata Chemicals stock rise 4%?
The stock rose 4% in intraday trade due to investor optimism around Tata Sons listing, a catalyst cited in relation to RBI norms.
What RBI norms are mentioned as supporting this listing speculation?
The article references new RBI norms that could influence the feasibility or timing of a Tata Sons listing, creating conditions that traders interpret as a potential catalyst.
Should retail investors buy Tata Chemicals based on this news?
The move is a sentiment-driven catalyst, not an earnings beat; investors should avoid chasing momentum and consider risk-adjusted positions with diversification.
What should I monitor next if I own Tata Chemicals stock?
Monitor RBI norms updates, official regulatory disclosures, Tata Sons' statements, and NSE/BSE price action for any confirmatory signals.
Where can I get deeper stock research from Swastika?
Swastika offers research reports and Sarthi, an AI stock assistant that provides institutional-level research on Tata Chemicals and index actions for retail investors.
Conclusion
The 4% intraday rise in Tata Chemicals stock signals a market appetite for a possible Tata Sons listing, anchored by RBI norms, rather than a sudden fundamental upgrade. Retail investors should treat this as a catalyst to monitor regulatory updates, not a call to buy on momentum alone. This is a moment to calibrate risk, set clear levels, and watch for confirmatory disclosures while maintaining diversified exposure across Indian equities.

Vedanta Nalco Hindustan Zinc Shares Fall Up to 3% as Metals Slump: A Retail Investor's Guide
Key Takeaways
- Vedanta, Nalco and Hindustan Zinc shares fell up to 3%.
- Silver, aluminium and other metal prices tumbled.
- Price data from NSE and BSE reflect the move.
- Retail investors should monitor commodity moves and manage risk.
When commodity price cycles turn, metal miners often lead equity moves. A recent session saw Vedanta, Nalco and Hindustan Zinc shares fall up to 3%, a movement that mirrors the broader tone in base metal markets. Price data on NSE and BSE confirm the slide in these metal-linked names, underscoring how the fate of mining stocks can ride the waves of silver, aluminium and other metal prices.
Vedanta Nalco Hindustan Zinc shares fall up to 3% as metals prices tumble: why investors should care
The latest price action shows a direct link between commodity movements and the stock performance of metal-heavy players. The three names mentioned–Vedanta, Nalco, and Hindustan Zinc–registered declines of up to 3%, a signal that investor sentiment on metal miners can tighten quickly when base metal prices retreat. The price move aligns with the broader phenomenon where silver and aluminium price declines weigh on earnings expectations and valuations for metal producers. In market data terms, NSE and BSE price data reflect this correlation, with stock prices adjusting in step with metal price pressure. For a retail investor, this is a reminder that a commodity cycle can be a leading indicator for stock performance in metal-heavy portfolios, even if other macro signals appear stable.
From a portfolio standpoint, the event highlights the sensitivity of mining stocks to base metal pricing. If you hold Vedanta, Nalco or Hindustan Zinc, the valuation impulse you observe today may be less about company-specific news and more about the evolving metal price environment. Keeping an eye on the metal price backdrop–silver and aluminium in particular–can offer a practical lens to interpret short-term stock moves and to calibrate risk exposure in metal-linked holdings.
How falling silver and aluminium prices translate into moves in Indian metal miners' stock prices
Silver and aluminium are among the most influential base metals for Indian metal miners and their supply chains. When these prices slip, the revenue and margin outlook for metal producers can soften, leading investors to adjust valuations downward. The observed stock move in Vedanta, Nalco and Hindustan Zinc–where shares declined up to 3%–is consistent with a scenario in which the market prices in weaker metal revenue or profit margins ahead. This dynamic is a reminder that the equity value of mining names is not insulated from commodity price shocks; rather, it often amplifies the price signal coming from base metal markets. For investors, the takeaway is to watch metal price momentum as part of the stock’s risk-reward equation, especially for stocks with high metal exposure.
Beyond the single-session snapshot, ongoing vigilance on metal price trends can help in assessing whether current weakness is a temporary headwind or part of a broader shift in metal demand and supply dynamics. Company filings and exchange price data provide a factual read on how these price moves translate into stock performance, making it prudent to triangulate between metal benchmarks and stock-specific disclosures when evaluating risk and opportunities in metal-mining exposures.
What NSE and BSE price data reveal about metal-stock correlation during commodity volatility
Price movements on NSE and BSE capture the immediate reaction of metal-linked stocks to shifts in metal prices. The reported fall of Vedanta, Nalco and Hindustan Zinc shares–up to 3%–is a concrete instance of how commodity volatility can drive short-term equity performance. The alignment between the tumble in silver, aluminium, and other metals and the stock declines illustrates a tangible link: commodity price shocks often translate into equity price adjustments for miners and suppliers. For investors, this means that monitoring metal-price movements alongside stock prices on NSE and BSE can provide a clearer read on risk exposure and potential entry or exit points during periods of commodity volatility.
In practice, this correlation suggests a disciplined approach to position sizing and risk controls for holders of metal-linked equities. Rather than treating commodity and equity signals in isolation, investors can benefit from a dual-laceted view that tracks both the metal-price trajectory and the corresponding stock performance data reported on the exchanges. This perspective helps in separating transient price noise from persistent shifts in the metal-cost structure that could influence earnings credibility and multiple assumptions in stock models.
Practical steps for retail investors to navigate metal price shocks in mining stocks
During episodes of metal-price shocks, a pragmatic plan helps preserve capital while preserving upside potential. Key steps include: (1) Monitor metal price benchmarks–particularly silver and aluminium–alongside the price action of Vedanta, Nalco, and Hindustan Zinc on NSE and BSE. (2) Build a focused watchlist of metal-exposed names and assess each company’s exposure, hedges, and diversification within the broader portfolio. (3) Evaluate position sizes and risk controls in line with personal risk tolerance; consider adjusting allocations if commodity risk is overweight in the portfolio. (4) Use exchange-traded insights to calibrate expectations about price reversals or further downside, recognizing that a 3% stock move in one session can be part of a larger volatility pattern in metal sectors. (5) For Swastika Investmart clients, leverage Sarthi – our AI stock assistant – to obtain institutional-grade research on metal stocks and to test how different metal-price scenarios might affect your holdings before committing capital.
These steps blend data from NSE/BSE with a practical risk framework, helping you maintain clarity amid volatile metal-price environments. The underlying message remains that commodity moves create price signals in metal stocks, and a disciplined, data-driven approach can help you respond with confidence rather than reaction.
Implicitly, this is a call to action for readers who want to translate market moves into actionable ideas: explore Sarthi to gain clarity on metal-exposed stocks and validate your investment thesis in a structured, low-friction way. The objective is to turn price noise into a framework you can trust, rather than a sequence of impulsive trades.
FAQ
What triggered the fall in Vedanta, Nalco and Hindustan Zinc shares?
The article notes that silver and aluminium prices, along with other metals, tumbled, and Vedanta, Nalco, Hindustan Zinc shares fell up to 3%.
Which stocks were mentioned as falling in response to metal price moves?
Vedanta, Nalco (National Aluminium Company), and Hindustan Zinc.
Which metals' price moves were cited in relation to the stock moves?
Silver and aluminium prices tumbled, along with other metal prices.
From which sources can investors view the price data related to these moves?
NSE and BSE price data reflect the movements discussed.
What is the relationship between metal price moves and these stocks according to the article?
The stock moves are linked to the tumble in base metal prices, illustrating how commodity prices can influence mining-stock valuations.
Conclusion
What this market action means for the retail investor today is simple: a rise or fall in metal prices can translate quickly into the stock performance of metal miners. The 3% cap on Vedanta, Nalco and Hindustan Zinc shares, in the context of a broader tumble in silver and aluminium, underscores how commodity price moves shape immediate equity risk. The practical takeaway is to treat metal price shifts as a core driver of your exposure to metal-linked stocks and to align your positions with a disciplined framework that accounts for both commodity moves and stock-specific fundamentals. In practice, this means watching metal price momentum, evaluating company disclosures for margin resilience and hedges, and maintaining a measured approach to risk in your metal-stock sleeve.

Indigo SpiceJet rally as crude oil falls below prewar level
Key Takeaways
- Indigo and SpiceJet rallied up to 4% on NSE and BSE as crude oil fell below prewar levels.
- Oil-price relief is a key driver behind short-term aviation stock sentiment in India.
- Retail investors should watch oil-price trends and fuel-cost pass-through to margins.
- Sarthi AI by Swastika provides institutional-grade stock insights to support decision-making.
Energy-price moves can flip sentiment in minutes–and today, a slide in crude oil below prewar levels sent Indigo and SpiceJet stock up to 4% on NSE and BSE.
Price moves stem from primary market data on NSE and BSE, with the intraday swing highlighting the sensitivity of Indian aviation stocks to energy costs.
Why Indigo and SpiceJet rallied up to 4% as crude oil fell below prewar levels
Fuel costs dominate airline economics. A fall in crude prices can ease operating expenses, potentially supporting better margins for carriers like Indigo and SpiceJet, which often translates into positive price action on the NSE and BSE. The current move is a price-action response tied to oil-market dynamics rather than a fundamental earnings upgrade from airline filings.
How falling crude oil prices impact Indian airline profitability and stock valuations
Lower fuel costs can improve operating margins for airlines, influencing valuation multiples. Yet investors should be mindful that oil prices can be volatile, and airline profitability also depends on passenger demand, currency movements, and capacity deployment. Any sustained rally would likely require oil prices to stay comfortably below previous highs while demand remains robust.
What NSE and BSE price data show about Indigo and SpiceJet moves today
Price data from the NSE and BSE show Indigo and SpiceJet up to 4% in today’s session. The exact intraday level would depend on the time of data capture and market liquidity, but the headline takeaway is that both stocks moved in tandem with energy-price shifts, reflecting sensitivity to fuel costs among Indian aviation peers.
What retail investors should watch next in Indian aviation stocks amid energy-price volatility
Keep an eye on crude oil direction, airline fuel-cost pass-through, and quarterly margin trajectories. A sustained oil-price decline may keep airline costs in check; however, demand trends and currency headwinds can cap upside. Diversification and risk controls remain essential as oil markets can reverse rapidly.
FAQ
What triggered Indigo and SpiceJet rally today?
Crude oil prices fell below prewar levels, reducing fuel costs for airlines and supporting stock prices on NSE and BSE for Indigo and SpiceJet.
How much did Indigo and SpiceJet move?
Indigo and SpiceJet shares rose up to 4% according to NSE and BSE price data.
Which exchanges reported the moves?
The moves were observed on NSE and BSE price data.
Why do crude oil price changes impact airline stocks?
Fuel costs represent a large portion of airline expenses; when oil prices fall, margins can improve, supporting airline valuations.
What should Indian retail investors watch next in aviation stocks?
Oil price trends and fuel-cost pass-through to airfares, along with airline margins and demand trends.
Conclusion
For the Indian retail investor, the Indigo-SpiceJet price action demonstrates how energy-price dynamics can translate into quick sentiment shifts in aviation stocks. The key takeaway is not a long-term upgrade in fundamentals just yet, but a reminder to monitor fuel-cost sensitivity as oil markets evolve and to use that lens when reading airline stock moves on the NSE and BSE.
Next step: adopt a mental model of fuel-cost sensitivity – track crude oil trends against airline margins, and consider using institutional-grade research tools like Swastika's Sarthi AI to stay ahead of next moves in Indigo, SpiceJet, or any airline stock.
Big Budget


Popular Articles


.avif)
.avif)

.avif)


START YOUR INVESTMENT JOURNEY
Get personalized advice from our experts
- Dedicated RM Support
- Smooth and Fast Trading App
