
Newgen Software Technologies Stock Rally After CEO Change


Key Takeaways
- Newgen Software Technologies stock surged 14.63% to Rs 541.65, lifting the Nifty IT index.
- Leadership changes include Tarun Nandwani as CEO and Pramod Kumar as CGO, following Virender Jeet's resignation.
- RSI stands at 49.1 and the stock trades above six of eight key SMAs while P/E, P/S and P/B reflect a growth-friendly valuation.
- FII stake trimmed to 14.48% and MF stake to 3.33%, with Q1 FY27 results due on July 16.
When leadership changes collide with a broad IT rally, investors face a crucial question: Is the newgen software technologies stock poised for a sustained breakout or a short-lived swing? The stock jumped about 14.63% to Rs 541.65, fueling a broader IT bounce as the Nifty IT index climbed more than 2%. In the mix, infosys stock price and stock price of tcs also moved higher, reflecting a mood shift across large-cap software names.
Newgen Software Technologies Stock Rally After CEO Change
At its meeting held on July 2, 2026, the board approved a leadership transition following the resignation of Virender Jeet as Chief Executive Officer (CEO) and Key Managerial Personnel (KMP), effective from the close of business on August 31, 2026. The board appointed Tarun Nandwani as the new Chief Executive Officer and Key Managerial Personnel, while Pramod Kumar was named Chief Growth Officer (CGO) and designated as a Key Managerial Personnel.
The company also informed that Q1 FY27 results will be considered and approved by the board on July 16, 2026, for the unaudited standalone and consolidated financial results for the quarter ended June 30, 2026. Investors will closely monitor the earnings for cues on business momentum and management's outlook following the leadership transition.
Leadership Transition At Newgen Software Technologies Stock–What Retail Investors Should Watch
This leadership transition marks a significant milestone in the company's governance. Investors will watch for continuity in strategy, client gains, and the pace of deal execution under the new CEO. Tarun Nandwani's track record and Pramod Kumar's CGO role will likely shape the growth narrative, while the August 31 completion window adds a near-term uncertainty that markets discount in part. In addition, management clarity on order momentum, client diversification, and project mix will be crucial to sustain the rally beyond the current phase.
Beyond governance, the market will focus on how the company maintains client momentum and whether the leadership change translates into improved execution across projects. The coming quarters will reveal how strategy translates into revenue growth and margins, especially as the IT services space remains competitive. Retail investors should weigh execution capability and any shifts in pricing strategies or service mix as a guiding framework for the stock's medium-term path.
Upcoming Q1 FY27 Results For Newgen Software Technologies Stock: Timeline And Market Expectations
The upcoming Q1 FY27 results are a key catalyst and are scheduled around mid-July. The board will meet on July 16, 2026 to consider unaudited standalone and consolidated financial results for the quarter ended June 30, 2026. Market participants will look for momentum, margins, and the outlook beyond the leadership transition, with attention to client wins, project pipelines and any changes in operating efficiency.
Investors may also assess how management frames growth drivers, such as new client acquisitions, digital transformation initiatives, and any strategic partnerships that could influence the trajectory of the stock. A positive tone could support a near-term move toward resistance around Rs 550-560, while a cautious stance could keep the stock rangebound until earnings clarity emerges. The Q1 print will help calibrate expectations for the rest of the fiscal year and inform whether the leadership transition translates into a more aggressive growth plan.
Technical Setup: RSI And Moving Averages For Newgen Software Technologies Stock
The stock's technical outlook shows a 14-day Relative Strength Index (RSI) of 49.1, with readings below 30 considered oversold and above 70 considered overbought. The stock is trading above six of its eight key simple moving averages (SMAs), which suggests a buoyant near-term momentum if price sustains above these levels. A break above key resistance near Rs 560 could attract additional momentum traders looking for a breakout, while dips toward the 520-535 zone may present tactical buying opportunities for longer-term investors. The mixed technical picture implies that any directional move may hinge on the Q1 FY27 commentary and sector momentum rather than a single-factor trigger.
Valuation Snapshot For Newgen Software Technologies Stock: P/E, P/S, P/B And Implications
Valuation data indicate a P/E of 22.41, P/S of 3.61, and P/B of 3.79. These multiples place the stock in a growth-oriented zone within the software space, reflecting expectations of continued revenue momentum and profitability improvements. While these metrics are not unusually rich for software peers in a growth phase, the stock’s recent rally has lifted sentiment and encouraged a broader re-rating if earnings momentum sustains.
| Metric | Value |
|---|---|
| P/E | 22.41 |
| P/S | 3.61 |
| P/B | 3.79 |
Institutional Ownership And Market Momentum For Newgen Software Technologies Stock
Shareholding data for the March 2026 quarter show a moderation in institutional participation. FIIs trimmed their stake to 14.48% from 17.34%, and mutual funds reduced their holdings to 3.33% from 4.12%. This moderation suggests caution among larger participants even as the stock's recent rally reflects broader market momentum in the IT space. If institutional interest re-accelerates, a fresh leg higher could be possible, especially if Q1 FY27 results affirm a stable growth trajectory.
Infosys Stock Price And Stock Price Of Tcs In The IT Rally – Comparative Context
Within the same sector, larger IT names showed strength. infosys stock price rose up to 4% during the rally, and the stock price of tcs also moved higher after Tata Consultancy Services reported better-than-expected first-quarter earnings. This broad IT rally underscores that sentiment is being driven by sector-wide factors, not only company-specific triggers, which could have spillover effects on Newgen's stock trajectory. The overall IT index momentum provides a supportive backdrop, but stock-specific catalysts like leadership changes and quarterly results will ultimately determine the pace of any continued rally.
Moreover, the Nifty IT index gained over 2%, reflecting resilience in the sector even as individual stories like the leadership change at Newgen play out. Retail investors should parse the commentary from management and compare it with sector peers before deciding on exposure levels. For deeper stock-level insights, you can explore Swastika's Sarthi AI stock assistant for institutional-grade research at your fingertips.
Frequently Asked Questions
What triggered the surge in Newgen Software Technologies stock?
The stock rose 14.63% to Rs 541.65 as the broader IT rally gained steam following Tata Consultancy Services' stronger first-quarter earnings, and investors priced in the leadership transition at Newgen.
Who were the leadership changes announced at Newgen Software Technologies stock?
Virender Jeet resigned as Chief Executive Officer and Key Managerial Personnel, effective August 31, 2026. Tarun Nandwani was appointed as the new Chief Executive Officer and Key Managerial Personnel, while Pramod Kumar was named Chief Growth Officer and designated as Key Managerial Personnel.
When are the Q1 FY27 results due for Newgen Software Technologies stock?
The board will meet on July 16, 2026 to consider the unaudited standalone and consolidated financial results for the quarter ended June 30, 2026.
What is the RSI and moving average setup for the stock?
The 14-day RSI stands at 49.1, with readings below 30 considered oversold and above 70 overbought. The stock is trading above six of its eight key SMAs, indicating a positive near-term momentum bias.
What are the current valuation metrics for Newgen Software Technologies stock?
The stock trades at a P/E of 22.41, a P/S of 3.61, and a P/B of 3.79, reflecting a growth-oriented valuation within the software sector.
How have institutional holdings changed for the stock recently?
Foreign Institutional Investors trimmed their stake to 14.48% from 17.34%, and Mutual Funds reduced their holdings to 3.33% from 4.12% in the March 2026 quarter, signaling moderation in participation despite the rally.
Conclusion
Retail investors should treat this moment as a test of your risk framework for growth IT names. The near-term path for newgen software technologies stock depends on leadership alignment, execution on deals, and the tone of Q1 FY27 commentary. Consider calibrating position sizes and setting predefined triggers for profit-taking or add-on purchases as earnings approach.
If you want deeper, institution-level research to guide decisions in this fast-moving space, Swastika's Sarthi AI stock assistant can offer structured insights to support your investment process.
Open your trading and demat account here
Reference :
1 : Economictimes
Latest Articles
AI stock assistant for Indian retail investors: A practical guide to smarter trading with Swastika Sarthi


Key Takeaways
- AI stock assistants screen stocks faster with data-driven insights for Indian retail investors.
- Swastika's Sarthi delivers institutional-grade research for individual traders.
- Follow SEBI, NSE, and BSE guidelines to safeguard your investments.
- Combine long-tail, geo-aware strategies with disciplined risk management for India.
In the Indian stock market, retail investors juggle streams of data, headlines, and price moves. The gap between knowledge and action often boils down to access to credible analysis and a disciplined decision framework. An AI stock assistant like Sarthi can deliver institutional-grade research to your desk, helping you trade smarter rather than just busier. This guide shows how to harness AI-powered tools within Swastika's ecosystem to build a repeatable, research-backed investing process that fits a retail palate.
What you’ll learn: how to start with AI-enabled research, how Sarthi can surface credible stock ideas, how to navigate Indian market regulations, and how to translate data into practical trades while protecting downside risk. All of this is grounded in the reality of India’s exchanges, regulators, and the diversified choices retail investors face–from stocks to mutual funds, IPOs to ETFs, and beyond.
how to start investing in the Indian stock market as a retail investor in 2026 with AI tools
Sarthi is designed to translate institutional-level research into actionable signals for retail investors. It analyzes fundamental factors such as profitability, balance sheet health, and cash flow, alongside price action, liquidity, volatility, and macro-trigger signals. The result is a short, high-signal list of stocks with a clear bull case and bear case, plus quantified risk metrics you can compare against your personal risk ceiling. You can customize the universe (e.g., by sector, market cap, or liquidity) and set filters that reflect your risk tolerance and horizon. The tool also surfaces potential catalysts–earnings sessions, regulatory events, and macro data releases–that could drive price action.
Once Sarthi narrows the field, you receive concise research summaries and an integrated risk heat map. This lets you quickly separate ideas with strong upside potential from those with weak risk-reward profiles. The value is not just in the numbers; it’s in the structured narrative that helps you understand what could go right or wrong, and why. As you apply this process, you’ll establish a repeatable approach to stock selection that can be audited and refined over time. Implicit CTA: try Sarthi to experience how AI-backed research translates into your own shortlist and decision framework.
navigating Indian market regulations: SEBI, NSE, BSE guidelines for retail traders
India’s retail investors operate within a layered regulatory environment designed to protect investors and ensure fair markets. The Securities and Exchange Board of India (SEBI) oversees market integrity, product disclosures, and broker conduct. The two main stock exchanges–the National Stock Exchange (NSE) and the Bombay Stock Exchange (BSE)–provide liquidity and price discovery, with price data and settlement cycles published by those exchanges. For everyday trading, regulators emphasize transparency, KYC compliance, risk disclosure, and prudent risk management. Understanding these rules helps you align your strategy with permissible practices and ensures your use of AI tools remains compliant and safe.
Key practical takeaways for retail traders include ensuring your KYC is complete, keeping client funds segregated as required, and adhering to margin and risk disclosure standards. While AI tools can surface insights and help manage risk, you still need to make final decisions within the regulatory framework. Always verify and cross-check AI-generated recommendations with official sources and your own judgement, and maintain a watch on regulatory announcements that can impact market dynamics.
practical steps to build a sustainable investing routine using AI and data-driven insights
1) Define a lightweight, repeatable process: set a weekly cadence for screening, reviewing, and rebalancing. 2) Build a dynamic watchlist anchored in your risk tolerance and horizon, with Sarthi continuously updating based on new data and catalysts. 3) Create two lists: a signal list of ideas with strong upside potential and a risk list of items to monitor or avoid. 4) Use Sarthi’s summaries to write a quick justification for each trade, including bull and bear theses. 5) Track outcomes against your pre-defined criteria, allowing you to refine filters and weightings over time. 6) Integrate education and risk management into your routine by allocating time to study regulatory rules, risk disclosures, and portfolio design concepts. 7) Schedule periodic reviews with your advisor or mentor for accountability and perspective.
Within this framework, AI serves as a force multiplier: it handles data-intensive tasks and surfaces insights you can validate through your own checks. The goal isn’t to replace judgment but to amplify it with structured, repeatable analysis. And as you gain comfort, you’ll find that the AI-assisted workflow scales with your ambition, from a few ideas a week to a well-curated, diversified portfolio across stocks, funds, and fixed income.
case study: hypothetical scenario using Sarthi to shortlist a stock in India
Implicit CTA: consider how Sarthi could have mapped this scenario in your own portfolio and see how quickly your decision cycle tightens with AI-backed research.
FAQ
What is AI stock assistant and how does Sarthi help retail investors in India?
Sarthi is an AI-driven stock research assistant that provides institutional-grade analysis for individual investors. It analyzes fundamentals, price action, liquidity, volatility, and macro triggers to surface top ideas with clear bull and bear theses, along with risk metrics you can act on within your personal risk framework.
How can I use Swastika’s Sarthi within regulatory guidelines for trading in India?
Use Sarthi to augment your decision-making while following SEBI rules, NSE/BSE disclosures, KYC compliance, risk disclosures, and prudent risk management. AI should assist analysis, not replace your own judgment or compliance steps.
What are the main asset classes Swastika supports for a retail investor in India?
Swastika supports stocks, F&O, mutual funds, IPOs, ETFs, bonds, MCX, SLBM, pledging, research reports, and Sarthi. This enables a diversified yet cohesive research and trading workflow for retail investors.
How does Sarthi help with risk management when shortlisting stocks?
Sarthi provides a risk heat map and quantified risk metrics for each shortlisted stock, enabling you to compare upside potential against acceptable downside within your defined risk tolerance and horizon.
What is a practical way to start using AI-assisted research in my Indian trading routine?
Begin with a small, documented watchlist and a weekly review, using Sarthi to generate bull/bear theses, then validate with Swastika’s research and regulator disclosures. Gradually expand as you gain confidence and maintain a disciplined risk framework.
Where can I learn about regulatory guidelines affecting Indian retail investors?
Consult SEBI publications, NSE/BSE exchange rules, and standard KYC and risk disclosure requirements. These sources provide the official framework you should follow when trading with AI-assisted tools like Sarthi.
Conclusion
This article was published without a generated conclusion. Please review and add a conclusion before publishing
Open your trading and demat account here
CSM Technologies IPO: Should You Apply, Wait, or Avoid?
Key Takeaways
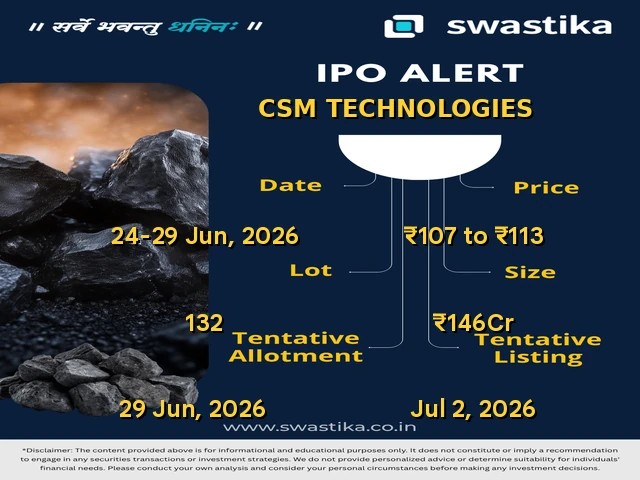
- CSM Technologies IPO details: price band ₹107–₹113, 1.29 crore shares, up to ₹146 crore.
- GMP data not available yet; subscription data not disclosed.
- Key risk: no financials provided and several critical details (registrar/lead manager) are still to be announced.
- Watchlist this IPO for now and decide on applying only after more transparency and GMP cues.
CSM Technologies IPO valuation: is ₹107–₹113 fair for a newcomer?
There is no revenue or profit data in the provided material, so a traditional P/E or EV/EBITDA comparison isn’t possible. The price band sits at ₹107–₹113 for a 132-share lot, which yields a rough indication of market demand expectations but cannot be judged without financials or guidance on margins and growth. Because the issuer’s business details and profitability are not disclosed here, investors must rely on future filings for a fair valuation. No GMP data is available yet which limits the ability to estimate potential listing gains.
CSM Technologies IPO: business background and promoter context
The material describes the issue as a main-board IPO for CSM Technologies Limited and lists basic details like face value, issue size, and the price band. However, it does not provide a detailed business description, promoter background, revenue streams, debt levels, or market position. Registrar and Lead Manager fields are currently marked as To be announced, which is a risk signal for investors awaiting clarity.
CSM Technologies IPO details: price band, lot size, open/close, listing
CSM Technologies IPO: subscription trend and GMP signal
GMP data is not available yet, which means there is no early listing gain indicator. The source does not provide live subscription numbers, so retail investors cannot gauge demand strength from the book. Keep an eye on updates from the registrar and exchange filings for the latest subscription data and GMP movement as the window approaches close.
Should you apply: pros and cons
Pros include a fresh capital infusion that could support growth and expansion, and a listed exchange presence on BSE/NSE with a relatively small issue size. Cons include the absence of revenue, profit data, and many critical IPO details (Registrar, Lead Manager) marked as To be announced, which raises execution and pricing risks. The lack of GMP and concrete business visibility makes it hard to model upside, especially for risk-averse retail investors with limited capital.
How to apply via UPI/ASBA
Applications for IPOs in India are typically made via ASBA (bank-based bid) or UPI-based bidding, with bids placed through your broker’s IPO portal or your bank’s NRE/NRO/FCNR services. Steps commonly include: selecting the CSM Technologies IPO, choosing your bid price within ₹107–₹113, entering your bid quantity (a 132-share lot), and submitting via ASBA or UPI; funds are debited only if your bid gets allotted. To apply, you’ll typically need: a PAN linked to your Demat account, bank account linked for ASBA, and your bid details ready such as price and quantity. Retail investors can apply through platforms like Swastika before the issue closes on 29 Jun 2026, and ensure your bid is placed before close time with correct UPI authentication or bank authorization. Always verify the registrar’s portal and ensure your bid conforms to the lot size and quota rules.
FAQ
Is the CSM Technologies IPO worth applying for at ₹107–₹113?
The provided material lacks financials and GMP cues; with critical details still to be announced, retail investors should treat this as high risk and may prefer to watchlist until more information is available.
What is the lot size and the minimum investment for CSM Technologies IPO?
Lot size is 132 shares; minimum investment data is To be announced in the material.
When is the CSM Technologies IPO opening and listing dates?
Open date is 24 Jun 2026; close date 29 Jun 2026; listing is 2 Jul 2026 on BSE and NSE.
What is the GMP signal for CSM Technologies IPO?
GMP data is not available yet.
What are the key risks with this IPO?
Lack of disclosed revenue/profit data and several details (registrar, lead manager) marked as To be announced.
Conclusion
CSM Technologies' IPO is a small-ticket, fresh-capital issue that lacks disclosed financials and GMP signals, making it a higher-risk, higher-information-gathering situation for retail investors. The absence of a detailed business description and key IPO infrastructure details (registrar, lead manager) means you should treat this as a watchlist candidate until more transparency arrives and GMP cues emerge.
Investors should watchlist this IPO for now, pending GMP data and clearer business fundamentals. Watchlist – because GMP data and concrete business details are not yet clear.
Open your trading and demat account here

MCX Gold Price Today 24 Jun 2026: USD Pressure Pushes Gold to Rs 1.43 Lakh
Key Takeaways
- MCX Gold July futures price at Rs 1,43,070 per 10 grams, down 1.1% intraday.
- MCX Silver July futures price at Rs 2,24,532 per kg, down 0.58%.
- Spot gold price reference fell up to 1.2% and traded below $4,070 per ounce; the U.S. dollar index rose about 0.6% this week.
- The move reflects USD strength and a tech-led equities sell-off, shaping bullion sentiment for Indian investors.
In Indian bullion markets, gold on the MCX declined for a second consecutive session as a stronger U.S. dollar and a tech-driven equity pullback weighed on precious metals. At 9:13 am on Wednesday, MCX Gold July futures were quoted at Rs 1,43,070 per 10 grams, a fall of 1.1% for the session. This intraday level – Rs 1,43,070 per 10 grams – sits near the 1.43‑lakh threshold that many local buyers track when gauging domestic price health. The movement underscores how rupee-denominated gold is sensitive to dollar strength and shifts in global risk sentiment, even as domestic demand remains a key backdrop for price formation in India.
Note: All stock exchange data is delayed up to 3 minutes, a standard caveat for live quotes that investors should keep in mind while referencing intraday moves. The broader narrative around this dip aligns with a global risk-off tone, where currency movements often translate into sharper rupee prices for commodities traded in USD terms.
The global benchmark for spot gold also softened, with the spot reference falling as much as 1.2% and trading below $4,070 per ounce. This spot-level shift, anchored by Bloomberg data in the reported market backdrop, signals a confluence of factors pressuring bullion beyond India’s borders. When spot gold slides, it often foreshadows further softness in domestic futures, given the close linkage between the international price and India’s MCX quotes, even as local buying patterns can provide pockets of resilience in certain demand windows.
Meanwhile, the U.S. dollar gauge advanced about 0.6% for the week, amplifying the downward pressure on gold priced in dollars. A firmer greenback makes dollar-priced bullion more expensive for holders of other currencies and typically drags gold lower in rupee terms unless offset by strong local demand or softening dollar momentum. For Indian investors, this dynamic matters because gold prices in Mumbai reflect a composite of global price signals and currency effects. In practical terms, a rising dollar tends to cap near-term upside, while any signs of USD weakness could open space for a gold relief rally if risk appetite returns.
On the MCX futures complex, silver also moved lower in tandem with gold. MCX Silver July futures were quoted at Rs 2,24,532 per kg, down 0.58% on the day. While silver’s daily percentage move was smaller than gold’s, the same macro drivers–USD strength, equity volatility, and risk-off sentiment–shape the broader precious metals complex in India. Retail investors often watch both metals together, because cross-asset dynamics can provide clues about demand cycles for safe-haven assets and higher-risk asset classes alike.
The latest dip in MCX gold mirrors declines seen in global markets as investors weigh macro signals and currency trajectories. The backdrop described by market watchers points to a broader risk-off mood rather than a purely domestic catalyst, with USD strength acting as a common denominator. For Indian traders and long-term savers alike, this means that near-term gold prices may stay under pressure while the dollar remains firm and risk sentiment wobbles–unless a shift in global cues alters the balance.
To ground this discussion in practical context, MCX stands for the Multi Commodity Exchange of India, which provides the domestic platform for gold and silver futures prices. These quotes–in 10 grams for gold and in kilograms for silver–are the price signals retail investors in India monitor most closely. While the exchange data itself is delayed by a few minutes, the directional move remains a reliable barometer of how price dynamics can evolve within a single trading session. The language of the market is anchored by the intraday price at 9:13 am (Rs 1,43,070 per 10 grams for Gold July futures) and the subsequent update cadence at 9:29 am IST, both of which reinforce how quickly bullion markets respond to macro and sentiment shifts.
For risk-aware investors, the current pattern emphasizes the importance of monitoring currency and equity channels alongside bullion. The international price direction, the domestic rupee trajectory, and the microstructure of MCX futures all interact to shape the daily rhythm of gold’s price path. In a market environment where USD strength coincides with a tech-sector pullback, the potential for volatility remains elevated. This is a time when disciplined risk management and a clear framework for entry and exit become especially valuable for both new and seasoned investors.
As you absorb these signals, consider how cross-asset analytics can sharpen your decision-making. Swastika’s Sarthi AI stock assistant can help you translate cross-asset dynamics into actionable insights, offering research on any stock or index to retail investors. The tool is designed to bring institutional-grade research into a consumer-friendly format, aiding you in understanding how bullion moves relate to equities, bonds, and other asset classes–an especially relevant perspective in today’s USD-driven backdrop.
What Triggered the Gold Decline on MCX? USD Strength and Tech Selloff
The price action on MCX occurred in a context where a stronger U.S. dollar and a tech-led equity selloff were providing headwinds for bullion. The dollar’s strength tends to raise the cost of gold in USD terms, which can pressure local rupee-denominated prices in India. Investors kept a close watch on the relative appeal of hard assets versus risk assets as the week’s trading unfolded. When the U.S. dollar strengthens, gold has to compete with other opportunities for yield and safety in different corners of the global market. The net effect, in this case, was a measurable slip in gold futures on MCX as traders recalibrated expectations around inflation, interest rates, and the pace of economic growth in major economies.
From a practical standpoint, this means that even if local demand remains supported by jewelry demand and investment dieting, the price path for MCX gold is not insulated from external currencies and global risk appetite. The intraday read at 9:13 am – Rs 1,43,070 per 10 grams – is a snapshot of a moment when USD strength and equity volatility intersected with bullion pricing. Last updated data at 9:29 am IST confirms the persistent, real-time nature of this cross-asset conversation and the way it unfolds in the Indian market context.
MCX Silver Price Today: 2,24,532 per kg and 0.58% Fall
While gold took the brunt of the immediate selling pressure, silver futures on MCX also declined as investors favored cash and risk-off positions over speculative bets in precious metals. MCX Silver July futures traded at Rs 2,24,532 per kg, a daily drop of 0.58%. TheSilver move is notable for those who track the broader precious metals complex because silver often responds to the same macro cues as gold but with amplified sensitivity to industrial demand signals. Investors who use silver as a diversification instrument should be mindful of these cross-currents and the way USD strength, global risk, and inflation expectations ripple through the silver market as well as gold.
From the perspective of a retail investor, the combination of a lower gold price and a softer silver price can present a moment to reassess holdings in the precious metals sleeve of a broader portfolio. If a risk-off mood persists, keep the focus on liquidity and risk tolerance. If you have long-term exposure, evaluate whether your core position aligns with your risk framework and whether there are opportunities to rebalance using measured increments rather than large, one-off moves.
Spot Gold Price Trend and USD Index: How They Interact Today
The trend in the global spot market adds color to the domestic picture. The spot price reference fell up to 1.2% and traded below $4,070 per ounce, illustrating how the global price barometer is moving in response to macro forces beyond India’s borders. Bloomberg data anchors this spot-level reading, underscoring the ubiquity of cross-market data streams that influence Indian futures prices. The USD index, a broad gauge of the U.S. dollar’s value against a basket of currencies, has moved higher by about 0.6% for the week, reinforcing the inverse relationship between the dollar and gold in many scenarios. On balance, the USD’s strength remains a central variable in today’s bullion pricing narrative, and this is unlikely to change in the near term unless a new set of macro signals reorients investor risk appetite.
Investors should watch how the dollar behaves into upcoming economic releases and policy expectations. If the dollar shows signs of resilience or acceleration, gold could test additional support or consolidate near current levels. Conversely, any signs of USD weakness or a shift in risk sentiment could reawaken gold’s appeal in rupee terms, especially if domestic demand remains firm and seasonal factors support jewelry buying or investment inflows.
Practical Takeaways for Indian Retail Investors as USD Pressure Persists
For the Indian retail investor, today’s price action reinforces a few practical takeaways. First, currency dynamics matter. Gold in rupees is not just a function of the international bullion price but also of the dollar strength and INR movement. Expect continued volatility near the Rs 1.40–1.45 lakh per 10 grams corridor if the USD remains firm and tech risk remains a feature of global markets. Second, the intraday nature of MCX quotes means timing matters more than in long-horizon savings. A 1% move in a day, as seen here, can translate into meaningful outcomes for short-term traders who manage leverage and collateral carefully. Third, cross-asset awareness helps. Since gold often moves in tandem with the broader risk environment, investors should watch not only bullion-specific cues but also global equities and currency signals to gauge potential follow-through or reversal in the near term.
If you’re seeking a framework to navigate these cross-currents, consider layering risk management strategies that balance core exposure with opportunistic entries. For example, a core-satellite approach that holds a long-term gold allocation while using smaller, disciplined positions to leverage short-term price signals can help manage volatility without abandoning bullion exposure entirely. In a USD-driven environment, this approach preserves exposure to potential mean-reversion when USD momentum wanes, while limiting the downside risk during persistent USD strength.
FAQ
What was the MCX Gold July futures price on 24 June 2026 and how much did it move intraday?
MCX Gold July futures traded at Rs 1,43,070 per 10 grams at 9:13 am on 24 June 2026, down 1.1% for the session.
How did MCX Silver July futures perform on the same day?
MCX Silver July futures were at Rs 2,24,532 per kg, down 0.58% for the day.
What was the spot gold price trend and its level around that date?
Spot gold reference fell up to 1.2% and traded below $4,070 per ounce, with Bloomberg data anchoring the spot level.
How did the U.S. dollar influence gold prices during the week of 24 June 2026?
The U.S. dollar gauge advanced about 0.6% for the week, which generally puts downward pressure on gold priced in USD terms and can translate into weaker rupee-priced gold in the near term.
What does this mean for Indian retail investors looking at MCX gold and other assets?
Investors should monitor USD direction and global risk appetite, as these are the primary drivers of near-term bullion moves. A risk-managed approach—such as a core-satellite strategy—and awareness of cross-asset dynamics can help, and AI-powered tools like Swastika’s Sarthi can provide institutional-grade cross-asset insights.
Conclusion
The current gold move on MCX underscores how currency strength and global risk sentiment can overshadow domestic demand patterns in the near term. For Indian retail investors, the price trajectory around Rs 1.43 lakh per 10 grams remains sensitive to USD direction and equity volatility. The intraday snapshot at 9:13 am showing Rs 1,43,070 per 10 grams, with a 9:29 am refresh, illustrates the tempo of price discovery in today’s cross-asset environment. If the USD sustains its rise and tech risk stays in play, gold could remain technically fragile in the short run; if the dollar cools or risk appetite improves, the path could tilt toward stabilization or a relief bounce in rupee terms.
Open your trading and demat account here

Why Sensex Fell 550 Points Today and Nifty 23900: Key Triggers Behind the Rs 5 Lakh Crore Selloff
Key Takeaways
- Sensex fell about 550 points; Nifty hovered near 23900.
- Market cap erosion neared Rs 5 lakh crore across equities.
- The move reflects a mix of global cues and domestic factors.
- Retail investors should manage risk and use research tools like Sarthi for stock ideas.
A sharp 550-point drop in the Sensex and a test of 23900 on the Nifty have raised a critical question for every retail investor: is this a one-day blip or a shift in trend? As per NSE data, the Sensex fell about 550 points while the Nifty hovered near 23900, signaling risk-off sentiment across Indian equities. The net effect: nearly Rs 5 lakh crore in market capitalization was wiped out across listed stocks, underscoring the magnitude of the move.
The story behind the move is multi-layered, anchored in a mix of global cues and domestic factors that shift risk appetite. While the exact triggers may vary by sector, the broad picture is one of re-pricing risk in equities in response to evolving macro signals.
For retail investors, this is not a call to abandon equities but a reminder to rethink exposure, recalibrate risk, and look for high-conviction opportunities with favorable risk-reward profiles. It’s not a call to abandon equities, but a reminder to use structured approaches to navigate volatility and preserve long-term goals.
Why Sensex Fell 550 Points Today and Nifty 23900: What Investors Need to Know
According to NSE data, the Sensex declined around 550 points and the Nifty traded near 23900, reflecting a broad-based selloff across major indices. The price action indicates risk-off sentiment with broad sector participation; the market cap erosion observed aligns with the price declines.
Investors should view this as a sign to assess individual risk tolerance and the quality of holdings, particularly in cyclicals and rate-sensitive sectors. The price move is not isolated but part of a wider move influenced by external and internal drivers.
Key Triggers Behind the Rs 5 Lakh Crore Selloff: Global Cues and Domestic Factors
The selloff has been driven by a mix of global cues and domestic factors. Global cues have turned risk-off as investors reassess growth prospects and inflation trajectories, while domestic dynamics contribute to volatility through changes in risk tolerance, sectoral expectations, and valuations. Collectively, these factors contributed to a near Rs 5 lakh crore erosion in market capitalization, as per NSE data.
The exact triggers vary by sector and instrument, but the narrative remains that concerns on global growth, policy expectations, and domestic liquidity conditions are influencing selling pressure, prompting market participants to reprice risk.
How Global Cues Are Shaping Indian Equity Markets Right Now
With global markets in a risk-off tone, the Indian equity market often moves in tandem with external perfomance, while still reacting to domestic developments. Investors should watch global indices, commodity prices, currency trends, and relative yields as leading indicators of risk appetite.
Domestic Catalysts That Intensified Selling Pressure in Indian Stocks
Domestic factors influencing volatility include macro data surprises, policy commentary, and liquidity dynamics. Investors should interpret these signals relative to their investment horizon, risk capacity, and stock-specific fundamentals.
Which Sectors Drove the Fall and What It Means for Your Portfolio
The decline has been broad-based across sectors, indicating a risk-off mood. For retail investors, this highlights the need to focus on quality businesses with robust financial health, diversify across majors, and avoid panic selling that locks in losses. The right approach is to rebalance with care, focusing on durable franchises with a history of resilience.
Note: If you're seeking granular stock-level insights to help you refine selections, Swastika’s Sarthi AI stock assistant provides institutional-level research on any stock or index to retail investors.
Risk Management and Practical Steps for Retail Investors in Volatile Markets
Practical steps include defining a risk budget, diversifying across asset classes, and using predefined stop losses or alerts. Focus on quality companies with low leverage and stable cash flows. Avoid overreacting to every dip and instead plan batch additions to portfolios based on valuation discipline and risk appetite.
One mental model is to view equity exposure as a risk budget rather than a single bet; allocate capital to segments you can hold through volatility, and use measured entries to deploy cash on attractive dips.
What Should Retail Investors Do Next? Practical Actionable Steps
Consider a staged re-entry: begin with a small allocation to baseload names you understand well, and keep reserve capital for additional purchases as valuations adjust. Use limit orders and risk controls to manage downside, maintain liquidity for choppier markets, and keep a long-term perspective aligned with goals.
FAQ
What caused Sensex to fall 550 points and Nifty to test 23900 today?
A combination of global cues and domestic factors created a risk-off mood in Indian equities; NSE data shows the Sensex fell around 550 points and the Nifty traded near 23900.
How much wealth was eroded due to the selloff?
The market-wide move contributed to nearly Rs 5 lakh crore in erosion of market capitalization across listed equities, according to NSE data.
What should retail investors do in such volatile markets?
Maintain a disciplined approach: diversify, fix risk budgets, avoid panic selling, consider staged entry on dips, and use reliable stock research tools such as Swastika’s Sarthi AI to research stocks or indices.
What role do global cues play in Indian equity moves like today?
Global cues influence risk appetite and can drive risk-off or risk-on flows; in volatile sessions, Indian equities often reflect external conditions while reacting to domestic factors.
How can Swastika help during market volatility?
Swastika offers Sarthi, an AI stock assistant that provides institutional-level research on any stock or index, helping retail investors assess risks and identify opportunities during volatility.
Conclusion
For the retail investor, today’s action signals the importance of a disciplined, data-driven approach to risk and investment horizon. The 550-point slide in Sensex and the Nifty’s test of 23900 reflect a broad risk-off mood that can present both threat and opportunity, depending on how you respond.

FII net buyers in Indian equities USD 899 million over five sessions: implications for retail investors
Key Takeaways
- FII net buyers in Indian equities USD 899 million over five sessions, per NSE data.
- The five-session window signals sustained foreign appetite for Indian stocks.
- Retail investors should monitor flow trends to gauge momentum and adjust risk management.
- Swastika's Sarthi AI stock assistant helps interpret institutional flows and spot opportunities.
Five sessions. USD 899 million. The question the market will be asking: is this the start of a new wave of foreign buying in Indian equities or a fleeting pause? Data from NSE shows that foreign institutional investors turned net buyers in equities during this five-day window, injecting USD 899 million into the market. For retail investors across India, this is not just a headline–it’s a signal that foreign demand has re-emerged, potentially influencing index momentum and stock-specific dynamics in the near term.
FII net buyers in Indian equities USD 899 million over five sessions: raw numbers and data source
From NSE data, the net purchases by foreign institutional investors in Indian equities amounted to USD 899 million across five sessions. This figure reflects net inflows in the equity segment, excluding other segments such as debt or derivatives. The data is derived from daily FII activity reported by the exchange and is a widely cited gauge of foreign investor sentiment. For retail investors, the key takeaway is that there was consistent buying pressure across the five-session window, pointing to renewed interest in Indian equities from foreign funds.
What the five-session FII inflow signals about market sentiment in India
The five-session stretch of net purchases indicates a shift in foreign investor mood, suggesting a broader risk-on appetite for Indian equities. While a five-day sample is not a guarantee of a lasting trend, it aligns with a period of improved global cues and domestic earnings resilience that can support near-term upside potential for large-cap indices and select mid-cap names. Retail investors should consider this signal as one input among many–valuation, earnings quality, and macro backdrop matter as much as flow data when making decisions.
What retail investors should do when FIIs show sustained inflows
When foreign investors are net buyers over multiple sessions, retail investors should approach with a structured plan: 1) Check your risk tolerance; 2) Focus on quality stocks with sound fundamentals; 3) Use disciplined position sizing; 4) Use protective stops to manage volatility; 5) Avoid chasing momentum; 6) Use a systematic rebalancing approach. For retail investors, a sustained FII inflow invites a more constructive stance, but it does not justify blind chasing of momentum. Start with a risk assessment aligned with your time horizon. Consider focusing on quality, cash-generative businesses, and those with resilient balance sheets. Use proper position sizing and stop losses; grid or trailing stops; Keep an eye on valuations; Approach with a plan. If you're uncertain about stock selection, you can rely on Swastika's Sarthi AI stock assistant to filter stocks and provide institutional-grade analysis for a stock or index.
How to monitor future foreign flows: reliable data sources and indicators
To stay ahead of the next wave of flows, monitor daily FII activity from the exchange (NSE) and track weekly or monthly net flows. Consider the 5-day moving average; plus the Net Buy/Sell data. Reliable monitoring starts with NSE data, which provides daily FII net flow in equities. You can cross-check with BSE and RBI data for broad context. Track the five-session momentum and the 5- and 20-day moving averages to gauge trend stability. Use additional indicators such as sector-level inflows, index-level performance, and the performance of flows in your stock universe to calibrate decisions.
FAQ
What is the total FII net buying amount in Indian equities over the five sessions?
USD 899 million, according to NSE data.
Over how many sessions did this net buying occur?
Five sessions.
What is the data source for these numbers?
NSE data (exchange data) reporting FII activity in equities.
What does this mean for retail investors?
It signals rising risk appetite and potential near-term momentum in Indian equities, but flows are not a guarantee of profits; maintain risk discipline.
What should retail investors watch next?
Watch continued FII inflows, sector-wise trends, and macro cues; also use research tools like Swastika's Sarthi for institutional-level insights.
Conclusion
For the Indian retail investor, the USD 899 million five-session FII inflow signals a renewed global appetite for Indian equities and may provide a supportive near-term backdrop. It hints at a shift in risk sentiment among foreign funds, which can influence price action across indices and individual stocks. But flows can reverse, and valuations, earnings, and macro cues still matter. Treat this signal as one input among many in a disciplined investment plan, not as a single trigger for action.

Amber Enterprises Target Price Upgraded; Retains Reduce: What It Means for Retail Investors
Key Takeaways
- HDFC Securities raised Amber Enterprises' target price but retained a Reduce rating.
- The note cites potential earnings growth and margin improvements, offset by valuation risks.
- Retail investors should reassess entry points and strengthen risk management.
- Swastika's Sarthi AI stock assistant can help compare Amber with peers and refine decisions.
When a broker lifts the target price for Amber Enterprises yet keeps a Reduce rating, retail investors are faced with a paradox: optimism on price targets paired with a conservative stance on immediate action. The latest broker note indicates a higher target price for Amber Enterprises while maintaining a Reduce rating, signaling a nuanced view of upside potential versus risk. In the Indian stock market, such moves can influence price action, investor sentiment, and mid term strategy as markets digest both the optimism and caution.
Why HDFC Securities Ups Target Price on Amber Enterprises Yet Retains a Reduce Rating
The note points to factors that could support earnings expansion and margin improvement, including an improving revenue trajectory and a favorable capex cycle. Despite these positives, the rating remains Reduce due to valuation concerns and potential macro headwinds that could cap upside. This combination signals to investors that there is upside in the stock if execution and macro conditions cooperate, but the risk-reward remains skewed toward caution.
What the Amber Enterprises Target Price Upgrade Signals About Growth, Margins, and Orders
With an upgraded target price, the broker hints at confidence in an improving earnings mix, better cost management, and a stronger order book that could translate into higher margins. The view implies Amber Enterprises could benefit from product mix optimization, capex-led capacity additions, and favorable commodity pricing dynamics in the near to medium term. Investors should interpret this as a cautious optimism that earnings visibility might improve, even if the current price already reflects some optimism.
How The Amber Enterprises Update Could Affect Retail Investors' Trading Plans
Retail investors should rethink entry points and risk controls in light of a higher target price and a Reduce rating. The absence of a buy rating means it may be prudent to observe price action, liquidity, and relative valuation versus peers before initiating new positions. A disciplined approach–monitor price action, set stop losses, and align with a defined time horizon–can help manage risk while staying open to upside catalysts.
Key Risks and Valuation Considerations For Amber Enterprises After The Note
Valuation remains a key consideration even after an upgrade, especially if earnings do not accelerate as anticipated. Macroeconomic headwinds, supply chain dynamics, and execution risks on capex could temper upside. Raw material price volatility and currency movements can also affect margins. Investors should weigh these risks against potential catalysts and adopt a balanced view rather than chasing a single narrative.
FAQ
What action did HDFC Securities take on Amber Enterprises in its note?
HDFC Securities raised Amber Enterprises' target price but retained a Reduce rating.
Why did the note upgrade the target price while keeping a Reduce rating?
The note cites potential earnings growth and margin improvement as drivers for a higher target price, but keeps a Reduce rating due to valuation concerns and macro headwinds.
What should a retail investor do after such an update?
Reassess entry points, manage risk with stop losses, compare Amber with peers, and consider waiting for a clearer catalyst before building a new position.
What factors could drive Amber Enterprises' upside according to the note?
A stronger order book, better cost management, margin expansion, and a favorable capex cycle could drive earnings growth and support the higher target price.
Where can investors find more data to evaluate Amber Enterprises against peers?
Investors should refer to primary market data from NSE and BSE price data and review Amber Enterprises' company filings for fundamentals; Swastika also offers Sarthi AI stock research to compare with peers.
Conclusion
Conclusion paragraph one: The combination of a higher target price and a Reduce rating in a broker note signals upside potential tempered by risk. For the retail investor, this means staying vigilant about valuation, tracking execution, and using a structured decision framework to decide whether to hold, add on weakness, or wait for a clearer catalyst.
Big Budget


Popular Articles


.avif)
.avif)

.avif)


START YOUR INVESTMENT JOURNEY
Get personalized advice from our experts
- Dedicated RM Support
- Smooth and Fast Trading App
